


Operations Management Powerpoint Presentation Slides





Try Before you Buy Download Free Sample Product
 Impress Your
 Audience
 100%
100% Editable
 Save Hours
 of Time


Operations Management PowerPoint Presentation Slides allows the organization to measure the performance of its operations. Requirement engineering PowerPoint complete deck describe in detail about operation management process, operational goals, process timeline, competitive analysis value map, strategies for forward and backward integration, operation strategy, productivity table, forecasting table, system and design, product and service design, capacity planning for product, facility layout, location planning and analysis, quality management system, quality control timeline, supply chain management, inventory management and scheduling, inventory turnover KPIs, lean manufacturing to name a few. Explain goals of competitive criteria goals like cost, quality, speed, flexibility, reliability, etc with this visually stunning project production management PPT slides. Showcase the steps of capacity strategy planning. Design of work system, process, technology, people and infrastructure management can be well explained with this business process mapping PowerPoint templates. Furthermore, using this business operation presentation design, you can brief your audience about aggregate production planning, effective lean techniques, inventory scheduling, project management, roles and responsibilities matrix, work breakdown structure, etc.
People who downloaded this PowerPoint presentation also viewed the following :
Content of this Powerpoint Presentation
Slide 1: This slide introduces Operations Management. State Your Company Name and begin.
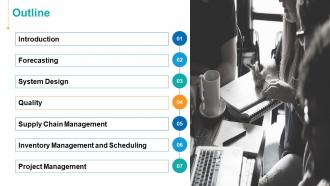
Slide 2: This slide shows Outline of the presentation.
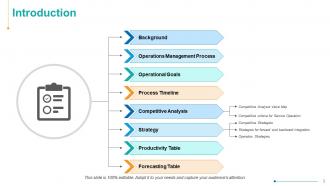
Slide 3: This slide presents Introduction describing- Forecasting Table, Productivity Table, Strategy, Competitive Analysis, Process Timeline, Operational Goals, Operations Management Process, Background.
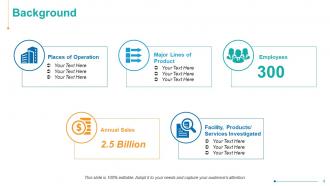
Slide 4: This slide displays Background describing- Places of Operation, Major Lines of Product, Employees, Facility, Products/Services Investigated, Annual Sales.
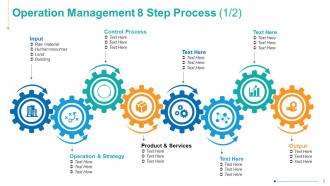
Slide 5: This slide represents Operation Management 8 Step Process. You can add data as per requirements.
Slide 6: This slide showcases Operation Management 7 Step Process with icons and text boxes.
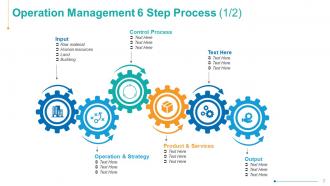
Slide 7: This slide shows Operation Management 6 Step Process. You can add or edit data as per requirements.
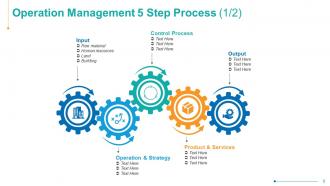
Slide 8: This slide presents Operation Management 5 Step Process.
Slide 9: This slide displays Operation Management Process describing- Monitoring & Control, Inputs, Transformation System, Outputs, Environment.
Slide 10: This slide represents Operations Goals with related imagery and text.
Slide 11: This is another slide for Operations Goals describing- Goals, measures, targets, frequency and year to date.
Slide 12: This slide showcases Process Timeline on yearly and quarterly basis. You can add or edit data as per needs.
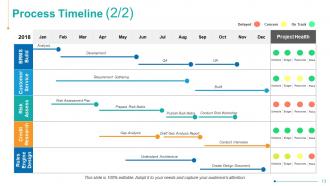
Slide 13: This is another slide displaying Process Timeline on monthly basis.
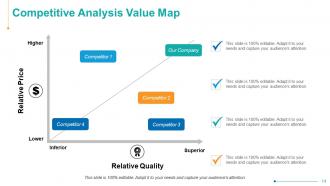
Slide 14: This slide shows Competitive Analysis Value Map comparing quality and price.
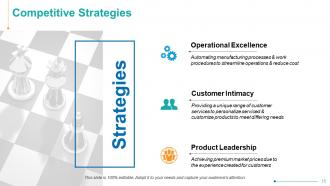
Slide 15: This slide presents Competitive Strategies describing- Operational Excellence, Customer Intimacy, Product Leadership.
Slide 16: This slide displays Competitive Criteria For Service Operations.
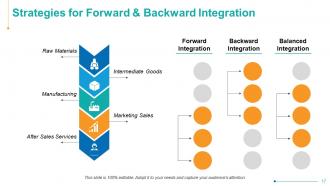
Slide 17: This slide represents Strategies for Forward & Backward Integration describing- Raw Materials, Intermediate Goods, Manufacturing, Marketing Sales, After Sales Services.
Slide 18: This slide showcases Operation Strategy with- Top-down Perspective, Market Requirements Perspective, Bottom-up Perspective, Operations Resources Perspective.
Slide 19: This slide shows Productivity Table. You can change the data as per requirements.
Slide 20: This slide presents Forecasting with related diagram and additional text boxes to show information.
Slide 21: This slide displays Forecasting Table on monthly basis.
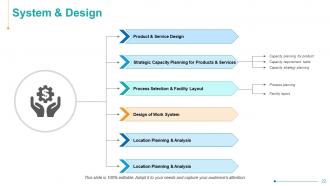
Slide 22: This slide represents System & Design describing- Product & Service Design, Strategic Capacity Planning for Products & Services, Process Selection & Facility Layout, Design of Work System, Location Planning & Analysis.
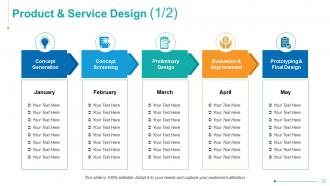
Slide 23: This slide showcases Product & Service Design describing- Concept Generation Concept Screening Evaluation & Improvement Prototyping & Final Design Preliminary Design
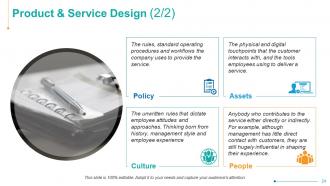
Slide 24: This is another slide for Product & Service Design describing- Assets, People, Culture and Policy.
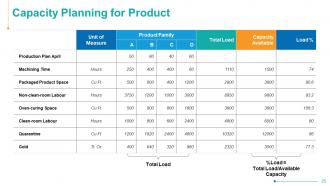
Slide 25: This slide shows Capacity Planning for Product.
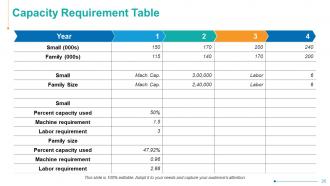
Slide 26: This slide presents Capacity Requirement Table. You can change the data as per needs.
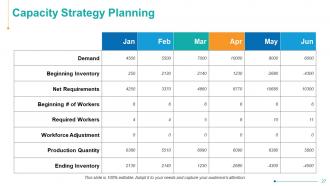
Slide 27: This slide displays Capacity Strategy Planning in tabular form.
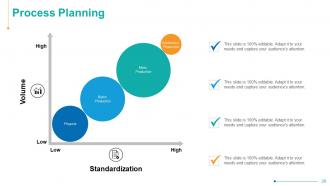
Slide 28: This slide represents Process Planning comparing standardization and volume.
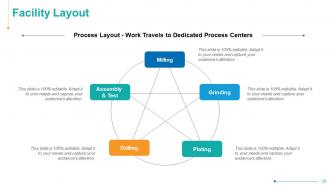
Slide 29: This slide showcases Facility Layout describing- Milling, Assembly & Test, Drilling, Plating, Grinding.
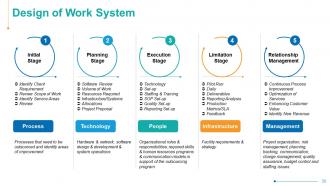
Slide 30: This slide shows Design of Work System describing- Process, Technology, People, Infrastructure, Management.
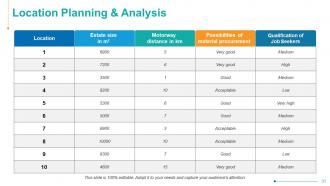
Slide 31: This slide presents Location Planning & Analysis in tabular form with categories as- Location, Estate size, Motorway distance, Possibilities of material procurement and Qualification of Job Seekers.
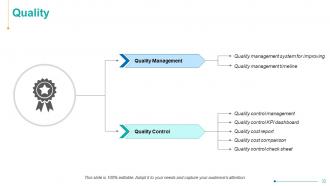
Slide 32: This slide is titled as Quality describing Quality management and Quality control.
Slide 33: This slide displays Quality Management System for Improving describing- Verify & Process, Stock & Materials, Plan & Equipment, Records & Documentation, Human Resources, Environmental Resources, Analysis & Monitoring.
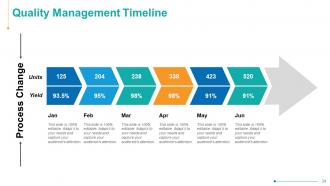
Slide 34: This slide represents Quality Management Timeline on monthly basis.
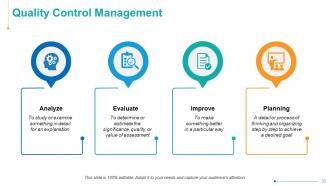
Slide 35: This slide showcases Quality Control Management Planning, Analyze, Evaluate, Improve.
Slide 36: This slide presents Quality Control KPI Dashboard showing data in forms of graph.
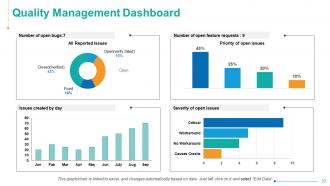
Slide 37: This slide shows Quality Management Dashboard with chart and bar graphs.
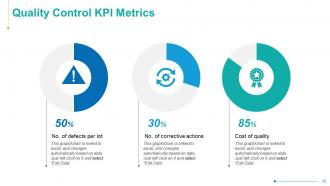
Slide 38: This slide displays Quality Control KPI Metrics describing- No. of defects per lot, No. of corrective actions, Cost of quality.
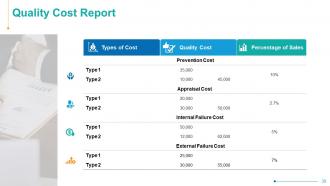
Slide 39: This slide represents Quality Cost Report in tabular form with categories as- Types of Cost, Quality Cost, Percentage of Sales.
Slide 40: This slide showcases Quality Cost Report Comparison on yearly basis.
Slide 41: This slide shows Quality Control Check Sheet.
Slide 42: This slide presents Supply Chain Management describing- Supply Chain Management Process, Supply Chain KPI Dashboard, Supply Chain Management Bifurcation, Supply Chain Management Goals, Components of Supply Chain, Supply Chain Management Advantages, Supply Chain KPI Metrics.
Slide 43: This slide displays Supply Chain Management Process describing- Raw Materials, Supplier, Manufacturing, Retail, Consumer.
Slide 44: This is another slide displaying Supply Chain Management Process.
Slide 45: This slide represents Supply Chain Management Goals with related icons and text.
Slide 46: This slide showcases Supply Chain Management Bifurcation describing- Supply Chain Strategy, Supply Chain Planning, Supply Chain Enterprise Applications, Asset Management, Logistics, Product Life Cycle Management, Procurement.
Slide 47: This slide shows Components of the Supply Chain describing- Supply, Manufacturing, Retail, Consumer, Distribution & Warehousing.
Slide 48: This slide presents Supply Chain Management Advantages.
Slide 49: This slide displays Supply chain KPI Dashboard with the help of graphs.
Slide 50: This is another slide displaying Supply Chain Management KPI Dashboard.
Slide 51: This slide represents Supply Chain KPI describing- Percentage of Problem With Supplier, Number of Active Suppliers Per Supply Employee, Requested Time In Full.
Slide 52: This slide displays Inventory Management & Scheduling describing- Inventory Management System, Scheduling, Inventory Tracker Table, Inventory & Logistics Management, Aggregate Planning, Lean Manufacturing.
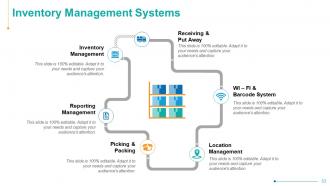
Slide 53: This slide represents Inventory Management Systems describing- Picking & Packing, Reporting Management, Receiving & Put Away, WI – FI & Barcode System, Location Management, Inventory Management.
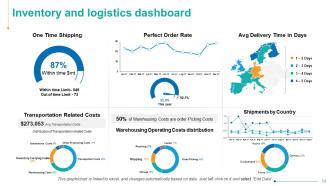
Slide 54: This slide showcases Inventory and logistics dashboard describing- One Time Shipping, Avg Delivery Time in Days, Warehousing Operating Costs distribution, Transportation Related Costs, Shipments by Country.
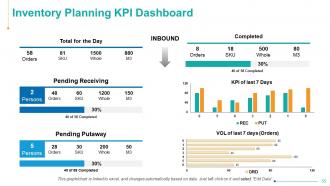
Slide 55: This slide shows Inventory Planning KPI Dashboard.
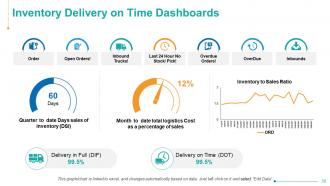
Slide 56: This slide presents Inventory Delivery on Time Dashboards.
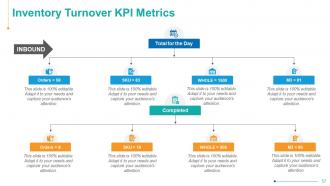
Slide 57: This slide displays Inventory Turnover KPI Metrics.
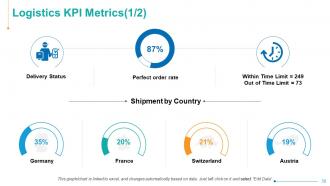
Slide 58: This slide represents Logistics KPI Metrics describing- Shipment by Country, Perfect order rate, Delivery Status.
Slide 59: This is another slide representing Logistics KPI Metrics.
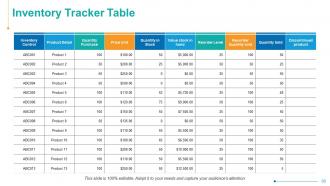
Slide 60: This slide showcases Inventory Tracker Table. You can add or edit data as per requirement.
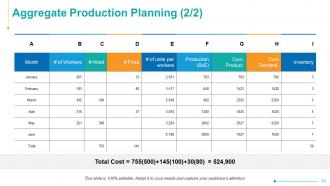
Slide 61: This slide shows Aggregate Production Planning in tabular form.
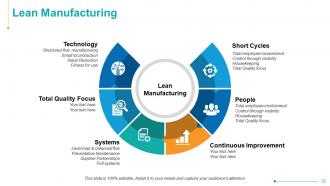
Slide 62: This slide presents Lean Manufacturing describing- People, Total Quality focus, Continuous Improvement, Systems, Technology, Short Cycles.
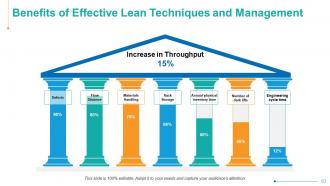
Slide 63: This slide displays Benefits of Effective Lean Techniques and Management.
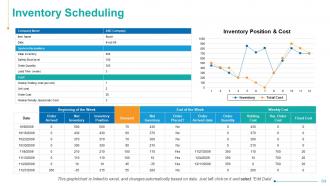
Slide 64: This slide represents Inventory Scheduling with help of tables and graph.
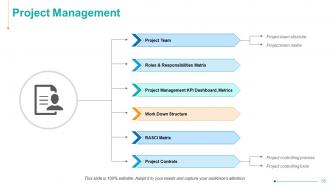
Slide 65: This slide showcases Project Management describing- Project Controls, RASCI Matrix, Work Down Structure, Project Management KPI Dashboard, Metrics, Roles & Responsibilities Matrix, Project Team.
Slide 66: This slide shows Project Team in hierarchy form.
Slide 67: This is another slide presenting Project Team.
Slide 68: This slide presents Project Team Matrix with designation.
Slide 69: This slide displays Roles & Responsibilities Matrix.
Slide 70: This slide represents RASCI Matrix describing person Responsible, Accountable, Consulted, Informed, Supportive.
Slide 71: This slide showcases Work breakdown Structure in form of tree diagram.
Slide 72: This is another slide showing Work breakdown Structure.
Slide 73: This slide shows Project Management Priority Dashboard with the help of tables and graphs.
Slide 74: This slide presents Project Management Monthly Growth Dashboard.
Slide 75: This slide displays Project Status KPI Metrics with sales on monthly basis.
Slide 76: This slide represents Project Status KPI Metrics with project expenditure.
Slide 77: This slide showcases Project Controlling Process with related diagram.
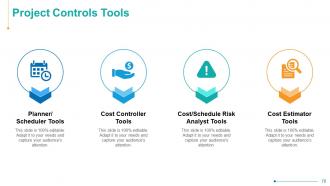
Slide 78: This slide shows Project Controls Tools describing- Planner/ Scheduler Tools, Cost Controller Tools, Cost/Schedule Risk Analyst Tools, Cost Estimator Tools.
Slide 79: This is a Thank You slide with address, contact numbers and email address.
Operations Management Powerpoint Presentation Slides with all 79 slides:
Use our Operations Management Powerpoint Presentation Slides to effectively help you save your valuable time. They are readymade to fit into any presentation structure.
-
Operations Management
-
Outline
-
Introduction
-
Background
-
Operation Management 8 Step Process 1 2
-

Operation Management 7 Step Process 1 2
-
Operation Management 6 Step Process 1 2
-
Operation Management 5 Step Process 1 2
-
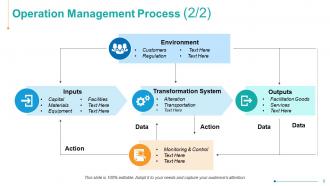
Operation Management Process 2 2
-
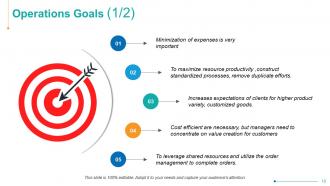
Operations Goals 1 2
-
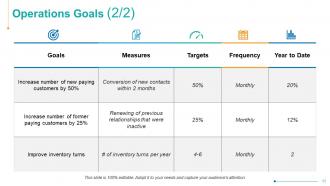
Operations Goals 2 2
-
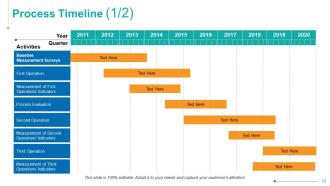
Process Timeline 1 2
-
Process Timeline 2 2
-
Competitive Analysis Value Map
-
Competitive Strategies
-

Competitive Criteria for Service Operations
-
Strategies for Forward Backward Integration
-
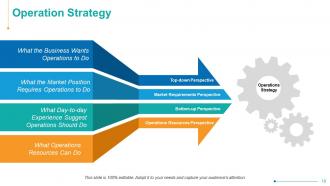
Operation Strategy
-
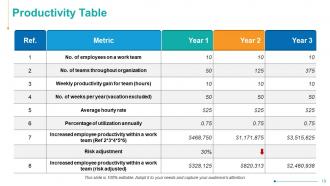
Productivity Table
-
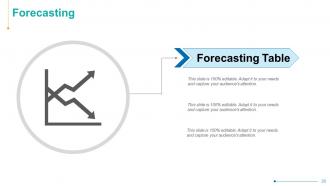
Forecasting
-
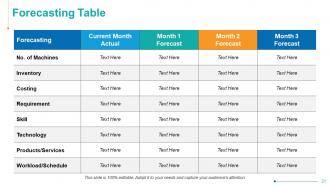
Forecasting Table
-
System Design
-
Product Service Design 1 2
-
Product Service Design 2 2
-
Capacity Planning for Product
-
Capacity Requirement Table
-
Capacity Strategy Planning
-
Process Planning
-
Facility Layout
-
Design of Work System
-
Location Planning Analysis
-
Quality Management System
-

Quality Management System for Improving
-
Quality Management Timeline
-
Quality Control Management
-

Quality Control KPI Dashboard
-
Quality Management Dashboard
-
Quality Control KPI Metrics
-
Quality Cost Report
-
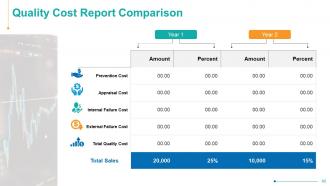
Quality Cost Report Comparison
-
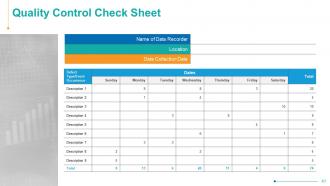
Quality Control Check Sheet
-
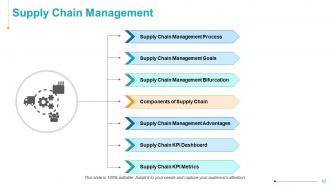
Supply Chain Management
-
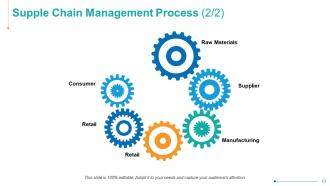
Supple Chain Management Process 2 2
-
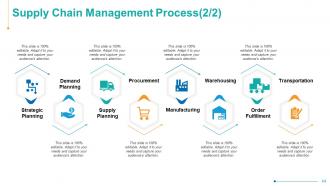
Supply Chain Management Process 2 2
-
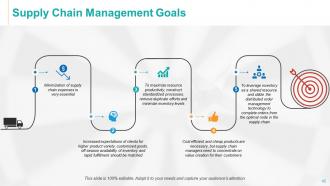
Supply Chain Management Goals
-
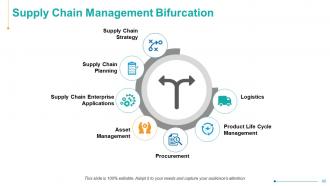
Supply Chain Management Bifurcation
-
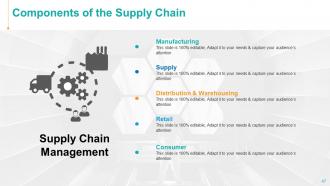
Components of the Supply Chain
-
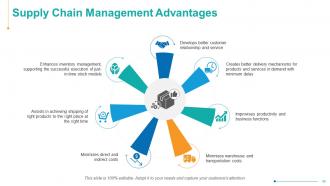
Supply Chain Management Advantages
-
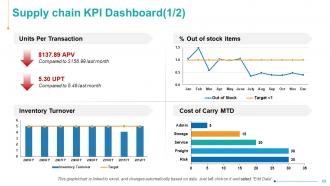
Supply chain KPI Dashboard 1 2
-

Supply Chain Management KPI Dashboard 2 2
-
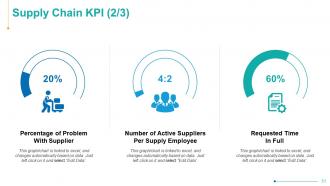
Supply Chain KPI 2 3
-
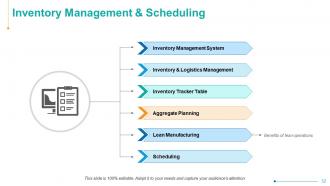
Inventory Management Scheduling
-
Inventory Management Systems
-
Inventory and logistics dashboard
-
Inventory Planning KPI Dashboard
-
Inventory Delivery on Time Dashboards
-
Inventory Turnover KPI Metrics
-
Logistics KPI Metrics 1 2
-

Logistics KPI Metrics 2 2
-
Inventory Tracker Table
-
Aggregate Production Planning 2 2
-
Lean Manufacturing
-
Benefits of Effective Lean Techniques and Management
-
Inventory Scheduling
-
Project Management
-
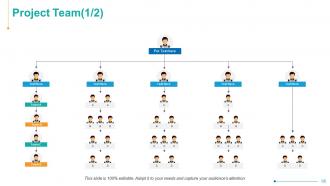
Project Team 1 2
-
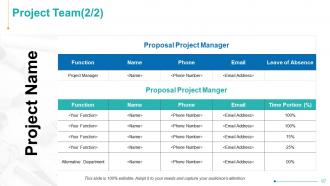
Project Team 2 2
-
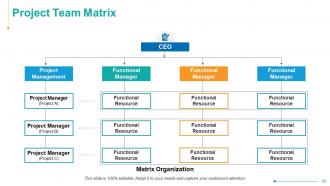
Project Team Matrix
-
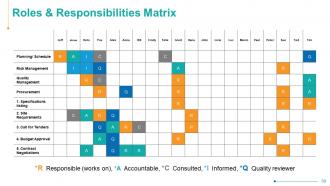
Roles Responsibilities Matrix
-
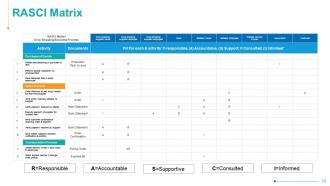
RASCI Matrix
-
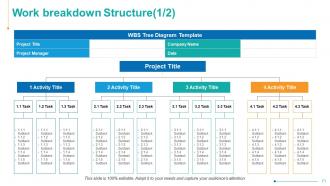
Work Breakdown Structure 1 2
-
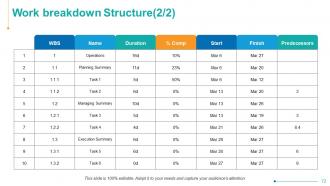
Work Breakdown Structure 2 2
-
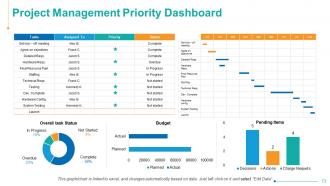
Project Management Priority Dashboard
-
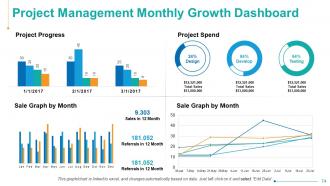
Project Management Monthly Growth Dashboard
-
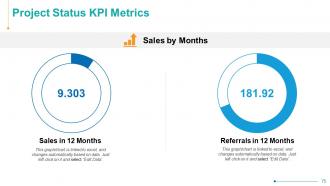
Project Status KPI Metrics
-
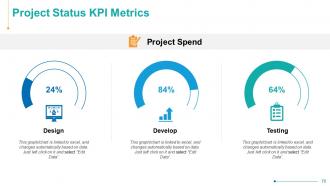
Project Status KPI Metrics
-
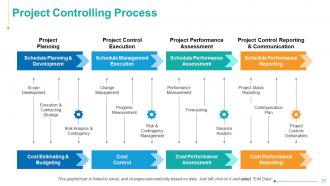
Project Controlling Process
-
Project Controls Tools
-

Thank You
FAQs for Operations Management
Look, start by mapping out what you're currently doing - that's where you'll spot the biggest bottlenecks. Cut waste wherever you find it (time, materials, pointless steps). Standardize your workflows so things actually run smoothly instead of being chaotic every day. Honestly, measuring everything with clear metrics is annoying but super necessary. Keep your customers at the center of decisions - if it doesn't help them, why do it? Focus on continuous improvement and lean operations. Oh, and don't forget supply chain stuff, that can make or break efficiency gains.
Start by mapping out your whole process so you can actually see where things get stuck. Focus on those "8 wastes" - stuff like overproduction, waiting around, defects, that kind of thing. The 5S organization method works pretty well for cutting down time spent hunting for tools (though honestly the naming is kinda cheesy). Pull systems with kanban cards are solid - you'll only make what's actually needed instead of guessing. Get your team doing regular kaizen sessions since they know the daily headaches better than anyone. Pick one line as your test case, find the biggest waste there, and hit that first. Don't try to fix everything at once.
Your supply chain is honestly the backbone of everything - mess it up and your whole operation falls apart. Late materials? Your delivery times tank. Poor inventory management? Costs go through the roof and customers get pissed. I've seen companies turn things around just by getting their supplier relationships right and fixing their logistics flow. Map out what you've got now first - you'll probably spot the biggest problems pretty quickly. Focus on those pain points before trying to optimize everything at once. It's crazy how much smoother operations run when your supply chain actually supports your goals instead of fighting them.
Dude, this stuff actually works pretty well. IoT sensors can track your inventory and equipment performance automatically - no more paying people to walk around with clipboards. The AI part analyzes all that data and spots patterns you'd miss, plus it gives you heads up before machines break down. Demand forecasting gets way more accurate too. I'd honestly start with something simple like inventory tracking first, then add more once you see how much time it saves. The predictive maintenance alerts alone are worth it - beats the hell out of surprise equipment failures.
Service ops are way trickier than manufacturing, honestly. You can't stockpile services like products - everything happens in real time with customers right there watching. Quality gets messy because it depends so much on whoever's working that day. Demand swings are brutal too (restaurants are dead at 3pm, slammed by 7). Your staff basically ARE your product, which sounds cheesy but it's true. I've seen great businesses tank because of bad hiring. Focus on flexible scheduling and train people well - oh, and accept that some days will just be chaos no matter what you do.
Think of QMS as the backbone for all your other operational improvements. Consistent processes mean fewer defects and way less scrambling to fix things last minute. Your team actually gets to focus on productive work instead of constantly putting out fires - which honestly keeps everyone way happier too. Better data visibility helps you spot real bottlenecks instead of playing guessing games. I'd start by figuring out where quality touches your processes now. Then see which areas would benefit most from some standardization. Trust me, it'll cut down on so much daily chaos.
Focus on four main things: how much you're getting done (throughput and resource use), quality stuff like defect rates and customer satisfaction, costs per unit - because nobody wants angry executives breathing down their neck - and delivery times. Honestly, the trick is picking maybe 3-5 metrics that actually matter for YOUR specific setup. Don't get lost in spreadsheet hell with tons of data. Pick things you can realistically measure and actually do something about. On-time delivery rates are usually a safe bet since customers definitely notice when stuff's late.
Dude, ops management is honestly where you can make the biggest sustainability impact. Start tracking your waste and energy use first - you'll be shocked at what you find. Lean principles are perfect for this since cutting waste saves money AND helps the environment. Switch to energy-efficient equipment when you can, and really look at your supply chain - transportation emissions add up fast. I'd also explore circular economy stuff like reusing materials or designing products to last longer. Don't try to overhaul everything at once though. Pick one process, nail it, then expand from there.
Honestly, the supplier thing is huge - spread your orders around because one vendor *will* screw you over at the worst possible moment. Keep extra stock of anything critical. Cross-train people so you're not toast if someone quits unexpectedly. I'd also set up backup plans for major disasters and put quality checks everywhere. Oh, and document all this stuff! Sounds boring but when everything's falling apart, you'll want that playbook. Regular risk checks help catch issues early too. Trust me on the documentation part - learned that one the hard way.
So project management frameworks are basically your roadmap for handling the big stuff - system upgrades, new products, major process changes. Waterfall or Agile help you tackle these initiatives while your regular operations keep everything running day-to-day. Think of it like renovating your house while still living in it, you know? The trick is not letting your project timelines mess with what's already working. I'd start by figuring out which projects will actually hit your core operations first. That way you won't accidentally break something that's keeping the business alive.
Dude, inventory management is literally what keeps your business running smoothly. You don't want tons of cash tied up in stuff just sitting there, but you also can't afford to run out when customers need something. It's this weird balancing act. Too much stock = storage costs eating your profits. Too little = pissed off customers and lost sales. Honestly, I've seen companies mess this up so badly it's not even funny. The trick is figuring out your demand patterns and how long it takes suppliers to deliver. Then you'll know exactly when to reorder without going overboard.
Data analytics will show you stuff in your operations you'd never notice just looking at reports manually. I'd start tracking things like where production gets stuck, how fast inventory moves, customer demand patterns - then use that for better resource decisions. The crazy thing is how much insight is already sitting in data you probably have. Predictive stuff works great too. Forecast demand spikes, catch equipment issues before they break, streamline your supply chain. Don't go nuts though - pick one process first, show it works, then roll it out wider.
Dude, you definitely need the tech stuff - data analysis is massive right now. I'm talking dashboards, metrics, all that fun stuff to catch problems early. Digital skills are clutch too since everything's automated or in the cloud these days. But honestly? The people side still matters most. Communication and problem-solving will save your ass way more than any certification. You're basically a professional fire-putter-outer who keeps different teams from killing each other. Oh, and pick one analytics tool to master first - gives you instant street cred before worrying about project management certs.
Honestly, cross-functional teams are a game changer because they kill those stupid silos between departments. Picture this: instead of marketing finishing something then tossing it to operations who then bugs IT for approval, everyone's already talking from day one. Decisions happen way faster. Different people catch different problems too - like finance might spot budget issues that marketing totally missed. The whole thing works because teams actually get what others need instead of just making random requests. Oh, and definitely start small with a pilot project first. You'll see the difference in both speed and quality pretty quick.
Start with that one process that's driving everyone nuts and just map it out this week. Monthly reviews are clutch - actually measure stuff instead of going with your gut. I'd focus on getting feedback loops going with your team (they usually spot the weirdest bottlenecks). Lean stuff like 5S and Kaizen workshops sound fancy but they're pretty straightforward. Honestly, the best fixes I've seen came from random employee suggestions during those sessions. Don't go crazy with changes right away - test small tweaks first. Oh, and use real data to make decisions. Sounds obvious but you'd be surprised how many people skip that part.
-
good
-
good
-
Good
-
good job
-
really nice template
-
Visually stunning presentation, love the content.
-
Great product with highly impressive and engaging designs.
-
Excellent design and quick turnaround.
-
Amazing product with appealing content and design.
-
The Designed Graphic are very professional and classic.
-
Page:
- You're currently reading page 1
- Page 2
-
