Performance Measurement System Evaluation Matrix
Try Before you Buy Download Free Sample Product
Audience
Editable
of Time
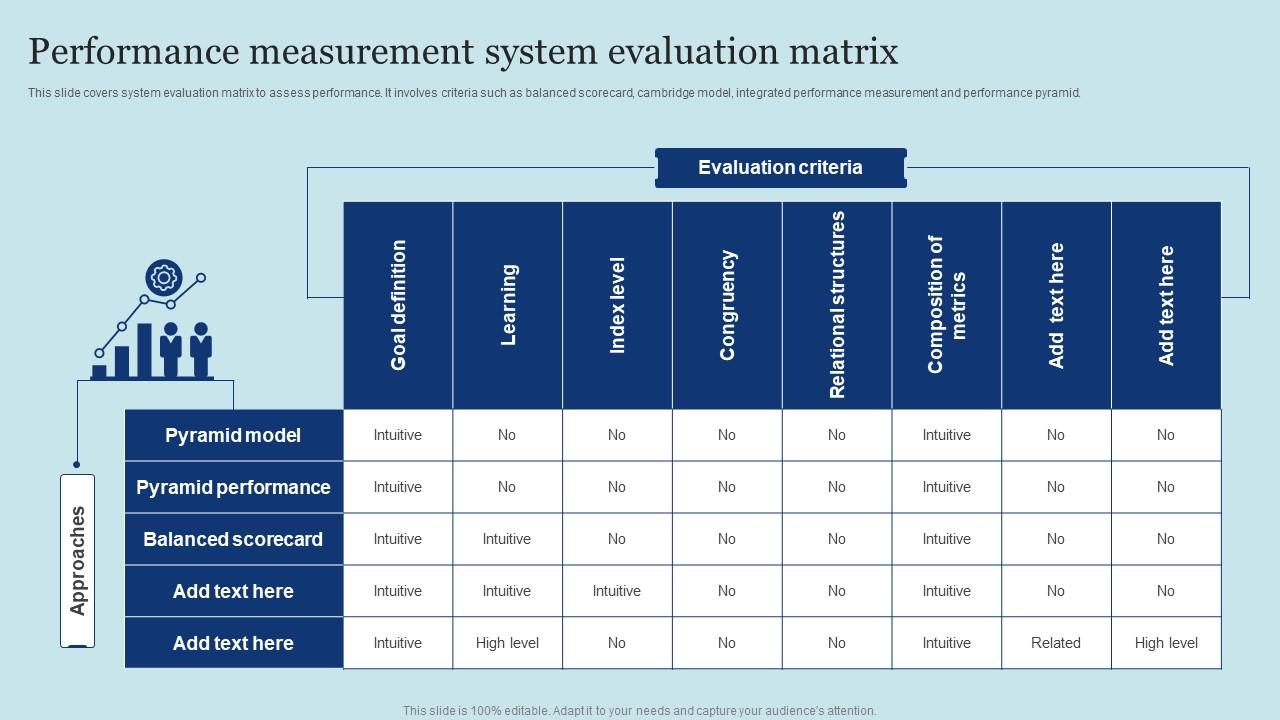
This slide covers system evaluation matrix to assess performance. It involves criteria such as balanced scorecard, cambridge model, integrated performance measurement and performance pyramid.
People who downloaded this PowerPoint presentation also viewed the following :
Performance Measurement System Evaluation Matrix with all 6 slides:
Use our Performance Measurement System Evaluation Matrix to effectively help you save your valuable time. They are readymade to fit into any presentation structure.
FAQs for Performance Measurement
Most companies track the basics - revenue growth, profit margins, customer satisfaction, employee turnover. Pretty standard stuff. Then it gets industry-specific: conversion rates for online stores, patient readmission rates in hospitals, utilization rates in manufacturing. Customer acquisition cost is everywhere now (seriously, everyone's obsessed). ROI and operational efficiency metrics show up constantly too. Honestly, the real trick? Pick maybe 3-5 KPIs that actually matter for your business. I've seen too many companies drown in spreadsheets tracking every possible metric when they should focus on what moves the needle.
Honestly, most people overthink this stuff. Pick 2-3 metrics per goal that actually move your business forward - not those flashy vanity numbers that make pretty dashboards. I learned this the hard way when we were tracking website visits like crazy but sales stayed flat. Weird flex, right? Break those metrics down so every department knows what they're responsible for. Short, punchy targets work better than complex formulas. Set up monthly check-ins to see what's working and pivot when something isn't. The whole thing falls apart if your metrics don't connect to your real strategy goals.
Honestly, tech completely changes the game for tracking performance data. You can ditch those awful spreadsheet marathons and get automated dashboards that pull everything in real-time. Analytics tools catch patterns you'd miss - I'm talking trends that would take forever to spot manually. AI even flags problems before they blow up, which is pretty wild. The alerts thing is clutch too since you only get pinged about stuff that matters to your job. I'd start with whatever manual tasks are driving you crazy right now. Those are your best bets for automation.
Honestly, numbers only tell you half the story. Your turnover rate might be 15%, but that doesn't explain *why* people are bailing. Exit interviews and employee feedback give you the real reasons - maybe it's your manager, maybe the workload's insane, who knows? It's like checking a thermometer vs actually asking someone if they're cold. Those stories and details show whether your good performance will stick around or if you just got lucky this quarter. Collect both types of data regularly so you're not making decisions blind. Numbers are great, but context is everything.
Honestly, the hardest part is figuring out which metrics actually matter vs just measuring whatever's easy to track. Data quality will bite you in the ass if you're not careful - bad data makes everything useless. Getting departments to agree on anything is a nightmare too, everyone has their own definitions of "success." Oh and don't even get me started on the tech side. You need systems that won't completely drain your budget or require a PhD to operate. My take? Pick maybe 3-5 really important metrics first. Get those dialed in properly, then worry about expanding later. Way better than trying to measure everything at once and failing miserably.
Honestly? Check them quarterly if you can manage it. I know that sounds like a lot, but things change so damn fast these days. Annual reviews just aren't cutting it anymore - you'll miss too much stuff that shifts throughout the year. Your metrics might end up totally off-base or even working against you. Schedule regular sit-downs with your team to figure out if you're still tracking the right things. Are your targets realistic? Do they match what's actually happening in your business? Trust me, staying on top of this quarterly will save you headaches later.
Honestly, get them involved from the start - let them help set their own goals instead of just dropping targets on them. Have them do self-assessments before reviews too. When people feel like actual partners in the process, it works way better. Ask them to help design how you'll measure performance since they usually know what's realistic for their job better than managers do anyway. I've seen this backfire when it gets too complicated though, so keep it simple. Make them co-creators rather than just sitting there receiving feedback. Next review cycle, start by asking what success looks like to them first.
So I'd go with the Balanced Scorecard first - covers financial stuff, customers, internal processes, and learning without making you obsess over just revenue numbers. OKRs are solid too if your team's into that quarterly goal thing. There's also Performance Prism which looks at all stakeholders, not just shareholders (kind of refreshing honestly). Really depends on your industry and how big you guys are though. My take? Pick one, get everyone on board first, then maybe add more later. Don't overthink it - I've seen companies get paralyzed trying to choose the "perfect" system.
Honestly, you gotta nail down specific, measurable stuff that everyone knows beforehand. Skip the wishy-washy "attitude" evaluations - focus on actual goals and behaviors instead. Same rubric for everyone in similar spots, obviously. Document everything (trust me on this one). Getting employees to help set their own goals works way better than you'd think. Those yearly reviews are pretty much dead anyway - do regular check-ins instead. The whole point is cutting out as much of the subjective BS as possible. Quick test: can you explain to any employee exactly how you're judging them and why? If not, there's your problem.
Keep your dashboards super focused on what each person actually needs to see. Put the main KPIs right at the top, then add supporting details below. Your charts need to tell a clear story - I like trend lines for showing progress and gauges when you're tracking against targets. Color coding helps but make it meaningful (red = problem, not just pretty). Executives hate clutter, so honestly less is way better. If you can't explain a chart in 30 seconds, it's too complicated. Oh and always add context like "vs last quarter" so people know if they should panic or celebrate.
Ugh, this is such a pain point honestly. What people consider "good work" is totally different depending where you are. Like in Japan, being a team player trumps individual star performance every time. Try doing those 360-degree feedback things in cultures where people won't give direct criticism - good luck with that! Time management expectations are different too. Some places are super hierarchical while others are flat. The goal-setting stuff that works in New York might completely bomb in Mumbai. You basically have to customize everything by region instead of using the same system everywhere, or your data will be completely useless.
Dude, real-time analytics is seriously a game changer - you get to see what's happening NOW instead of waiting for some monthly report to tell you about problems from three weeks ago. I mean, who has time for that? You can actually fix things as they're happening rather than playing catch-up constantly. The instant visibility lets you jump on opportunities right when they pop up. My advice? Don't try to track everything at first - that's overwhelming. Pick maybe 2-3 metrics that really matter and start there. Once you're used to having that immediate insight, you'll wonder how you ever managed without it.
Honestly, tracking the right stuff is a game-changer because it shows you what's actually moving the needle vs. what you *think* is working. You'll start seeing patterns you missed before - like why certain campaigns tank while others crush it. Then you can experiment with new ideas and actually measure if they're worth your time. My old boss used to say data beats gut feelings every time, and he wasn't wrong. Kill what's not working, double down on what is. Just make sure your team sits down regularly to dig into the numbers and brainstorm solutions together.
Dude, the worst thing companies do is track literally everything thinking it'll give them better insights. It doesn't. Half the stuff they measure is just vanity metrics that look cool in presentations but are basically useless for actual decisions. Oh, and they wait forever trying to get "perfect" data before measuring anything - I've watched that kill so many good projects. Look, decent data you can act on today beats flawless data six months from now. Pick maybe three metrics that actually connect to what makes you money, then add more later if you need them.
Honestly, you really need actual data to make good calls instead of just winging it or getting swayed by whoever talks loudest in meetings. Track the right stuff and you'll catch problems early - plus you'll see what's genuinely working vs what just seems like it is. Way better than making decisions in the dark, you know? Just don't fall into the trap of measuring pointless vanity metrics that look impressive on slides but don't mean anything. I'd say pick maybe 3-5 things that actually connect to what you're trying to achieve.
-
SlideTeam’s readymade presentations have landed my unique images with my bosses in the past and it continues to reward me.
-
They helped us design the pamphlets for our church’s food drive! The people loved the design, and I’m happy to say it was successful. Thank you, SlideTeam!