1114 globe and bar graph for data analysis image graphics for powerpoint
Our 1114 Globe And Bar Graph For Data Analysis Image Graphics For Powerpoint furnish the facts. They are authentic to the core.
Our 1114 Globe And Bar Graph For Data Analysis Image Graphics For Powerpoint furnish the facts. They are authentic to the c..
- Google Slides is a new FREE Presentation software from Google.
- All our content is 100% compatible with Google Slides.
- Just download our designs, and upload them to Google Slides and they will work automatically.
- Amaze your audience with SlideTeam and Google Slides.
-
Want Changes to This PPT Slide? Check out our Presentation Design Services
- WideScreen Aspect ratio is becoming a very popular format. When you download this product, the downloaded ZIP will contain this product in both standard and widescreen format.
-

- Some older products that we have may only be in standard format, but they can easily be converted to widescreen.
- To do this, please open the SlideTeam product in Powerpoint, and go to
- Design ( On the top bar) -> Page Setup -> and select "On-screen Show (16:9)” in the drop down for "Slides Sized for".
- The slide or theme will change to widescreen, and all graphics will adjust automatically. You can similarly convert our content to any other desired screen aspect ratio.
Compatible With Google Slides

Get This In WideScreen
You must be logged in to download this presentation.
PowerPoint presentation slides
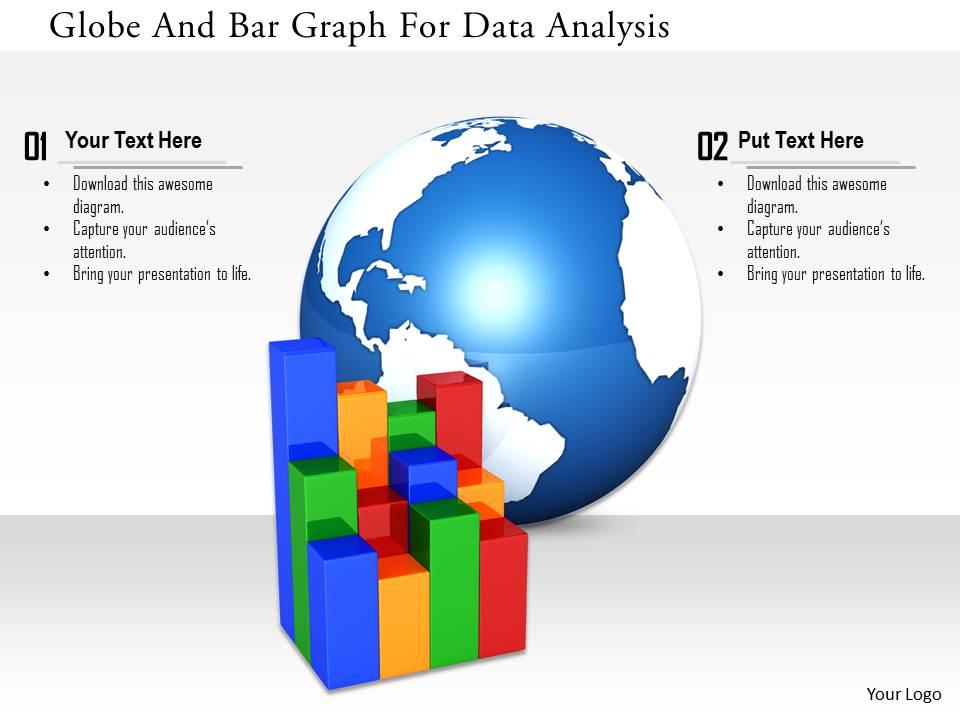
We are proud to present our 1114 globe and bar graph for data analysis image graphics for powerpoint. Graphic of globe and bar graph has been used to decorate this power point template. This PPT contains the concept of data analysis. Use this PPt for your global business and data related topics to get good remarks from your viewers.
People who downloaded this PowerPoint presentation also viewed the following :
1114 globe and bar graph for data analysis image graphics for powerpoint with all 3 slides:
Abide by your declaration with the help of our 1114 Globe And Bar Graph For Data Analysis Image Graphics For Powerpoint. Be able to fulfill all commitments.
-
Great quality product.
-
Colors used are bright and distinctive.


