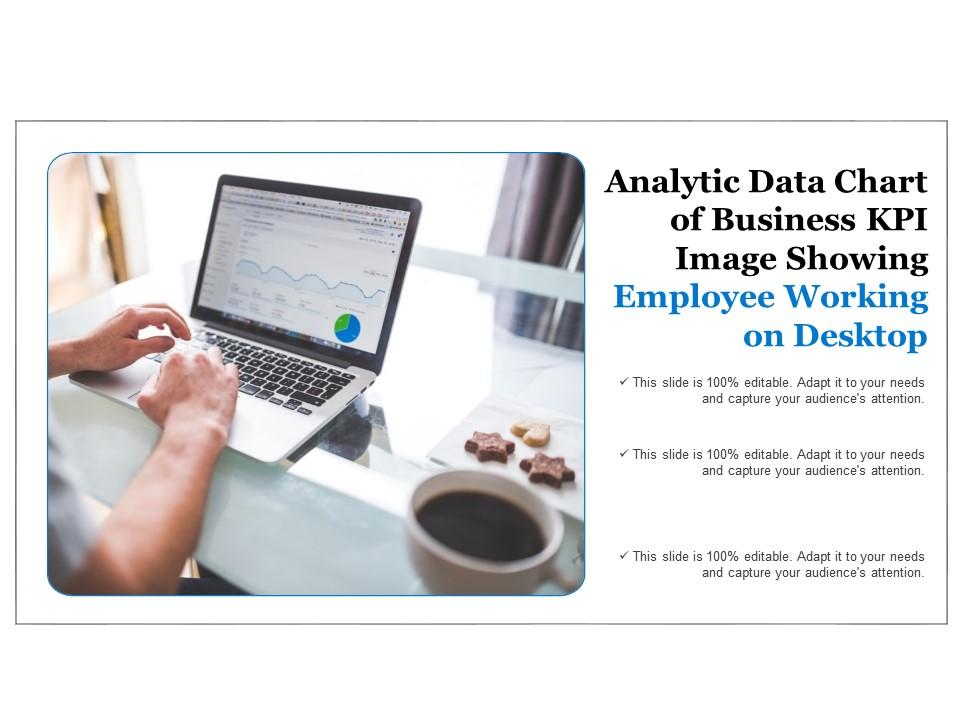
Analytic data chart of business kpi image showing employee working on desktop
Identify areas where errors can crop up with our Analytic Data Chart Of Business Kpi Image Showing Employee Working On Desktop. Figure out the chances of bungling.
You must be logged in to download this presentation.
PowerPoint presentation slides
Presenting this set of slides with name - Analytic Data Chart Of Business Kpi Image Showing Employee Working On Desktop. This is a three stage process. The stages in this process are Business Kpi, Business Dashboard, Business Metrics.
People who downloaded this PowerPoint presentation also viewed the following :
Analytic data chart of business kpi image showing employee working on desktop with all 6 slides:
Dwell on the geography with our Analytic Data Chart Of Business Kpi Image Showing Employee Working On Desktop. They accurately display the features.
-
Graphics are very appealing to eyes.
-
Illustrative design with editable content. Exceptional value for money. Highly pleased with the product.


