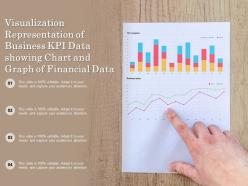
Visualization representation of business kpi data showing chart and graph of financial data
Convince affiliate groups with our Visualization Representation Of Business Kpi Data Showing Chart And Graph Of Financial Data. They will commit to giving you the desired backing.
You must be logged in to download this presentation.
PowerPoint presentation slides
Presenting this set of slides with name - Visualization Representation Of Business Kpi Data Showing Chart And Graph Of Financial Data. This is a four stage process. The stages in this process are Business Kpi, Business Dashboard, Business Metrics.
People who downloaded this PowerPoint presentation also viewed the following :
Visualization representation of business kpi data showing chart and graph of financial data with all 6 slides:
Extract the best from different customs with our Visualization Representation Of Business Kpi Data Showing Chart And Graph Of Financial Data. Benefit from cultural diversity.
-
I discovered this website through a google search, the services matched my needs perfectly and the pricing was very reasonable. I was thrilled with the product and the customer service. I will definitely use their slides again for my presentations and recommend them to other colleagues.
-
Enough space for editing and adding your own content.


