Cost Reduction Strategy PowerPoint Templates, Cost Saving PPT Slides
- Sub Categories
-
- 30 60 90 Day Plan
- About Us Company Details
- Action Plan
- Agenda
- Annual Report
- Audit Reports
- Balance Scorecard
- Brand Equity
- Business Case Study
- Business Communication Skills
- Business Plan Development
- Business Problem Solving
- Business Review
- Capital Budgeting
- Career Planning
- Change Management
- Color Palettes
- Communication Process
- Company Location
- Company Vision
- Compare
- Competitive Analysis
- Corporate Governance
- Cost Reduction Strategies
- Custom Business Slides
- Customer Service
- Dashboard
- Data Management
- Decision Making
- Digital Marketing Strategy
- Digital Transformation
- Disaster Management
- Diversity
- Equity Investment
- Financial Analysis
- Financial Services
- Financials
- Growth Hacking Strategy
- Human Resource Management
- Innovation Management
- Interview Process
- Knowledge Management
- Leadership
- Lean Manufacturing
- Legal Law Order
- Management
- Market Segmentation
- Marketing
- Media and Communication
- Meeting Planner
- Mergers and Acquisitions
- Metaverse
- Newspapers
- Operations and Logistics
- Organizational Structure
- Our Goals
- Performance Management
- Pitch Decks
- Pricing Strategies
- Process Management
- Product Development
- Product Launch Ideas
- Product Portfolio
- Project Management
- Purchasing Process
- Quality Assurance
- Quotes and Testimonials
- Real Estate
- Risk Management
- Sales Performance Plan
- Sales Review
- SEO
- Service Offering
- Six Sigma
- Social Media and Network
- Software Development
- Solution Architecture
- Stock Portfolio
- Strategic Management
- Strategic Planning
- Supply Chain Management
- Swimlanes
- System Architecture
- Team Introduction
- Testing and Validation
- Thanks-FAQ
- Time Management
- Timelines Roadmaps
- Value Chain Analysis
- Value Stream Mapping
- Workplace Ethic
-
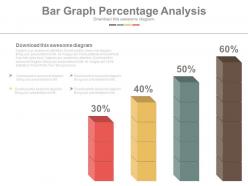 Four staged bar graph percentage analysis powerpoint slides
Presenting four staged bar graph percentage analysis powerpoint slides. This Power Point template diagram has been crafted with graphic of four staged bar graph and percentage diagram. This PPT diagram contains the concept of business result analysis. Use this PPT diagram for business and finance related presentations.
-
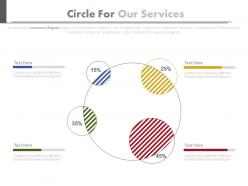 Four staged circle for our services powerpoint slides
Presenting four staged circle for our services powerpoint slides. This Power Point template diagram has been crafted with graphic of four staged circle diagram. This PPT diagram contains the concept of business services representation. Use this PPT diagram for business and finance related presentations.
-
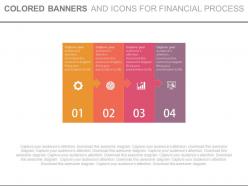 Four colored banners and icons for financial process powerpoint slides
Presenting four colored banners and icons for financial process powerpoint slides. This Power Point template diagram slide has been crafted with graphic of four colored banners and icons diagram. This PPT diagram contains the concept of financial process flow representation. Use this PPT diagram for business and marketing related presentations.
-
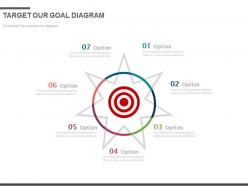 Seven staged target our goal diagram powerpoint slides
Presenting seven staged target our goal diagram powerpoint slides. This Power Point template diagram slide has been crafted with graphic of seven staged our goal diagram. This PPT diagram contains the concept of business goal achievement. Use this PPT diagram for business and finance related presentations.
-
 Six staged cubes and icons diagram powerpoint slides
Presenting six staged cubes and icons diagram powerpoint slides. This Power Point template diagram slide has been crafted with graphic of six staged cubes and icons diagram. This PPT diagram contains the concept of business data representation. Use this PPT diagram for business and finance related presentations.
-
 Three circles with business icons infographics powerpoint slides
Presenting three circles with business icons infographics powerpoint slides. This Power Point template diagram slide has been crafted with graphic of three circles and icons diagram. This PPT diagram contains the concept of business information representation. Use this PPT diagram for business and finance related presentations.
-
 Six staged year based timeline for business target powerpoint slides
Presenting six staged year based timeline for business target powerpoint slides. This power point template diagram has been crafted with graphic of six staged year based timeline diagram. This PPT icon slide contains the concept of business target analysis representation. Use this PPT diagram for business and finance related presentations.
-
 Year based tags timeline for success powerpoint slides
Presenting year based tags timeline for success powerpoint slides. This power point template diagram has been crafted with graphic of year based tags timeline diagram. This PPT icon slide contains the concept of business success representation. Use this PPT diagram for business and finance related presentations.
-
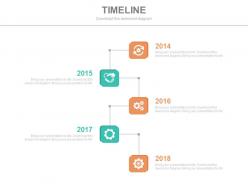 Vertical timeline for business process control powerpoint slides
Completely editable PowerPoint slide for vertical timeline for business process control. Professional use of colors, icons and design. Presentation design can be displayed in standard and widescreen view. PPT template is fully editable to allow customization. Simple to download and convert into PDF format. Compatible with number of software options. Personalize the presentation with individual company name and logo. Excellence in picture quality. Beneficial for investors, shareholders, financiers, professors, students, marketers, sales people, etc.
-
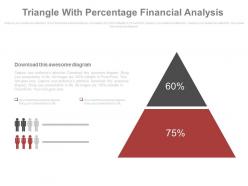 Triangle with percentage financial analysis powerpoint slides
Presenting triangle with percentage financial analysis powerpoint slides. This Power Point template diagram with graphic of triangle and percentage diagram. This PPT diagram contains the concept of financial analysis. Use this PPT diagram for business and finance related presentations.
-
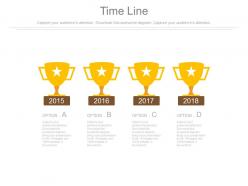 Trophies and years for success timeline diagram powerpoint slides
Quick and simple to download at your convenience. Fully modifiable text as per your requirement. Original resolution of images and diagrams unchanged post editing. Totally editable colors, contrast, orientation and sizes of PPT icons. Insert your own company logo, tagline, trademark, brand name etc. to personalize. Fits seamlessly anywhere between your slides.
-
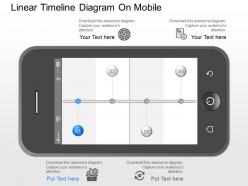 Mi linear timeline diagram on mobile powerpoint template
Plentiful color choices, briskness and effects. Delete or add the slide as and when required. Smooth animations, transitions and movement of objects across the slide. PPT slide can turn out to be very useful for business growth, marketing figures. Improvement, focus on acquisition and mergers in long run. Works well in Windows 7, 8, 10, XP, Vista and Citrix.
-
 Business plan canvas updated cost reduction ppt sample
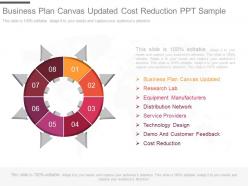
Presenting business plan canvas updated cost reduction ppt sample. This is a business plan canvas updated cost reduction ppt sample. This is a eight stage process. The stages in this process are business plan canvas updated, research lab, equipment manufacturers, distribution network, service providers, technology design, demo and customer feedback, cost reduction.
-
 Quality control processes ppt examples professional
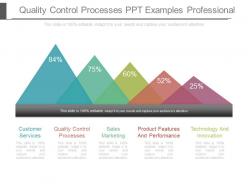
Presenting quality control processes ppt examples professional. This is a quality control processes ppt examples professional. This is a five stage process. The stages in this process are customer services, quality control processes, sales marketing, product features and performance, technology and innovation.
-
 Customer satisfaction powerpoint slides presentation tips
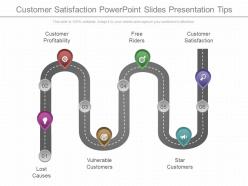
Presenting customer satisfaction powerpoint slides presentation tips. This is a customer satisfaction powerpoint slides presentation tips. This is a six stage process. The stages in this process are customer profitability, free riders, customer satisfaction, lost causes, vulnerable customers, star customers.
-
 Product portfolio timeline design sample of ppt
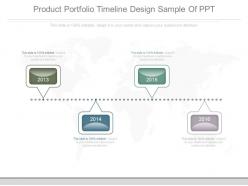
Presenting product portfolio timeline design sample of ppt. This is a product portfolio timeline design sample of ppt. This is a four stage process. The stages in this process are years, planning, roadmap, business, management.
-
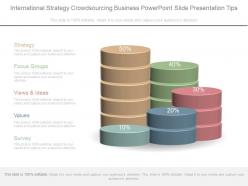 International strategy crowd sourcing business powerpoint slide presentation tips
Presenting international strategy crowd sourcing business powerpoint slide presentation tips. This is a international strategy crowd sourcing business powerpoint slide presentation tips. This is a five stage process. The stages in this process are strategy, focus groups, views and ideas, values, survey.
-
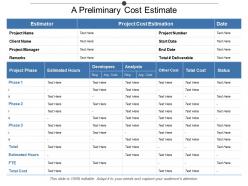 A preliminary cost estimate
Presenting this set of slides with name - A Preliminary Cost Estimate. This is a two stage process. The stages in this process are Cost Estimate, Price Estimate, Value Estimate.
-
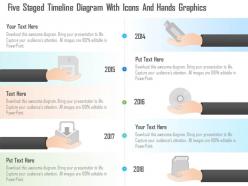 0115 five staged timeline diagram with icons and hands graphics powerpoint template
We are proud to present our 0115 five staged timeline diagram with icons and hands graphics powerpoint template. Five staged timeline diagram with hand icons has been used to develop this power point template. This diagram template depicts the concept of business data representation. Use this PPT for your business and sales related presentations.
-
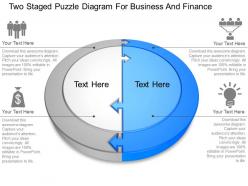 Two staged puzzle diagram for business and finance powerpoint template slide
We are proud to present our two staged puzzle diagram for business and finance powerpoint template slide. Graphic of two staged puzzle diagram has been used to design this power point template diagram. This PPT diagram contains the concept of business and finance problem solving. Use this PPT diagram for business and finance presentations.
-
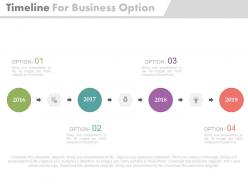 Four staged linear timeline for business options powerpoint slides
Presenting four staged linear timeline for business options powerpoint slides. This Power Point template slide has been crafted with graphic of four staged linear timeline with years icons. This PPT slide contains the concept of business options representation. Use this PPT slide for business and finance related presentations.
-
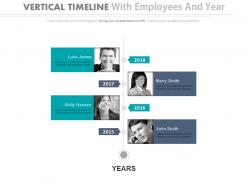 Four staged vertical timeline with employees and years powerpoint slides
No preoccupation of pixels when opened on extra large screen. Permitted gathering or ungrouping of the articles. Access to alter the shading, style, topics and the introduction of the slide symbols. Neighborly with the Google slides and major PowerPoint variants. Inconvenience free addition of trademark in the slides. Advantageous for the advertising experts, entrepreneurs and the Professional moderators.
-
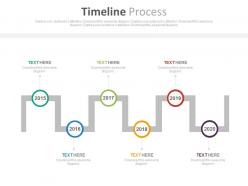 Sequential timeline with years for target management powerpoint slides
Presenting sequential timeline with years for target management powerpoint slides. This Power Point template slide has been crafted with graphic of sequential timeline with years icons. This PPT slide contains the concept of business target management representation. Use this PPT slide for business and finance related presentations.
-
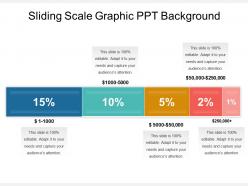 Sliding scale graphic ppt background
Presenting sliding scale graphic ppt background. This is a sliding scale graphic ppt background. This is a five stage process. The stages in this process are sliding scale, sliding bar.
-
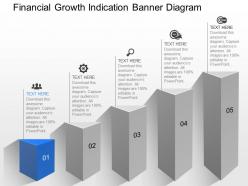 A financial growth indication banner diagram powerpoint template
Presenting a financial growth indication banner diagram powerpoint template. This Power Point template diagram has been crafted with graphic of banner diagram. This PPT diagram contains the concept of financial growth indication. Use this PPT diagram for finance and marketing related presentations.
-
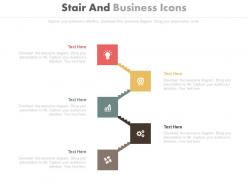 Five staged stair and business icons diagram powerpoint slides
Presenting five staged stair and business icons diagram powerpoint slides. This Power Point template diagram slide has been crafted with graphic of five staged stair and icons diagram. This PPT diagram contains the concept of business success representation. Use this PPT diagram for business and marketing related presentations.
-
 Timeline for year 2017 for business powerpoint slides
Presenting timeline for year 2017 for business powerpoint slides. This power point template diagram has been crafted with graphic of timeline for year 2017 diagram. This PPT icon slide contains the concept of business success parameters representation. Use this PPT diagram for business and finance related presentations.
-
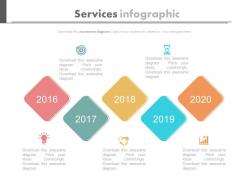 Five staged vendor service management year based chart powerpoint slides
Presentation layout is beneficial to service providers, managers, project in charge, financial sector and businessmen to regulate operations. Color, style and position can be standardized, supports font size which can be read from a distance. PPT slide is compatible with Microsoft 2010 and 2013 versions. Text and graphics can be placed on the slide. PPT diagram 100% compatible with Google slide.
-
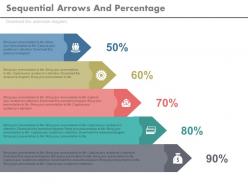 Five staged sequential arrows and percentage powerpoint slides
Presenting five staged sequential arrows and percentage powerpoint slides. This Power Point template slide has been crafted with graphic of five staged arrow and percentage chart. This PPT slide contains the concept of financial growth analysis. Use this PPT slide for business and finance related presentations.
-
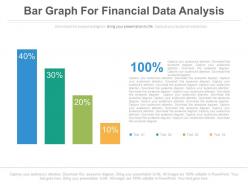 Bar graph for financial data analysis powerpoint slides
Presenting bar graph for financial data analysis powerpoint slides. This Power Point template diagram with graphic of bar graph and finance icons. This PPT diagram contains the concept of financial data analysis. Use this PPT diagram for business and finance related presentations.
-
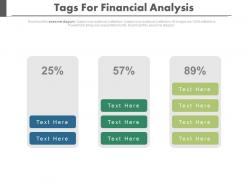 Three staged tags for financial analysis diagram powerpoint slides
Presenting three staged tags for financial analysis diagram powerpoint slides. This Power Point template diagram with graphic of three staged tags diagram. This PPT diagram contains the concept of financial analysis. Use this PPT diagram for business and finance related presentations.
-
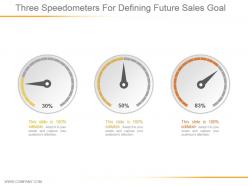 Three speedometers for defining future sales goal ppt slide examples
Presenting three speedometers for defining future sales goal ppt slide examples. This is a three speedometers for defining future sales goal ppt slide examples. This is a three stage process. The stages in this process are business, marketing, planning, presentation, technology.
-
 Mj graphic of sign board diagram powerpoint template
Presenting mj graphic of sign board diagram powerpoint template. This Power Point template diagram has been crafted with graphic of sign board diagram. This PPT diagram contains the concept of information representation. Use this PPT diagram for business and marketing related presentations.
-
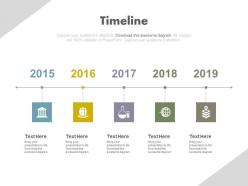 Five staged timeline year based analysis powerpoint slides
Presenting five staged timeline year based analysis powerpoint slides. This Power Point template slide has been designed with graphic of five staged timeline and year diagram. This PPT diagram contains the concept of timeline formation representation .Use this PPT slide for business and finance related presentations.
-
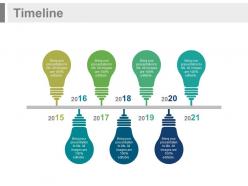 Linear timeline with bulb design and years powerpoint slides
Presenting linear timeline with bulb design and years powerpoint slides. This Power Point template slide has been designed with graphic of linear timeline and bulb diagram. This PPT diagram contains the concept of idea generation and success milestones representation .Use this PPT slide for business and marketing related presentations.
-
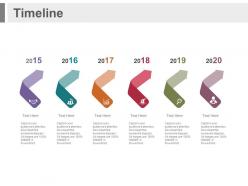 Six staged arrows year based timeline powerpoint slides
Presenting six staged arrows year based timeline powerpoint slides. This Power Point template slide has been designed with graphic of six staged arrow and year based timeline diagrams. This PPT diagram contains the concept of year based business success analysis .Use this PPT slide for business and marketing related topics.
-
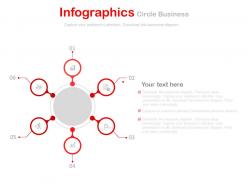 Six staged infographics and icons powerpoint slides
Presenting six staged infographics and icons powerpoint slides. This Power Point template diagram has been crafted with graphic of six staged info graphics and icons diagram. This PPT diagram contains the concept of business data and info representation. Use this PPT diagram for business and finance related presentations.
-
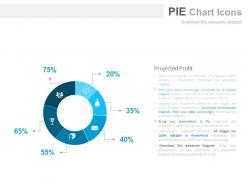 Six staged pie chart with icons for business data powerpoint slides
Presenting six staged pie chart with icons for business data powerpoint slides. This Power Point template diagram has been crafted with graphic of six staged pie chart and percentage diagram. This PPT diagram contains the concept of business data analysis. Use this PPT diagram for business and finance related presentations.
-
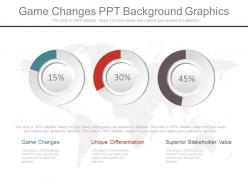 Game changes ppt background graphics
Presenting game changes ppt background graphics. This is a game changes ppt background graphics. This is a three stage process. The stages in this process are game changes, unique differentiation, superior stakeholder value.
-
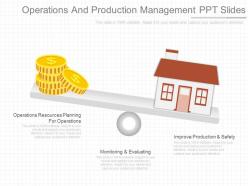 Operations and production management ppt slides
Presenting operations and production management ppt slides. This is a operations and production management ppt slides. This is a two stage process. The stages in this process are operations resources planning for operations, monitoring and evaluating, improve production and safety.
-
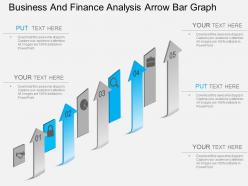 Ei business and finance analysis arrow bar graph powerpoint template
Utilization of cutting edge determination of pictures and the symbols in the slides. Permit altering of the size, style and introduction of the slide symbols. Inconvenience free inclusion of the organization's name or watermark. If guidelines to alter and change the slide symbol outline. Flexible with multiple format options like JPEG, JPG or PDF. Accessible an assortment of symbols to download and supplant in the slides. Valuable for the expert moderators and the business chiefs, financiers, businessmen, entrepreneurs, investors, and funding companies.
-
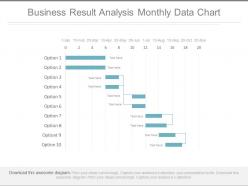 Business result analysis monthly data chart powerpoint slides
Presenting business result analysis monthly data chart powerpoint slides. This is a business result analysis monthly data chart powerpoint slides. This is a ten stage process. The stages in this process are financials.
-
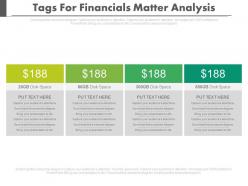 Four tags for financial matter analysis powerpoint slides
Presenting four tags for financial matter analysis powerpoint slides. This is a four tags for financial matter analysis powerpoint slides. This is a four stage process. The stages in this process are financials.
-
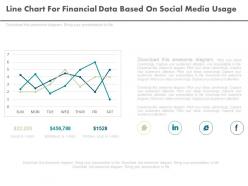 Line chart for financial data based on social media usage powerpoint slides
Presenting line chart for financial data based on social media usage powerpoint slides. This is a line chart for financial data based on social media usage powerpoint slides. This is a three stage process. The stages in this process are financials.
-
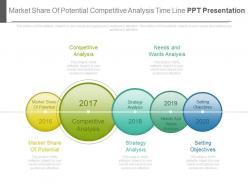 Market share of potential competitive analysis timeline ppt presentation
Presenting market share of potential competitive analysis timeline ppt presentation. This is a market share of potential competitive analysis timeline ppt presentation. This is a five stage process. The stages in this process are timeline.
-
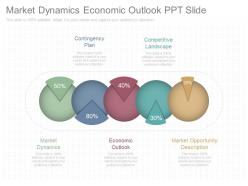 Market dynamics economic outlook ppt slide
Presenting market dynamics economic outlook ppt slide. This is a market dynamics economic outlook ppt slide. This is a five stage process. The stages in this process are contingency plan, competitive landscape, market opportunity description, economic outlook, market dynamics.
-
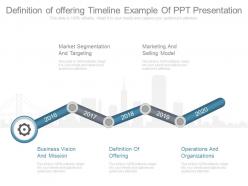 Definition of offering timeline example of ppt presentation
Presenting definition of offering timeline example of ppt presentation. This is a definition of offering timeline example of ppt presentation. This is a five stage process. The stages in this process are market segmentation and targeting, marketing and selling model, operations and organizations, definition of offering, business vision and mission.
-
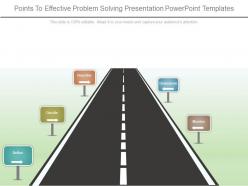 Points to effective problem solving presentation powerpoint templates
Presenting points to effective problem solving presentation powerpoint templates. This is a points to effective problem solving presentation powerpoint templates. This is a five stage process. The stages in this process are define, decide, describe, monitor, brainstorm.
-
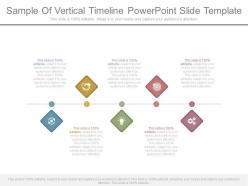 Sample of vertical timeline powerpoint slide template
Presenting sample of vertical timeline powerpoint slide template. This is a sample of vertical timeline powerpoint slide template. This is a five stage process. The stages in this process are business, planning, development, marketing, timeline, icon.
-
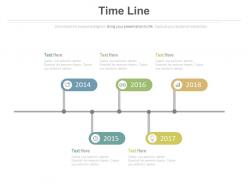 Five staged sequential timeline for sales powerpoint slides
Presenting five staged sequential timeline for sales powerpoint slides. This Power Point icon template slide has been crafted with graphic of five staged sequential timeline icons. This icon template slide contains the concept of finance target analysis and timeline formation. Use this icon template slide can be used for business and finance related presentations.
-
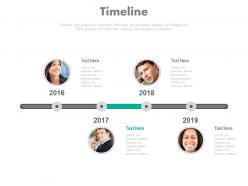 Linear timeline with business peoples and years powerpoint slides
Presenting linear timeline with business peoples and years powerpoint slides. This Power Point icon template slide has been crafted with graphic of linear timeline and business people?s diagram. This icon template slide contains the concept of timeline formation for employee management .Use this icon template slide can be used for business and finance related presentations.
-
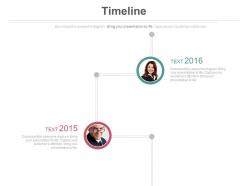 Two staged sequential timeline diagram powerpoint slides
Professionally designed Presentation design. Fully compatible PPT slides with Google slides. Presentable PowerPoint design in standard 4:3 and widescreen 16:9 view. Flexible option to modify the presentation template as per the industry requirement. Fast download saves valuable time. Slide can be converted into JPG and PDF format. Benefitted for small and large scale businesses.
-
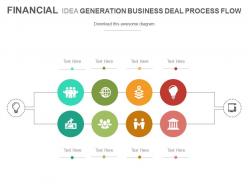 Financial idea generation business deal process flow powerpoint slides
Presenting financial idea generation business deal process flow powerpoint slides. This Power Point template slide has been crafted with graphic of finance info graphics. This PPT slide contains the concept of financial idea generation and business deal analysis. Use this PPT slide for business and finance related presentations.
-
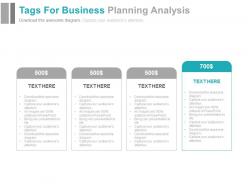 Four tags for business planning analysis powerpoint slides
Presenting four tags for business planning analysis powerpoint slides. This Power Point template slide has been crafted with graphic of four tags. This PPT slide contains the concept of business planning analysis. Use this PPT slide for business and finance related presentations.
-
 Saving piggy mobile dollars financial planning powerpoint slides
Presenting saving piggy mobile dollars financial planning powerpoint slides. This Power Point template slide has been crafted with graphic of piggy bank, dollars and mobile icons. This PPT slide contains the concept of financial planning. Use this PPT slide for business and finance related presentations.
-
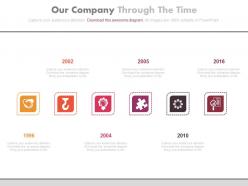 Our company timeline with business icons powerpoint slides
Swift and simple to download. Absolutely editable icons and PPT infographics-remove or keep to your liking. Original resolution of PPT images and diagrams undiminished post editing. Absolutely editable text to suit the context of your presentation. Totally editable colors, contrast, orientation and sizes of PPT icons. Insert your own company logo, tagline, trademark etc.
-
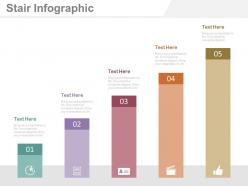 Five staged bar graph for financial management analysis powerpoint slides
Presenting five staged bar graph for financial management analysis powerpoint slides. This Power Point template diagram with graphic of five staged bar graph and icons. This PPT diagram contains the concept of financial management analysis. Use this PPT diagram for business and finance related presentations.
-
 Three social networks google plus viber and linkdin powerpoint slides
Presenting three social networks google plus viber and linkdin powerpoint slides. This Power Point template diagram with graphic of three social networks. This PPT diagram contains the concept of social networking for google,viber and LinkedIn. Use this PPT diagram for business and finance related presentations.
-
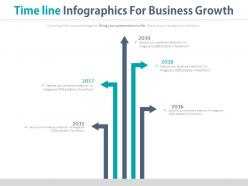 Five staged timeline infographics for business growth powerpoint slides
Presenting five staged timeline infographics for business growth powerpoint slides. This Power Point template slide has been crafted with graphic of five staged timeline info graphics diagram. This PPT slide contains the concept of business growth analysis. Use this PPT diagram for business and marketing related presentations.
-
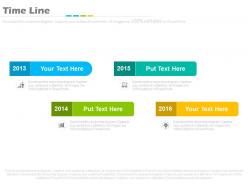 Four staged business annual report with years powerpoint slides
Presenting four staged business annual report with years powerpoint slides. This Power Point template slide has been crafted with graphic of four staged annual report diagram. This PPT slide contains the concept of business report analysis. Use this PPT diagram for business and marketing related presentations.


