Cost Reduction Strategy PowerPoint Templates, Cost Saving PPT Slides
- Sub Categories
-
- 30 60 90 Day Plan
- About Us Company Details
- Action Plan
- Agenda
- Annual Report
- Audit Reports
- Balance Scorecard
- Brand Equity
- Business Case Study
- Business Communication Skills
- Business Plan Development
- Business Problem Solving
- Business Review
- Capital Budgeting
- Career Planning
- Change Management
- Color Palettes
- Communication Process
- Company Location
- Company Vision
- Compare
- Competitive Analysis
- Corporate Governance
- Cost Reduction Strategies
- Custom Business Slides
- Customer Service
- Dashboard
- Data Management
- Decision Making
- Digital Marketing Strategy
- Digital Transformation
- Disaster Management
- Diversity
- Equity Investment
- Financial Analysis
- Financial Services
- Financials
- Growth Hacking Strategy
- Human Resource Management
- Innovation Management
- Interview Process
- Knowledge Management
- Leadership
- Lean Manufacturing
- Legal Law Order
- Management
- Market Segmentation
- Marketing
- Media and Communication
- Meeting Planner
- Mergers and Acquisitions
- Metaverse
- Newspapers
- Operations and Logistics
- Organizational Structure
- Our Goals
- Performance Management
- Pitch Decks
- Pricing Strategies
- Process Management
- Product Development
- Product Launch Ideas
- Product Portfolio
- Project Management
- Purchasing Process
- Quality Assurance
- Quotes and Testimonials
- Real Estate
- Risk Management
- Sales Performance Plan
- Sales Review
- SEO
- Service Offering
- Six Sigma
- Social Media and Network
- Software Development
- Solution Architecture
- Stock Portfolio
- Strategic Management
- Strategic Planning
- Supply Chain Management
- Swimlanes
- System Architecture
- Team Introduction
- Testing and Validation
- Thanks-FAQ
- Time Management
- Timelines Roadmaps
- Value Chain Analysis
- Value Stream Mapping
- Workplace Ethic
-
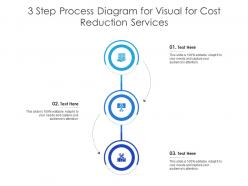 3 step process diagram for visual for cost reduction services infographic template
This is a single slide titled 3 Step Process Diagram For Visual For Cost Reduction Services Infographic Template. It is crafted using high quality vector based visuals that are 100 percent editable and available for immediate download in standard and widescreen aspect ratios.
-
 0414 3d background graphics for financial analysis
100% alterable content, shades, images, hue etc. of PowerPoint images, Adequate space provided to insert text, titles and subtitles, Simply click to add logo, trademark or name, Flexibility to convert into various file configuration like PDF or JPG, Ready to use or instant downloading options available hence saves time, Runs efficiently with other software’s, well versed with all Google slides, high quality PPT graphics which are quite effective when projected on larger screen.
-
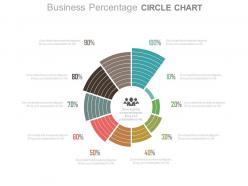 Ten staged business percentage circle chart powerpoint slides
Presenting ten staged business percentage circle chart powerpoint slides. This Power Point template diagram slide has been crafted with graphic of ten staged circle chart diagram. This PPT diagram contains the concept of business data analysis. Use this PPT diagram for business and finance related presentations.
-
 Eb 3d man searching growth on bar graph powerpoint template
Presenting eb 3d man searching growth on bar graph powerpoint template. This Power Point template diagram has been crafted with graphic of 3d man and bar graph. This PPT diagram contains the concept of growth. Use this PPT diagram for business and marketing related presentations.
-
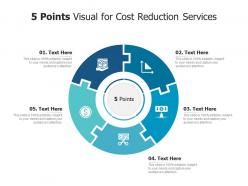 5 points visual for cost reduction services infographic template
This is our 5 Points Visual For Cost Reduction Services Infographic Template designed in PowerPoint, however, you can also access it in Google Slides. It comes in two aspect ratios standard and widescreen, with fully editable visual content.
-
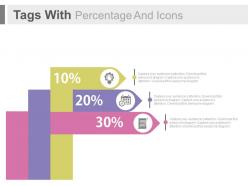 Three tags with percentage and icons powerpoint slides
Presenting three tags with percentage and icons powerpoint slides. This Power Point template slide has been crafted with graphic of three tags and percentage diagram. This PPT slide contains the concept of financial data analysis. Use this PPT slide for business and finance related presentations.
-
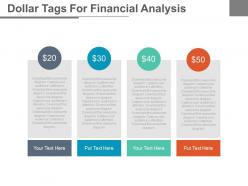 Four dollar tags for financial analysis powerpoint slides
Presenting four dollar tags for financial analysis powerpoint slides. This Power Point template diagram with graphic of four dollar tags. This PPT diagram contains the concept of financial analysis. Use this PPT diagram for business and finance related presentations.
-
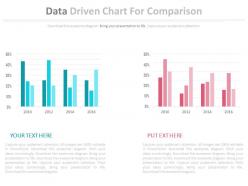 Two data driven chart for comparison powerpoint slides
Presenting two data driven chart for comparison powerpoint slides. This Power Point template diagram with graphic of two data driven chart diagram. This PPT diagram contains the concept of data comparison analysis. Use this PPT diagram for business and finance related presentations.
-
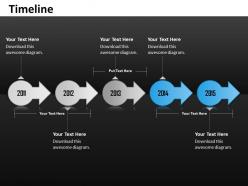 Linear unique timeline roadmap diagram 0314
User friendly and high resolution PPT templates. Total freedom to any sort of editing. Easy conversion into PDF/ JPG format. Fit into widescreen. Effortless insertion of company logo. Quick download. Compatible with Google slides. Beneficial for individuals from diverse companies, marketing, business, sales, strategy etc..
-
 Funnel design chart with icons powerpoint slides
Presenting funnel design chart with icons powerpoint slides. This Power Point template slide has been crafted with graphic of funnel design chart and icons. This PPT slide contains the concept of result analysis. Use this PPT slide for business and finance related presentations.
-
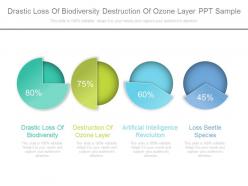 Drastic loss of biodiversity destruction of ozone layer ppt sample
Presenting drastic loss of biodiversity destruction of ozone layer ppt sample. This is a drastic loss of biodiversity destruction of ozone layer ppt sample. This is a four stage process. The stages in this process are drastic loss of biodiversity, destruction of ozone layer, artificial intelligence revolution, loss beetle species.
-
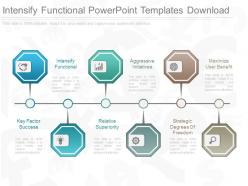 Pptx intensify functional powerpoint templates download
Presenting pptx intensify functional powerpoint templates download. This is a intensify functional powerpoint templates download. This is a six stage process. The stages in this process are intensify functional, aggressive initiatives, maximize user benefit, strategic degrees of freedom, relative superiority, key factor success.
-
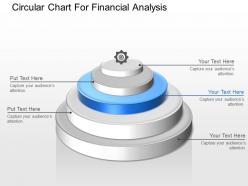 Circular chart for financial analysis powerpoint template slide
We are proud to present our circular chart for financial analysis powerpoint template slide. This power point template diagram has been crafted with graphic of circular chart. This PPT diagram contains the concept of financial analysis. Use this PPT diagram for business and finance related presentations.
-
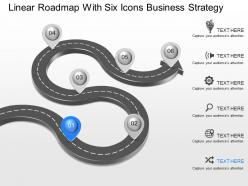 Gf linear roadmap with six icons business strategy powerpoint template
Presenting gf linear roadmap with six icons business strategy powerpoint template. This Power Point template diagram has been crafted with graphic of linear roadmap and six icons diagram. This PPT diagram contains the concept of business strategy representation. Use this PPT diagram in your presentation and get good remarks.
-
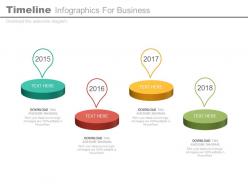 Year based timeline infographics for business powerpoint slides
Presenting year based timeline infographics for business powerpoint slides. This Power Point template slide has been crafted with graphic of year based timeline info graphics. This PPT slide contains the concept of business target timeline formation. Use this PPT slide for business and finance related presentations.
-
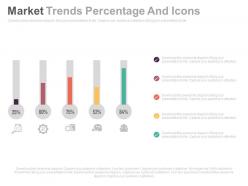 Five staged market trends percentage and icons powerpoint slides
Presenting five staged market trends percentage and icons powerpoint slides. This Power Point template slide has been crafted with graphic of five staged percentage and icons. This PPT slide contains the concept of financial growth analysis. Use this PPT slide for business and finance related presentations.
-
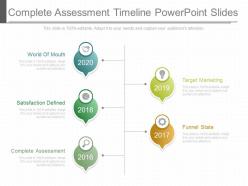 Complete assessment timeline powerpoint slides
Presenting complete assessment timeline powerpoint slides. This is a complete assessment timeline powerpoint slides. This is a five stage process. The stages in this process are world of mouth, target marketing, funnel state, complete assessment, satisfaction defined.
-
 Three truck tags timeline and percentage powerpoint slides
Presenting three truck tags timeline and percentage powerpoint slides. This Power Point template slide has been crafted with graphic of three truck tags and timeline diagram. This PPT slide contains the concept of business success timeline representation. Use this PPT diagram for business and marketing related presentations.
-
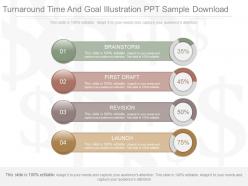 Pptx turnaround time and goal illustration ppt sample download
Presenting pptx turnaround time and goal illustration ppt sample download. This is a turnaround time and goal illustration ppt sample download. This is a four stage process. The stages in this process are brainstorm, first draft, revision, launch.
-
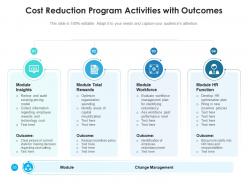 Cost reduction program activities with outcomes
Introducing our premium set of slides with Cost Reduction Program Activities With Outcomes. Ellicudate the four stages and present information using this PPT slide. This is a completely adaptable PowerPoint template design that can be used to interpret topics like Module Insights, Module Total Rewards, Module Workforce, Module Hr Function. So download instantly and tailor it with your information.
-
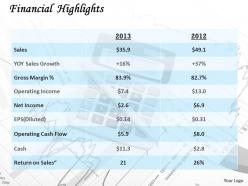 0314 financial sales growth chart
Presentation slide is beneficial for clients, managers, project in charge, financial sector and business conferences. Color, style and position can be standardized, supports font size which can be read from a distance. PPT slide is compatible with Microsoft 2010 and 2013 versions. Text and graphics can be placed on the slide. PPT diagram 100% compatible with Google slide.
-
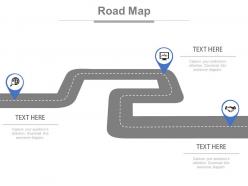 Three staged business roadmap diagram powerpoint slides
Presenting three staged business roadmap diagram powerpoint slides. This power point template diagram has been crafted with graphic of three staged business roadmap diagram. This PPT icon slide contains the concept of business success roadmap representation. Use this PPT diagram for business and finance related presentations.
-
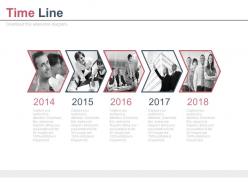 Year based photo arrow design timeline powerpoint slides
Presenting year based photo arrow design timeline powerpoint slides. This power point template diagram has been crafted with graphic of year based photo arrow design timeline diagram. This PPT icon slide contains the concept of business timeline representation. Use this PPT diagram for business and finance related presentations.
-
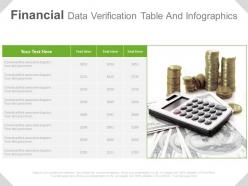 Financial data verification table and infographics powerpoint slides
Presenting financial data verification table and infographics powerpoint slides. This Power Point template slide has been crafted with graphic of data verification table and info graphics. This PPT slide contains the concept of financial data analysis. Use this PPT slide for business and finance related presentations.
-
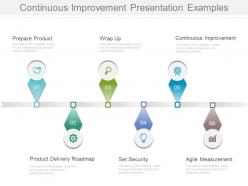 Continuous improvement presentation examples
Presenting continuous improvement presentation examples. This is a continuous improvement presentation examples. This is a six stage process. The stages in this process are prepare product, wrap up, continuous improvement, product delivery roadmap, set security, agile measurement.
-
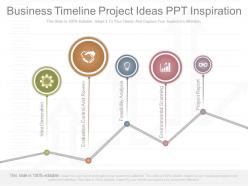 Business timeline project ideas ppt inspiration
Fine quality and high resolution PPT templates. 100 percent editable. Easy insertion of company logo/ trade name. Fit in widescreen. Select from a range of icons and graphics. Trouble free inclusion or exclusion of text. Compatible with Google slides. Beneficial for business planning, strategy management, entrepreneurs, realtors, students, professors.
-
 Preliminary project statement timeline example of ppt
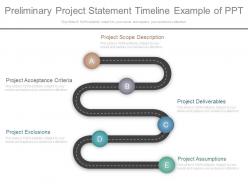
Presenting preliminary project statement timeline example of ppt. This is a preliminary project statement timeline example of ppt. This is a five stage process. The stages in this process are project scope description, project acceptance criteria, project deliverables, project exclusions, project assumptions.
-
 Golden trophy with years success achievement powerpoint slides
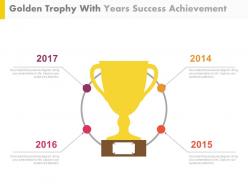
Presenting golden trophy with years success achievement powerpoint slides. This Power Point template slide has been crafted with graphic of golden trophy and years? timeline. This PPT slide contains the concept of business success achievement. Use this PPT slide for business and finance related presentations.
-
 Four staged funnel chart for process flow powerpoint slides
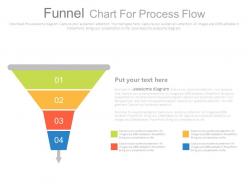
Presenting four staged funnel chart for process flow powerpoint slides. This Power Point template diagram has been crafted with graphic of four staged funnel chart diagram. This PPT diagram contains the concept of business process flow representation. Use this PPT diagram for business and finance related presentations.
-
 World map with linear year based timeline powerpoint slides
Presenting world map with linear year based timeline powerpoint slides. This Power Point template slide has been crafted with graphic of world map and timeline diagram. This PPT diagram contains the concept of business timeline formation. Use this PPT slide for business and management related presentations.
-
 Linear timeline with years for business meeting powerpoint slides
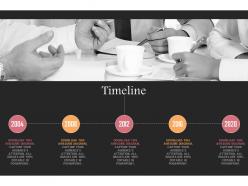
Presenting linear timeline with years for business meeting powerpoint slides. This Power Point template slide has been crafted with graphic of linear timeline with years icons. This PPT slide contains the concept of business meeting point?s representation. Use this PPT slide for business and finance related presentations.
-
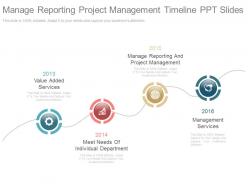 Manage reporting project management timeline ppt slides
Presenting manage reporting project management timeline ppt slides. This is a manage reporting project management timeline ppt slides. This is a four stage process. The stages in this process are value added services, manage reporting and project management, meet needs of individual department, management services.
-
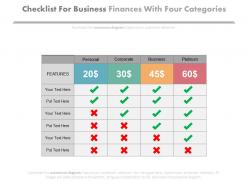 Checklist for business finances with four categories powerpoint slides
Presenting checklist for business finances with four categories powerpoint slides. This is a checklist for business finances with four categories powerpoint slides. This is a one stage process. The stages in this process are financials.
-
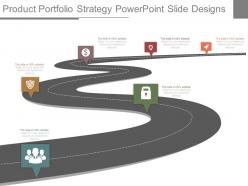 Product portfolio strategy powerpoint slide designs
Presenting product portfolio strategy powerpoint slide designs. This is a product portfolio strategy powerpoint slide designs. This is a six stage process. The stages in this process are roadmap, business, presentation, strategy, process.
-
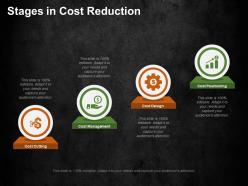 Stages in cost reduction ppt summary background images
Presenting this set of slides with name - Stages In Cost Reduction Ppt Summary Background Images. This is a four stage process. The stages in this process are Cost Cutting, Cost Management, Cost Design, Cost Positioning.
-
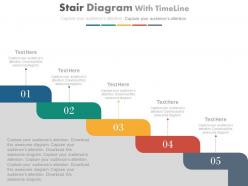 Five staged stair diagram with timeline powerpoint slides
Presenting five staged stair diagram with timeline powerpoint slides. This Power Point template diagram slide has been crafted with graphic of five staged stair and timeline diagram. This PPT diagram contains the concept of business target and success milestones representation. Use this PPT diagram for business and marketing related presentations.
-
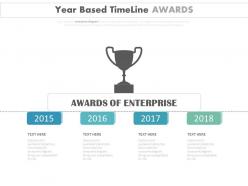 Year based timeline for award enterprise details powerpoint slides
Presenting year based timeline for award enterprise details powerpoint slides. This Power Point template slide has been crafted with graphic of year based timeline. This PPT slide contains the concept of business award enterprise details representation. Use this PPT slide for business and finance related presentations.
-
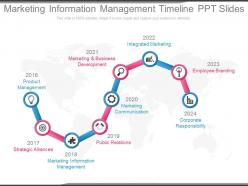 Marketing information management timeline ppt slides
Presenting marketing information management timeline ppt slides. This is a marketing information management timeline ppt slides. This is a nine stage process. The stages in this process are product management, strategic alliances, marketing information management, public relations, marketing communication, corporate responsibility, employee branding, integrated marketing, marketing and business development.
-
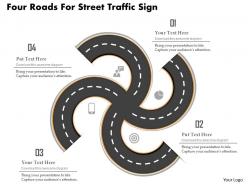 Cb four roads for street traffic sign powerpoint template
We are proud to present our cb four roads for street traffic sign powerpoint template. Graphic of four roads and street traffic sign has been used to design this power point template. This PPT contains the concept of business roadmap formation. Use this PPT diagram for business and marketing related presentations.
-
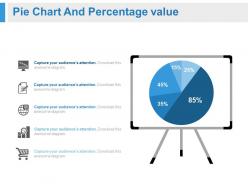 White board with pie chart and percentage powerpoint slides
Presenting white board with pie chart and percentage powerpoint slides. This Power Point template slide has been crafted with graphic of white board and pie chart diagram. This PPT slide contains the concept of business result analysis. Use this PPT slide for business and finance related presentations.
-
 Year based step timeline for business success growth powerpoint slides
Presenting year based step timeline for business success growth powerpoint slides. This Power Point template slide has been crafted with graphic of year based timeline. This PPT diagram contains the concept of business success and growth representation. Use this PPT slide for business and management related presentations.
-
 Cost reduction action plan ppt examples
Presenting cost reduction action plan ppt examples. This is a cost reduction action plan ppt examples. This is a six stage process. The stages in this process are business, marketing, process, management, circle.
-
 4 business kpis on sliding scale ppt examples professional
Presenting 4 business kpis on sliding scale ppt examples professional. This is a 4 business kpis on sliding scale ppt examples professional. This is a four stage process. The stages in this process are sliding scale, sliding bar.
-
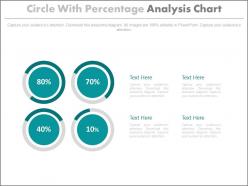 Four circle with percentage analysis chart powerpoint slides
Presenting four circle with percentage analysis chart powerpoint slides. This Power Point template slide has been crafted with graphic of four circle and percentage icons. This PPT slide contains the concept of percentage analysis representation. Use this PPT slide for business and finance related presentations.
-
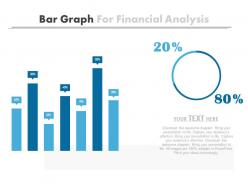 Bar graph for financial analysis powerpoint slides
Presenting bar graph for financial analysis powerpoint slides. This Power Point template slide has been crafted with graphic of bar graph. This PPT slide contains the concept of financial data analysis. Use this PPT slide for business and finance related presentations.
-
 Four text boxes for about us powerpoint slides
Presenting four text boxes for about us powerpoint slides. This Power Point template slide has been crafted with graphic of four text boxes. This PPT slide contains the concept of about us representation. Use this PPT slide for business and finance related presentations.
-
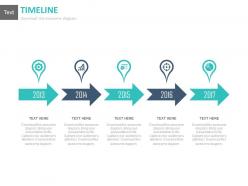 Linear arrow timeline chart with years and icons powerpoint slides
Presenting linear arrow timeline chart with years and icons powerpoint slides. This Power Point template slide has been crafted with graphic of linear arrow timeline chart and years diagram. This PPT slide contains the concept of business timeline formation representation. Use this PPT diagram for business and marketing related presentations.
-
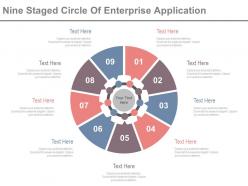 Nine staged circle of enterprise application powerpoint slides
Presenting nine staged circle of enterprise application powerpoint slides. This Power Point template diagram has been crafted with graphic of nine staged circle diagram. This PPT diagram contains the concept of enterprise application representation. Use this PPT diagram for business and finance related presentations.
-
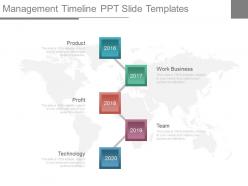 Management timeline ppt slide templates
Presenting management timeline ppt slide templates. This is a management timeline ppt slide templates. This is a five stage process. The stages in this process are product, work business, team, technology, profit.
-
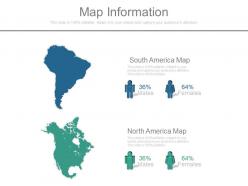 Original map information
Presenting original map information. This is a map information. This is a two stage process. The stages in this process are south america map, north america map.
-
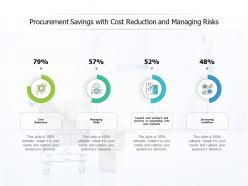 Procurement savings with cost reduction and managing risks
Presenting this set of slides with name Procurement Savings With Cost Reduction And Managing Risks. The topics discussed in these slides are Procurement Savings, Investment Savings, Managing Risks. This is a completely editable PowerPoint presentation and is available for immediate download. Download now and impress your audience.
-
 Four staged circle timeline infographics powerpoint slides
Presenting four staged circle timeline infographics powerpoint slides. This Power Point template slide has been designed with graphic of four staged circle timeline info graphics diagram. This PPT diagram contains the concept of marketing targets achievement and success milestones representation .Use this PPT slide for business and finance related presentations.
-
 Three staged timeline with icons for business agenda powerpoint slides
Presenting three staged timeline with icons for business agenda powerpoint slides. This Power Point template slide has been crafted with graphic of three staged timeline and icons. This PPT slide contains the concept of business agenda representation. Use this PPT slide for business and finance related presentations.
-
 Dollar value linear chart for financial growth powerpoint slides
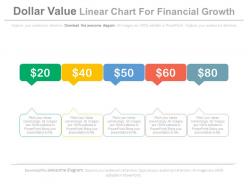
Presenting dollar value linear chart for financial growth powerpoint slides. This Power Point template slide has been crafted with graphic of dollar value linear chart icons. This PPT slide contains the concept of financial growth analysis. Use this PPT slide for business and finance related presentations.
-
 Three phase strategic cost reduction program
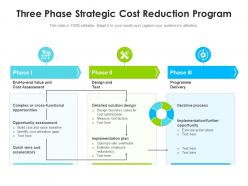
Introducing our premium set of slides with Three Phase Strategic Cost Reduction Program. Ellicudate the three stages and present information using this PPT slide. This is a completely adaptable PowerPoint template design that can be used to interpret topics like End To End Value And Cost Assessment, Complex Or Cross-Functional Opportunities, Opportunity Assessment, Detailed Solution Design. So download instantly and tailor it with your information.
-
 Product roadmap timeline 2d linear graph presenting every month business growth powerpoint templates slides
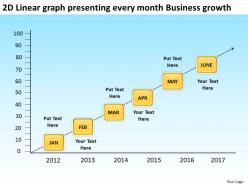
We are proud to present our product roadmap timeline 2d linear graph presenting every month business growth powerpoint templates slides. Use this PowerPoint diagram to graphically represent the growth for upcoming years using this 2d linear graph. Your brain is always churning out ideas like cogs in a wheel. The mind is always whirring with new ideas. Put them down and present them using our innovative Diagram. Activate the minds of your team with your ideas. Illustrate to them how it will take them to the very top.
-
 Three staged sales info year based chart powerpoint slides
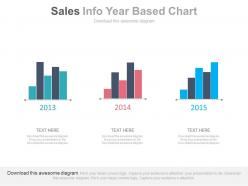
Presenting three staged sales info year based chart powerpoint slides. This Power Point template diagram with graphic of three staged year info chart diagram. This PPT diagram contains the concept of year based sales planning. Use this PPT diagram for business and sales related presentations.
-
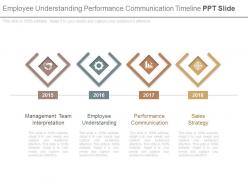 Employee understanding performance communication timeline ppt slide
Presenting employee understanding performance communication timeline ppt slide. This is a employee understanding performance communication timeline ppt slide. This is a four stage process. The stages in this process are timeline.
-
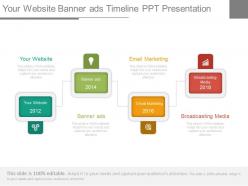 Your website banner ads timeline ppt presentation
The Ppt template comes with the high-resolution graphics incorporated subject to the customization of its colour, size, and orientation. Download the slide in the desired file format (JPEG, JPG, PDF). Remove the watermark and insert the desired content by using the complete guide that comes along with the Ppt template. Replace the icons as per your suitability. The stages in this process are timeline.
-
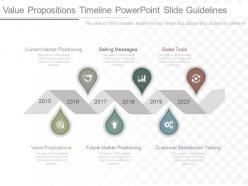 A value propositions timeline powerpoint slide guidelines
By and large flawless Presentation slides with Google slides. Fantastic assurance PowerPoint plots. PPT format unmistakable in standard and widescreen see. Change ought to be conceivable with shading, printed style, substance and arrangement. Can be changed into JPG and PDF mastermind planning slide arranges open with different center points and stages Sensible for business organization i.e. senior pioneers and managers, marketers, sellers, bankers and entrepreneurs.The stages in this process are current market positioning, selling messages, sales tools, value propositions and much more.


