Financial Analysis & Management PowerPoint Templates, Presentation Examples & PPT Slides
- Sub Categories
-
- 30 60 90 Day Plan
- About Us Company Details
- Action Plan
- Agenda
- Annual Report
- Audit Reports
- Balance Scorecard
- Brand Equity
- Business Case Study
- Business Communication Skills
- Business Plan Development
- Business Problem Solving
- Business Review
- Capital Budgeting
- Career Planning
- Change Management
- Color Palettes
- Communication Process
- Company Location
- Company Vision
- Compare
- Competitive Analysis
- Corporate Governance
- Cost Reduction Strategies
- Custom Business Slides
- Customer Service
- Dashboard
- Data Management
- Decision Making
- Digital Marketing Strategy
- Digital Transformation
- Disaster Management
- Diversity
- Equity Investment
- Financial Analysis
- Financial Services
- Financials
- Growth Hacking Strategy
- Human Resource Management
- Innovation Management
- Interview Process
- Knowledge Management
- Leadership
- Lean Manufacturing
- Legal Law Order
- Management
- Market Segmentation
- Marketing
- Media and Communication
- Meeting Planner
- Mergers and Acquisitions
- Metaverse
- Newspapers
- Operations and Logistics
- Organizational Structure
- Our Goals
- Performance Management
- Pitch Decks
- Pricing Strategies
- Process Management
- Product Development
- Product Launch Ideas
- Product Portfolio
- Project Management
- Purchasing Process
- Quality Assurance
- Quotes and Testimonials
- Real Estate
- Risk Management
- Sales Performance Plan
- Sales Review
- SEO
- Service Offering
- Six Sigma
- Social Media and Network
- Software Development
- Solution Architecture
- Stock Portfolio
- Strategic Management
- Strategic Planning
- Supply Chain Management
- Swimlanes
- System Architecture
- Team Introduction
- Testing and Validation
- Thanks-FAQ
- Time Management
- Timelines Roadmaps
- Value Chain Analysis
- Value Stream Mapping
- Workplace Ethic
-
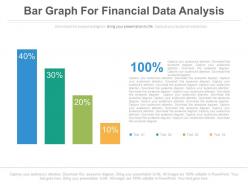 Bar graph for financial data analysis powerpoint slides
Presenting bar graph for financial data analysis powerpoint slides. This Power Point template diagram with graphic of bar graph and finance icons. This PPT diagram contains the concept of financial data analysis. Use this PPT diagram for business and finance related presentations.
-
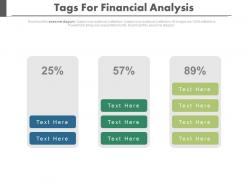 Three staged tags for financial analysis diagram powerpoint slides
Presenting three staged tags for financial analysis diagram powerpoint slides. This Power Point template diagram with graphic of three staged tags diagram. This PPT diagram contains the concept of financial analysis. Use this PPT diagram for business and finance related presentations.
-
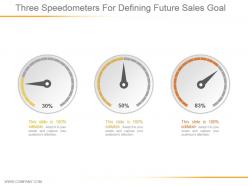 Three speedometers for defining future sales goal ppt slide examples
Presenting three speedometers for defining future sales goal ppt slide examples. This is a three speedometers for defining future sales goal ppt slide examples. This is a three stage process. The stages in this process are business, marketing, planning, presentation, technology.
-
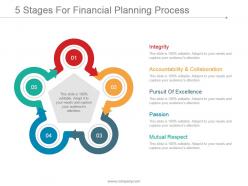 5 stages for financial planning process powerpoint shapes
Bringing this 5 Stages for Financial Planning Process PowerPoint Shapes slide. The PPT is available in both standard and widescreen sizes. The image has a high resolution which ensures optimum quality standards are maintained. It is available in PowerPoint and works well in Google Slides too. The slide is customizable. You can change the colors of the background and diagram to suit your company’s requirement. You can replace the dummy content with your presentation’s content. Also, the font style, size and color can be changed. You can add the business name and logo too. It can be downloaded easily.
-
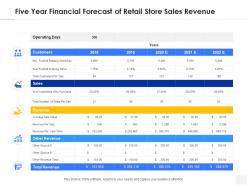 Five year financial forecast of retail store sales revenue
Introducing our Five Year Financial Forecast Of Retail Store Sales Revenue set of slides. The topics discussed in these slides are Customers, Sales, Revenue. This is an immediately available PowerPoint presentation that can be conveniently customized. Download it and convince your audience.
-
 Business Case Financials Dollar Symbol
Presenting our set of slides with name Business Case Financials Dollar Symbol. This exhibits information on one stage of the process. This is an easy-to-edit and innovatively designed PowerPoint template. So download immediately and highlight information on Business Case, Financials.
-
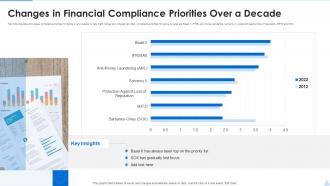 Changes In Financial Compliance Priorities Over A Decade
The following slide showcases compliance priorities for banks over a decade to help them mange and mitigate risk. Main compliance priorities for banks covered are Basel II, IFRS, anti-money laundering, solvency II, protection against loss of reputation, MiFID and SOX. Introducing our Changes In Financial Compliance Priorities Over A Decade set of slides. The topics discussed in these slides are Financial Compliance, Priorities. This is an immediately available PowerPoint presentation that can be conveniently customized. Download it and convince your audience.
-
 Real Estate Sales Associate Salary AI Image PowerPoint Presentation PPT ECS
Introducing a Visual PPT on Real Estate Sales Associate Salary. Our Presentation Specialists have meticulously designed each PowerPoint Slide. Modify the contents per your preference. Furthermore, this PPT Template fits all screen sizes and is even Google Slides-friendly. Download and personalize the PPT, and present it with confidence.
-
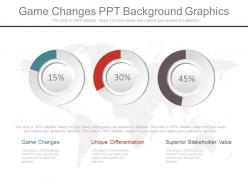 Game changes ppt background graphics
Presenting game changes ppt background graphics. This is a game changes ppt background graphics. This is a three stage process. The stages in this process are game changes, unique differentiation, superior stakeholder value.
-
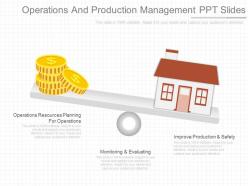 Operations and production management ppt slides
Presenting operations and production management ppt slides. This is a operations and production management ppt slides. This is a two stage process. The stages in this process are operations resources planning for operations, monitoring and evaluating, improve production and safety.
-
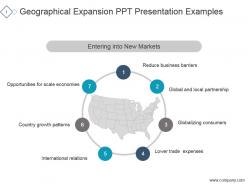 Geographical expansion ppt presentation examples
Presenting geographical expansion ppt presentation examples. This is a geographical expansion ppt presentation examples. This is a seven stage process. The stages in this process are opportunities for scale economies, country growth patterns, international relations, lower trade expenses, globalizing consumers, global and local partnership, reduce business barriers, entering into new markets.
-
 Financial strategy with finance laptop image
Presenting this set of slides with name Financial Strategy With Finance Laptop Image. This is a one stage process. The stages in this process are Financial Strategy, Business Strategy, Cash Management. This is a completely editable PowerPoint presentation and is available for immediate download. Download now and impress your audience.
-
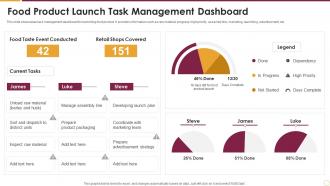 Food Product Launch Task Management Dashboard
This slide showcases task management dashboard for launching food product. It provides information such as raw material, progress, high priority, assembly line, marketing, launching, advertisement, etc. Presenting our well-structured Food Product Launch Task Management Dashboard. The topics discussed in this slide are Advertisement Strategy, Marketing Team, Developing Launch Plan. This is an instantly available PowerPoint presentation that can be edited conveniently. Download it right away and captivate your audience.
-
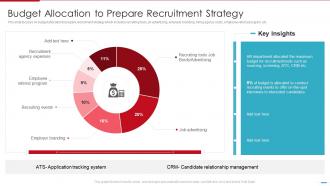 Steps Involved In Employment Process Budget Allocation To Prepare Recruitment Strategy
This slide focuses on budget allocation to prepare recruitment strategy which includes recruiting tools, jib advertising, employer branding, hiring agency costs, employee referral program, etc. Deliver an outstanding presentation on the topic using this Steps Involved In Employment Process Budget Allocation To Prepare Recruitment Strategy. Dispense information and present a thorough explanation of Candidate Relationship Management, Budget, Expenses using the slides given. This template can be altered and personalized to fit your needs. It is also available for immediate download. So grab it now.
-
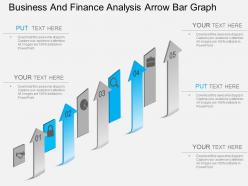 Ei business and finance analysis arrow bar graph powerpoint template
Utilization of cutting edge determination of pictures and the symbols in the slides. Permit altering of the size, style and introduction of the slide symbols. Inconvenience free inclusion of the organization's name or watermark. If guidelines to alter and change the slide symbol outline. Flexible with multiple format options like JPEG, JPG or PDF. Accessible an assortment of symbols to download and supplant in the slides. Valuable for the expert moderators and the business chiefs, financiers, businessmen, entrepreneurs, investors, and funding companies.
-
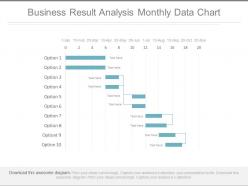 Business result analysis monthly data chart powerpoint slides
Presenting business result analysis monthly data chart powerpoint slides. This is a business result analysis monthly data chart powerpoint slides. This is a ten stage process. The stages in this process are financials.
-
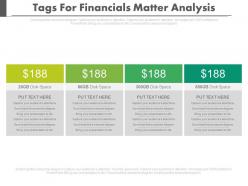 Four tags for financial matter analysis powerpoint slides
Presenting four tags for financial matter analysis powerpoint slides. This is a four tags for financial matter analysis powerpoint slides. This is a four stage process. The stages in this process are financials.
-
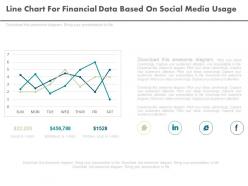 Line chart for financial data based on social media usage powerpoint slides
Presenting line chart for financial data based on social media usage powerpoint slides. This is a line chart for financial data based on social media usage powerpoint slides. This is a three stage process. The stages in this process are financials.
-
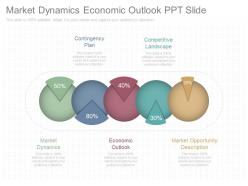 Market dynamics economic outlook ppt slide
Presenting market dynamics economic outlook ppt slide. This is a market dynamics economic outlook ppt slide. This is a five stage process. The stages in this process are contingency plan, competitive landscape, market opportunity description, economic outlook, market dynamics.
-
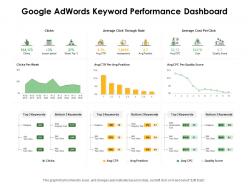 Google adwords keyword performance dashboard ppt powerpoint presentation ideas deck
Presenting this set of slides with name Google Adwords Keyword Performance Dashboard Ppt Powerpoint Presentation Ideas Deck. The topics discussed in these slides are Average, Cost Per Click, Quality. This is a completely editable PowerPoint presentation and is available for immediate download. Download now and impress your audience.
-
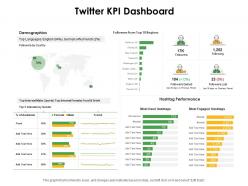 Twitter kpi dashboard ppt powerpoint presentation portfolio design templates
Presenting this set of slides with name Twitter KPI Dashboard Ppt Powerpoint Presentation Portfolio Design Templates. The topics discussed in these slides are Performance, Audience, Demographics. This is a completely editable PowerPoint presentation and is available for immediate download. Download now and impress your audience.
-
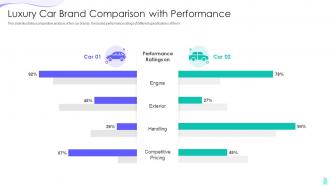 Luxury Car Brand Comparison With Performance
This slide illustrates comparative analysis of brands of XYZ product. It includes their market size, key features of these brands. Present the topic in a bit more detail with this Luxury Car Brand Comparison With Performance. Use it as a tool for discussion and navigation on Pricing Model, Competitive Pricing, Market Size. This template is free to edit as deemed fit for your organization. Therefore download it now.
-
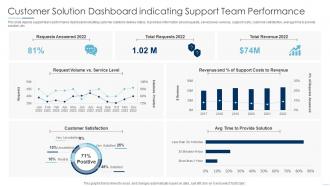 Customer Solution Dashboard Indicating Support Team Performance
This slide depicts support team performance dashboard indicating customer solutions delivery status. It provides information about requests,service level,revenue,support costs,customer satisfaction,average time to provide solution,etc. Introducing our Customer Solution Dashboard Indicating Support Team Performance set of slides. The topics discussed in these slides are Costs To Revenue, Customer Satisfaction, Total Requests. This is an immediately available PowerPoint presentation that can be conveniently customized. Download it and convince your audience.
-
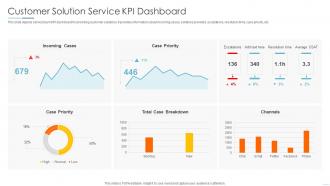 Customer Solution Service KPI Dashboard
This slide depicts service team KPI dashboard for providing customer solutions. It provides information about incoming cases, solutions provided, escalations, resolution time, case priority, etc. Introducing our Customer Solution Service KPI Dashboard set of slides. The topics discussed in these slides are Customer Solution Service KPI Dashboard. This is an immediately available PowerPoint presentation that can be conveniently customized. Download it and convince your audience.
-
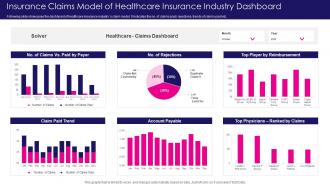 Insurance Claims Model Of Healthcare Insurance Industry Dashboard
Following slide showcases the dashboard of healthcare insurance industrys claim model. It indicates the no. of claims paid, rejections, trends of claims paid etc. Introducing our Insurance Claims Model Of Healthcare Insurance Industry Dashboard set of slides. The topics discussed in these slides are Insurance Claims Model Of Healthcare Insurance Industry Dashboard. This is an immediately available PowerPoint presentation that can be conveniently customized. Download it and convince your audience.
-
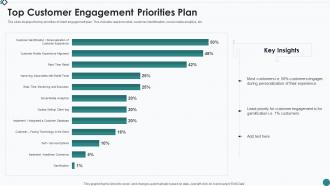 Top Customer Engagement Priorities Plan
The slide displays the top priorities of client engagement plan. This includes real time retail, customer identification, social media analytics, etc. Introducing our Top Customer Engagement Priorities Plan set of slides. The topics discussed in these slides are Customer Engagement, Priority, Experience. This is an immediately available PowerPoint presentation that can be conveniently customized. Download it and convince your audience.
-
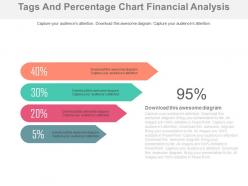 Four tags and percentage chart financial analysis powerpoint slides
Presenting four tags and percentage chart financial analysis powerpoint slides. This Power Point template diagram slide has been crafted with graphic of four tags and percentage chart diagram. This PPT diagram contains the concept of financial analysis. Use this PPT diagram for business and finance related presentations.
-
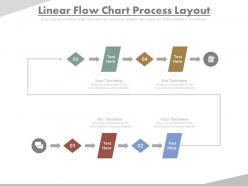 Linear flow chart process layout powerpoint slides
Presenting linear flow chart process layout powerpoint slides. This Power Point template diagram slide has been crafted with graphic of linear flow chart diagram. This PPT diagram contains the concept of business process layout representation. Use this PPT diagram for business and finance related presentations.
-
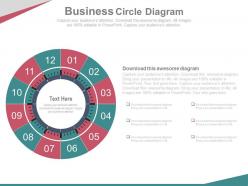 Twelve staged business circle diagram powerpoint slides
Presenting twelve staged business circle diagram powerpoint slides. This Power Point template diagram slide has been crafted with graphic of twelve staged circle diagram. This PPT diagram contains the concept of business process flow representation. Use this PPT diagram for business and finance related presentations.
-
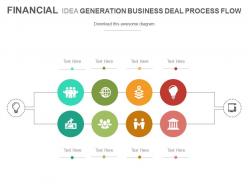 Financial idea generation business deal process flow powerpoint slides
Presenting financial idea generation business deal process flow powerpoint slides. This Power Point template slide has been crafted with graphic of finance info graphics. This PPT slide contains the concept of financial idea generation and business deal analysis. Use this PPT slide for business and finance related presentations.
-
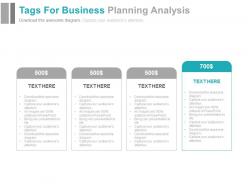 Four tags for business planning analysis powerpoint slides
Presenting four tags for business planning analysis powerpoint slides. This Power Point template slide has been crafted with graphic of four tags. This PPT slide contains the concept of business planning analysis. Use this PPT slide for business and finance related presentations.
-
 Saving piggy mobile dollars financial planning powerpoint slides
Presenting saving piggy mobile dollars financial planning powerpoint slides. This Power Point template slide has been crafted with graphic of piggy bank, dollars and mobile icons. This PPT slide contains the concept of financial planning. Use this PPT slide for business and finance related presentations.
-
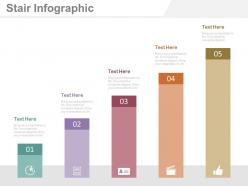 Five staged bar graph for financial management analysis powerpoint slides
Presenting five staged bar graph for financial management analysis powerpoint slides. This Power Point template diagram with graphic of five staged bar graph and icons. This PPT diagram contains the concept of financial management analysis. Use this PPT diagram for business and finance related presentations.
-
 Three social networks google plus viber and linkdin powerpoint slides
Presenting three social networks google plus viber and linkdin powerpoint slides. This Power Point template diagram with graphic of three social networks. This PPT diagram contains the concept of social networking for google,viber and LinkedIn. Use this PPT diagram for business and finance related presentations.
-
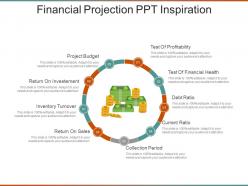 Financial projection ppt inspiration
Presenting financial projection ppt inspiration. This is a financial projection ppt inspiration. This is a nine stage process. The stages in this process are test of profitability, test of financial health, debt ratio, current ratio, collection period, return on sales, inventory turnover, return on investment, project budget.
-
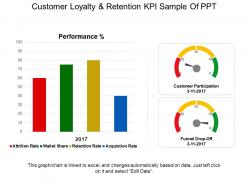 Customer loyalty and retention kpi sample of ppt
Presenting customer loyalty and retention kpi sample of ppt. This is a customer loyalty and retention kpi sample of ppt. This is a two stage process. The stages in this process are attrition rate, wallet share, retention rate, acquisition rate.
-
 Liquidity icon showing tap with dollar sign
Presenting this set of slides with name - Liquidity Icon Showing Tap With Dollar Sign. This is a four stage process. The stages in this process are Cash Assets, Solvency, Liquidity.
-
 Financial analysis ppt example file
Presenting this set of slides with name - Financial Analysis Ppt Example File. This is a six stage process. The stages in this process are Financial Statement Analysis, Financial Projections, Modes Of Finance, Key Financial Ratios, Cost Of The Project.
-
 Portfolio risk and return analysis powerpoint presentation slides
Presenting this set of slides with name - Portfolio Risk And Return Analysis Powerpoint Presentation Slides. Enhance your audiences knowledge with this well researched complete deck. Showcase all the important features of the deck with perfect visuals. This deck comprises of total of twenty nine slides with each slide explained in detail. Each template comprises of professional diagrams and layouts. Our professional PowerPoint experts have also included icons, graphs and charts for your convenience. All you have to do is DOWNLOAD the deck. Make changes as per the requirement. Yes, these PPT slides are completely customizable. Edit the colour, text and font size. Add or delete the content from the slide. And leave your audience awestruck with the professionally designed Portfolio Risk And Return Analysis Powerpoint Presentation Slides complete deck.
-
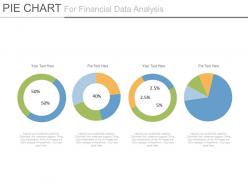 Four pie charts for financial data analysis powerpoint slides
Presenting four pie charts for financial data analysis powerpoint slides. This Power Point template diagram has been crafted with graphic of four pie charts diagram. This PPT diagram contains the concept of financial data analysis. Use this PPT diagram for business and finance related presentations.
-
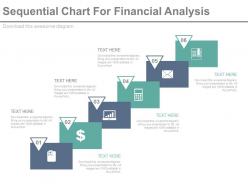 Six staged sequential chart for financial analysis powerpoint slides
Presenting six staged sequential chart for financial analysis powerpoint slides. This Power Point template diagram has been crafted with graphic of six staged sequential chart and percentage diagram. This PPT diagram contains the concept of financial analysis. Use this PPT diagram for business and finance related presentations.
-
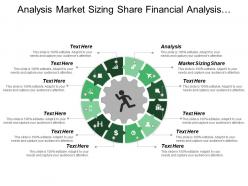 Analysis market sizing share financial analysis success factors finances
Presenting this set of slides with name - Analysis Market Sizing Share Financial Analysis Success Factors Finances. This is an editable twelve stages graphic that deals with topics like Analysis, Market Sizing Share, Financial Analysis, Success Factors, Finances to help convey your message better graphically. This product is a premium product available for immediate download, and is 100 percent editable in Powerpoint. Download this now and use it in your presentations to impress your audience.
-
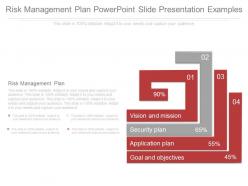 Risk management plan powerpoint slide presentation examples
Presenting risk management plan powerpoint slide presentation examples. This is a risk management plan powerpoint slide presentation examples. This is a four stage process. The stages in this process are vision and mission, security plan, application plan, goal and objectives.
-
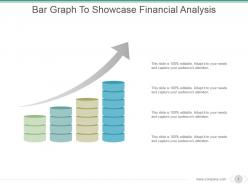 Bar graph to showcase financial analysis powerpoint ideas
Presenting bar graph to showcase financial analysis powerpoint ideas. This is a bar graph to showcase financial analysis powerpoint ideas. This is a four stage process. The stages in this process are arrow, financial, analysis, marketing, strategy, business.
-
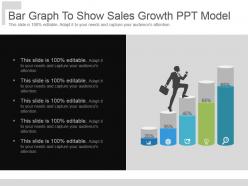 Bar graph to show sales growth ppt model
Presenting bar graph to show sales growth ppt model. This is a bar graph to show sales growth ppt model. This is a five stage process. The stages in this process are business, marketing, process, success, strategy.
-
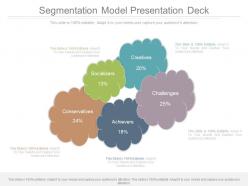 Segmentation model presentation deck
Presenting segmentation model presentation deck. This is a segmentation model presentation deck. This is a five stage process. The stages in this process are creatives, socializers, conservatives, challenges, achievers.
-
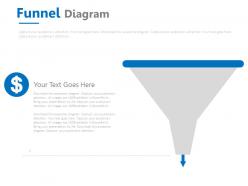 Funnel diagram with dollar symbol powerpoint slides
Presenting funnel diagram with dollar symbol powerpoint slides. This Power Point template slide has been crafted with graphic of funnel diagram and dollar symbol. This PPT slide contains the concept of financial analysis and process flow. Use this PPT slide for business and finance related presentations.
-
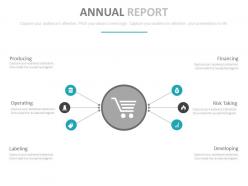 Annual report with financial analysis powerpoint slides
Presenting annual report with financial analysis powerpoint slides. This Power Point template diagram has been crafted with graphic of annual report diagram. This PPT diagram contains the concept of financial analysis. Use this PPT diagram for business and finance related presentations.
-
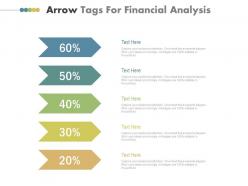 Five tags arrow tags for financial analysis powerpoint slides
Presenting five tags arrow tags for financial analysis powerpoint slides. This Power Point template diagram has been crafted with graphic of five arrow tags diagram. This PPT diagram contains the concept of financial analysis. Use this PPT diagram for business and finance related presentations.
-
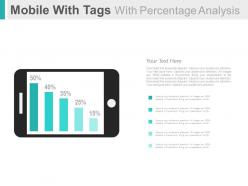 Mobile with tags with percentage analysis powerpoint slides
Presenting mobile with tags with percentage analysis powerpoint slides. This Power Point template diagram has been crafted with graphic of mobile with tags and percentage diagram. This PPT diagram contains the concept of banking solutions analysis. Use this PPT diagram for business and finance related presentations.
-
 Sequential timeline made with pie chart and percentage powerpoint slides
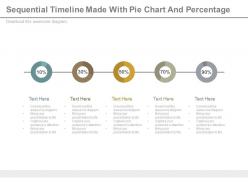
Presenting sequential timeline made with pie chart and percentage powerpoint slides. This Power Point template slide has been crafted with graphic of sequential timeline and pie chart This PPT slide contains the concept of financial data analysis and planning. Use this PPT slide for business and finance related presentations.
-
 Two line charts financial projection powerpoint slides
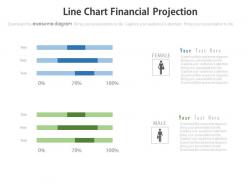
Presenting two line charts financial projection powerpoint slides. This Power Point template slide has been crafted with graphic of two line chart. This PPT slide contains the concept of financial projection. Use this PPT slide for business and finance related presentations.
-
 Original save money for future sample layout powerpoint slide
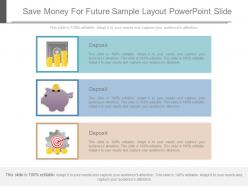
Presenting original save money for future sample layout powerpoint slide. This is a save money for future sample layout powerpoint slide. This is a three stage process. The stages in this process are deposit.
-
 Different money market portfolio account graph ppt slides
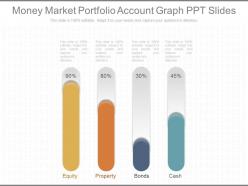
Presenting different money market portfolio account graph ppt slides. This is a money market portfolio account graph ppt slides. This is a four stage process. The stages in this process are equity, property, bonds, cash.
-
 Financial analysis of business results on screen
Presenting this set of slides with name Financial Analysis Of Business Results On Screen. This is a four stage process. The stages in this process are Financial Analysis Of Business Results On Screen. This is a completely editable PowerPoint presentation and is available for immediate download. Download now and impress your audience.
-
 Liquidity icon showing water drop with dollar sign
Presenting this set of slides with name - Liquidity Icon Showing Water Drop With Dollar Sign. This is a four stage process. The stages in this process are Cash Assets, Solvency, Liquidity.
-
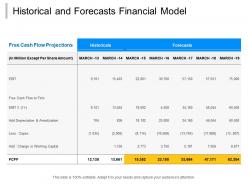 Historical and forecasts financial model
Presenting this set of slides with name - Historical And Forecasts Financial Model. This is a two stage process. The stages in this process are Financial Analysis, Income Statement, Balance Sheet.
-
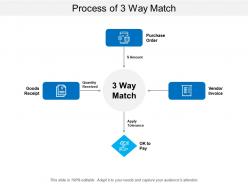 Process of 3 way match
Presenting this set of slides with name - Process Of 3 Way Match. This is a four stage process. The stages in this process are Three Way Match,Three Document,Accounting.
-
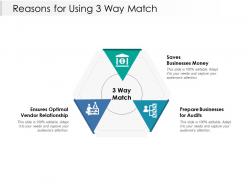 Reasons for using 3 way match
Presenting this set of slides with name - Reasons For Using 3 Way Match. This is a three stage process. The stages in this process are Three Way Match,Three Document,Accounting.
-
 Pricing tag icon with dollar sign
Presenting our set of slides with Pricing Tag Icon With Dollar Sign. This exhibits information on three stages of the process. This is an easy-to-edit and innovatively designed PowerPoint template. So download immediately and highlight information on Pricing Tag Icon With Dollar Sign.


