Financial Analysis & Management PowerPoint Templates, Presentation Examples & PPT Slides
- Sub Categories
-
- 30 60 90 Day Plan
- About Us Company Details
- Action Plan
- Agenda
- Annual Report
- Audit Reports
- Balance Scorecard
- Brand Equity
- Business Case Study
- Business Communication Skills
- Business Plan Development
- Business Problem Solving
- Business Review
- Capital Budgeting
- Career Planning
- Change Management
- Color Palettes
- Communication Process
- Company Location
- Company Vision
- Compare
- Competitive Analysis
- Corporate Governance
- Cost Reduction Strategies
- Custom Business Slides
- Customer Service
- Dashboard
- Data Management
- Decision Making
- Digital Marketing Strategy
- Digital Transformation
- Disaster Management
- Diversity
- Equity Investment
- Financial Analysis
- Financial Services
- Financials
- Growth Hacking Strategy
- Human Resource Management
- Innovation Management
- Interview Process
- Knowledge Management
- Leadership
- Lean Manufacturing
- Legal Law Order
- Management
- Market Segmentation
- Marketing
- Media and Communication
- Meeting Planner
- Mergers and Acquisitions
- Metaverse
- Newspapers
- Operations and Logistics
- Organizational Structure
- Our Goals
- Performance Management
- Pitch Decks
- Pricing Strategies
- Process Management
- Product Development
- Product Launch Ideas
- Product Portfolio
- Project Management
- Purchasing Process
- Quality Assurance
- Quotes and Testimonials
- Real Estate
- Risk Management
- Sales Performance Plan
- Sales Review
- SEO
- Service Offering
- Six Sigma
- Social Media and Network
- Software Development
- Solution Architecture
- Stock Portfolio
- Strategic Management
- Strategic Planning
- Supply Chain Management
- Swimlanes
- System Architecture
- Team Introduction
- Testing and Validation
- Thanks-FAQ
- Time Management
- Timelines Roadmaps
- Value Chain Analysis
- Value Stream Mapping
- Workplace Ethic
-
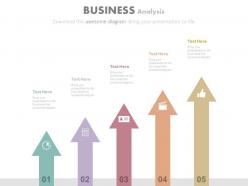 Five vertical arrows with icons for business analysis powerpoint slides
Presenting five vertical arrows with icons for business analysis powerpoint slides. This Power Point template diagram has been crafted with graphic of five vertical arrow and icons diagram. This PPT diagram contains the concept of business analysis. Use this PPT diagram for business and finance related presentations.
-
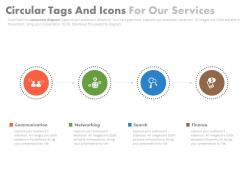 Four staged circular tags and icons for our services powerpoint slides
Presenting four staged circular tags and icons for our services powerpoint slides. This Power Point template diagram has been crafted with graphic of four staged circular tags and icons diagram. This PPT diagram contains the concept of business services representation. Use this PPT diagram for business and finance related presentations.
-
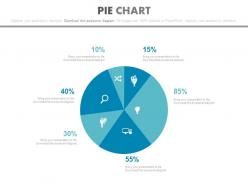 Pie chart with financial value calculation powerpoint slides
Presenting pie chart with financial value calculation powerpoint slides. This Power Point template diagram has been crafted with graphic of pie chart diagram. This PPT diagram contains the concept of financial value calculation representation. Use this PPT diagram for business and finance related presentations.
-
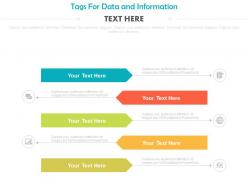 Five colored tags for data and information powerpoint slides
Presenting five colored tags for data and information powerpoint slides. This Power Point template diagram slide has been crafted with graphic of five colored tags and icons diagram. This PPT diagram contains the concept of data and information representation. Use this PPT diagram for business and data related presentations.
-
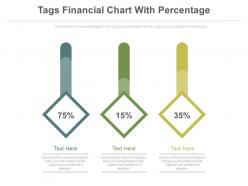 Three tags financial chart with percentage powerpoint slides
Presenting three tags financial chart with percentage powerpoint slides. This Power Point template diagram slide has been crafted with graphic of three tags and chart diagram. This PPT diagram contains the concept of financial data analysis representation. Use this PPT diagram for business and finance related presentations.
-
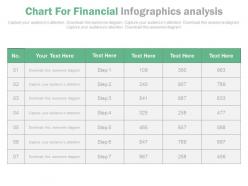 Chart for financial infographics analysis powerpoint slides
Presenting chart for financial infographics analysis powerpoint slides. This Power Point template slide has been crafted with graphic of chart and icons. This PPT slide contains the concept of financial analysis. Use this PPT slide for business and finance related presentations.
-
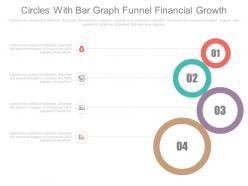 Four circles bar graph financial growth analysis powerpoint slides
Presenting four circles bar graph financial growth analysis powerpoint slides. This Power Point template diagram with graphic of four circles and bar graph. This PPT diagram contains the concept of financial growth analysis. Use this PPT diagram for business and finance related presentations.
-
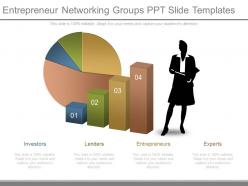 Entrepreneur networking groups ppt slide templates
Presenting entrepreneur networking groups ppt slide templates. This is a entrepreneur networking groups ppt slide templates. This is a four stage process. The stages in this process are investors, lenders, entrepreneurs, experts.
-
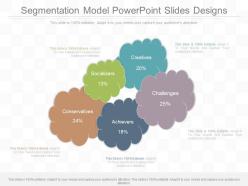 Apt segmentation model powerpoint slides designs
Presenting apt segmentation model powerpoint slides designs. This is a segmentation model powerpoint slides designs. This is a five stage process. The stages in this process are socializers, creatives, challenges, achievers, conservatives.
-
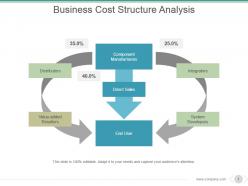 Business cost structure analysis powerpoint layout
Presenting business cost structure analysis powerpoint layout. This is a business cost structure analysis powerpoint layout. This is a four stage process. The stages in this process are component manufacturers, distributors, direct sales, integrators, value added resellers, end user, system developers.
-
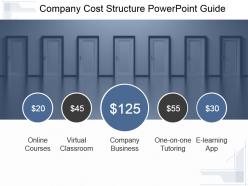 Company cost structure powerpoint guide
Presenting company cost structure powerpoint guide. This is a company cost structure powerpoint guide. This is a five stage process. The stages in this process are online courses, virtual classroom, company business, one on one tutoring, e learning app.
-
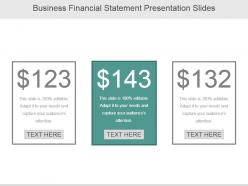 Business financial statement presentation slides
Presenting business financial statement presentation slides. This is a business financial statement presentation slides. This is a three stage process. The stages in this process are dollar, symbol, business, finance, management.
-
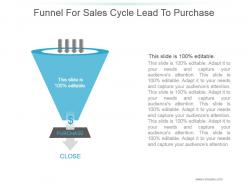 Funnel for sales cycle lead to purchase powerpoint slides design
Presenting funnel for sales cycle lead to purchase powerpoint slides design. This is a funnel for sales cycle lead to purchase powerpoint slides design. This is a one stage process. The stages in this process are business, marketing, funnel, purchase, management.
-
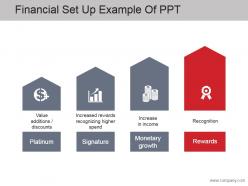 Financial set up example of ppt
Presenting financial set up example of ppt. This is a financial set up example of ppt. This is a four stage process. The stages in this process are value additions discounts, increased rewards, recognizing higher spend, increase in income, recognition, rewards, monetary growth, signature, platinum.
-
 Stock pitch for satellite based solutions powerpoint presentation ppt slide template
Our Stock Pitch For Satellite Based Solutions Powerpoint Presentation Ppt Slide Template is the perfect way to pitch your stock. We have researched thousands of stock pitches and designed the most impactful way to convince your investors to invest in your equity.
-
 Company pricing tag on product icon
Introducing our premium set of slides with Company Pricing Tag On Product Icon. Elucidate the three stages and present information using this PPT slide. This is a completely adaptable PowerPoint template design that can be used to interpret topics like Company Pricing Tag On Product Icon. So download instantly and tailor it with your information.
-
 Pricing tag icon with dollar coin
Introducing our premium set of slides with Pricing Tag Icon With Dollar Coin. Elucidate the three stages and present information using this PPT slide. This is a completely adaptable PowerPoint template design that can be used to interpret topics like Pricing Tag Icon With Dollar Coin. So download instantly and tailor it with your information.
-
 Product tag icon with pricing rate approval
Introducing our premium set of slides with Product Tag Icon With Pricing Rate Approval. Elucidate the three stages and present information using this PPT slide. This is a completely adaptable PowerPoint template design that can be used to interpret topics like Product Tag Icon With Pricing Rate Approval. So download instantly and tailor it with your information.
-
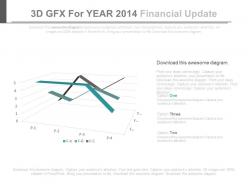 3d gfx for year 2014 financial updates powerpoint slides
Presenting 3d gfx for year 2014 financial updates powerpoint slides. This is a 3d gfx for year 2014 financial updates powerpoint slides. This is a three stage process. The stages in this process are financials.
-
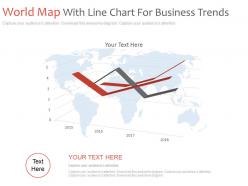 World map with line chart for business trends powerpoint slides
Presenting world map with line chart for business trends powerpoint slides. This is a world map with line chart for business trends powerpoint slides. This is a one stage process. The stages in this process are financials.
-
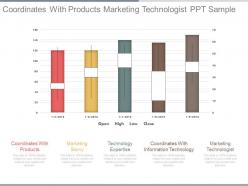 Coordinates with products marketing technologist ppt sample
Presenting coordinates with products marketing technologist ppt sample. This is a coordinates with products marketing technologist ppt sample. This is a five stage process. The stages in this process are timeline, strategy.
-
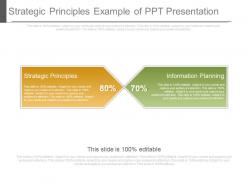 Strategic principles example of ppt presentation
Presenting strategic principles example of ppt presentation. This is a strategic principles example of ppt presentation. This is a two stage process. The stages in this process are finance, business, management.
-
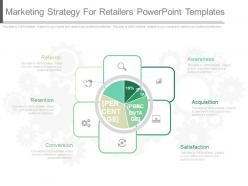 Marketing strategy for retailers powerpoint templates
User friendly fine quality PPT templates. Easy customization of colour, size, text and orientation of each icon and graphic. Effortless inclusion or exclusion of data as per demand. Personalisation by addition of company name, trademark or logo. Fit in widescreen. Compatible with varied info graphic software. Advantageous for business planners, business managers, marketing and financial executives, strategists, teachers, students. The stages in this process are referral, awareness, retention, conversion, satisfaction, acquisition.
-
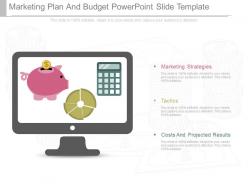 Use marketing plan and budget powerpoint slide template
Presenting use marketing plan and budget powerpoint slide template. This is a marketing plan and budget powerpoint slide template. This is a three stage process. The stages in this process are marketing strategies, tactics, costs and projected results.
-
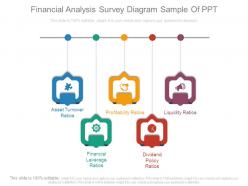 Financial analysis survey diagram sample of ppt
Presenting financial analysis survey diagram sample of ppt. This is a financial analysis survey diagram sample of ppt. This is a five stage process. The stages in this process are dividend policy ratios, financial leverage ratios, asset turnover ratios, profitability ratios, liquidity ratios.
-
 Liquidity cash icon with dollar coins
Presenting this set of slides with name - Liquidity Cash Icon With Dollar Coins. This is a four stage process. The stages in this process are Cash Assets, Solvency, Liquidity.
-
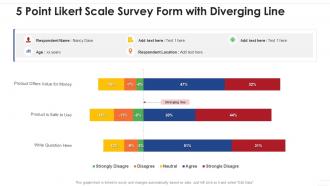 5 point likert scale survey form with diverging line
Introducing our 5 Point Likert Scale Survey Form With Diverging Line set of slides. The topics discussed in these slides are 5 Point Likert Scale Survey Form With Diverging Line. This is an immediately available PowerPoint presentation that can be conveniently customized. Download it and convince your audience.
-
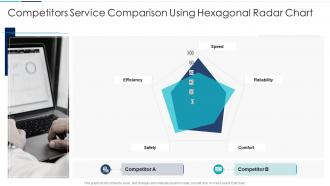 Competitors service comparison using hexagonal radar chart
Presenting our well structured Competitors Service Comparison Using Hexagonal Radar Chart. The topics discussed in this slide are Competitors Service Comparison Using Hexagonal Radar Chart. This is an instantly available PowerPoint presentation that can be edited conveniently. Download it right away and captivate your audience.
-
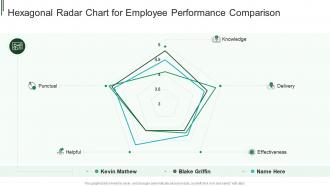 Hexagonal radar chart for employee performance comparison
Presenting our well structured Hexagonal Radar Chart For Employee Performance Comparison. The topics discussed in this slide are Hexagonal Radar Chart For Employee Performance Comparison. This is an instantly available PowerPoint presentation that can be edited conveniently. Download it right away and captivate your audience.
-
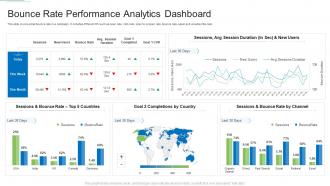 Bounce rate performance analytics dashboard
This slide covers email bounce rate in a campaign. It includes different KPI such as open rate, click rate, open to unopen rate, bounce rate, spam and unsubscribe rate. Introducing our Bounce Rate Performance Analytics Dashboard set of slides. The topics discussed in these slides are Bounce Rate Performance Analytics Dashboard . This is an immediately available PowerPoint presentation that can be conveniently customized. Download it and convince your audience.
-
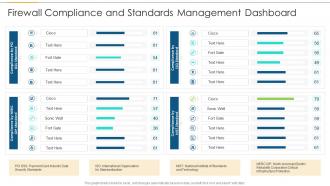 Firewall compliance and standards management dashboard
Presenting our well structured Firewall Compliance And Standards Management Dashboard. The topics discussed in this slide are Technology, Organisation, Infrastructure Protection. This is an instantly available PowerPoint presentation that can be edited conveniently. Download it right away and captivate your audience.
-
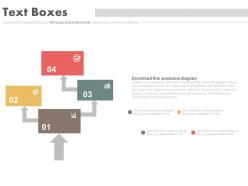 Four staged text boxes flow chart analysis powerpoint slides
Presenting four staged text boxes flow chart analysis powerpoint slides. This Power Point template diagram has been crafted with graphic of four staged text boxes and flow chart diagram. This PPT diagram contains the concept of business process flow representation. Use this PPT diagram for business and finance related presentations.
-
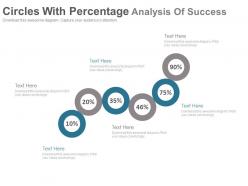 Six circles with percentage analysis of success powerpoint slides
Presenting six circles with percentage analysis of success powerpoint slides. This Power Point template diagram has been crafted with graphic of six circles and percentage diagram. This PPT diagram contains the concept of success analysis representation. Use this PPT diagram for business and finance related presentations.
-
 Five squares and icons for innovation strategy powerpoint slides
Presenting five squares and icons for innovation strategy powerpoint slides. This Power Point template diagram slide has been crafted with graphic of five squares and icons diagram. This PPT diagram contains the concept of business innovation strategy. Use this PPT diagram for business and finance related presentations.
-
 Six staged tags for financial data representation powerpoint slides
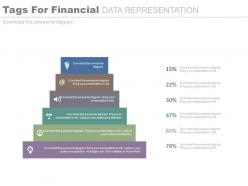
Presenting six staged tags for financial data representation powerpoint slides. This Power Point template diagram slide has been crafted with graphic of six staged tags diagram. This PPT diagram contains the concept of financial data representation. Use this PPT diagram for business and finance related presentations.
-
 Five staged stair and icons diagram powerpoint slides
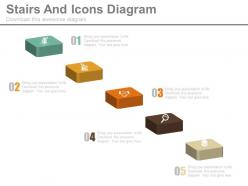
Presenting five staged stair and icons diagram powerpoint slides. This Power Point template slide has been crafted with graphic of five staged stair and icons chart. This PPT slide contains the concept of financial growth and success analysis. Use this PPT slide for business and finance related presentations.
-
 Three staged business planning diagram powerpoint slides
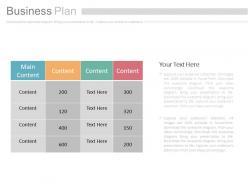
No risk of picture pixilation whatever be the size of display screen. Allow instant downloading and saving of the slide design. Follow the provided instructions to modify the layout and customize it. Fix the background with your business trademark or logo. Use additional icons available to download. Beneficial for the business managers, traders, presenters and the relevant individuals in a trading company.
-
 Five staged bar graph for business development and testing powerpoint slides
Presenting five staged bar graph for business development and testing powerpoint slides. This Power Point template slide has been crafted with graphic of five staged bar graph. This PPT slide contains the concept of business development and testing. Use this PPT slide for business and finance related presentations.
-
 Four tags for financial data and info analysis powerpoint slides
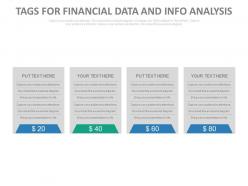
Presenting four tags for financial data and info analysis powerpoint slides. This Power Point template slide has been crafted with graphic of four tags. This PPT slide contains the concept of financial data and info analysis. Use this PPT slide for business and finance related presentations.
-
 Effectiveness of information technology powerpoint graphics
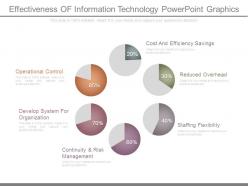
Presenting effectiveness of information technology powerpoint graphics. This is a effectiveness of information technology powerpoint graphics. This is a six stage process. The stages in this process are operational control, cost and efficiency savings, reduced overhead, staffing flexibility, continuity and risk management, develop system for organization.
-
 Key financial ratios powerpoint slide show
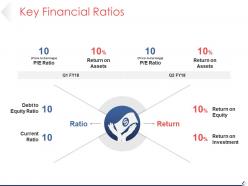
Presenting key financial ratios powerpoint slide show. This is a key financial ratios powerpoint slide show. This is a one stage process. The stages in this process are debt to equity ratio, current ratio, return, ratio, return on assets.
-
 Working capital best practices benchmarking analytics and outcomes
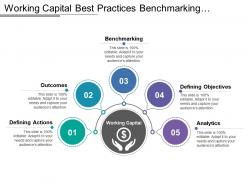
Presenting this set of slides with name - Working Capital Best Practices Benchmarking Analytics And Outcomes. This is a five stage process. The stages in this process are Working Capital, Wc, Financial Metric.
-
 Business financial strategy with stack of coins icon
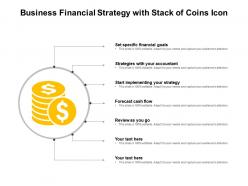
Presenting this set of slides with name Business Financial Strategy With Stack Of Coins Icon. This is a one stage process. The stages in this process are Financial Strategy, Business Strategy, Cash Management. This is a completely editable PowerPoint presentation and is available for immediate download. Download now and impress your audience.
-
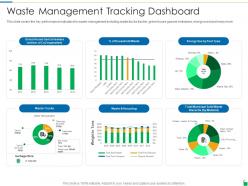 Waste management tracking dashboard waste disposal and recycling management ppt powerpoint samples
This slide covers the key performance indicators for waste management including waste trucks tracker, green house gasses emissions, energy used and many more. Deliver an outstanding presentation on the topic using this Waste Management Tracking Dashboard Waste Disposal And Recycling Management Ppt Powerpoint Samples. Dispense information and present a thorough explanation of Waste Management Tracking Dashboard using the slides given. This template can be altered and personalized to fit your needs. It is also available for immediate download. So grab it now.
-
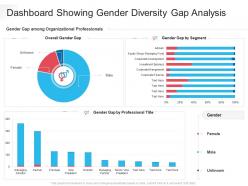 Dashboard showing gender diversity gap analysis
Introducing our Dashboard Showing Gender Diversity Gap Analysis set of slides. The topics discussed in these slides are Dashboard Showing Gender Diversity Gap Analysis. This is an immediately available PowerPoint presentation that can be conveniently customized. Download it and convince your audience.
-
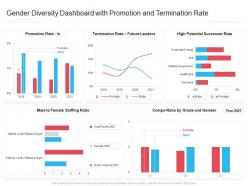 Gender diversity dashboard with promotion and termination rate
Introducing our Gender Diversity Dashboard With Promotion And Termination Rate set of slides. The topics discussed in these slides are Potential Successor Rate, Promotion Rate. This is an immediately available PowerPoint presentation that can be conveniently customized. Download it and convince your audience.
-
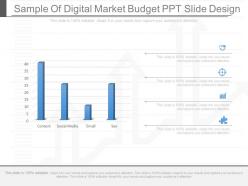 View sample of digital market budget ppt slide design
Presenting view sample of digital market budget ppt slide design. This is a sample of digital market budget ppt slide design. This is a four stage process. The stages in this process are content, social media, email, seo.
-
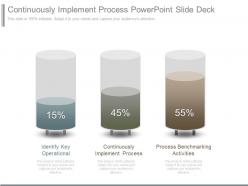 Continuously implement process powerpoint slide deck
Presenting continuously implement process powerpoint slide deck. This is a continuously implement process powerpoint slide deck. This is a three stage process. The stages in this process are identify key operational, continuously implement process, process benchmarking activities.
-
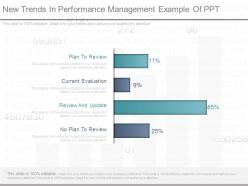 New trends in performance management example of ppt
Presenting new trends in performance management example of ppt. This is a new trends in performance management example of ppt. This is a four stage process. The stages in this process are plan to review, current evaluation, review and update, no plan to review.
-
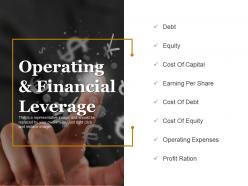 Operating and financial leverage ppt model
SlideTeam would like to present to all of its viewers this 100% editable operating and financing leverage PPT model. This PPT template lets you alter the font style, font color and font size of the image used in it. The business slides after being downloaded can be viewed in widescreen display ratio of 16:9 or standard size display ratio of 4:3. The PowerPoint presentation is very user-friendly as it is compatible with Google Slides and can be saved in the format of PDF or JPG.
-
 Earn money and time management
Presenting this set of slides with name - Earn Money And Time Management. This is a three stages process. The stages in this process are Earn Money, Earn Cash, Earn Funds.
-
 Earn money icon with time management
Presenting this set of slides with name - Earn Money Icon With Time Management. This is a three stages process. The stages in this process are Earn Money, Earn Cash, Earn Funds.
-
 Financial model icon
Presenting this set of slides with name - Financial Model Icon. This is a four stage process. The stages in this process are Financial Analysis, Income Statement, Balance Sheet.
-
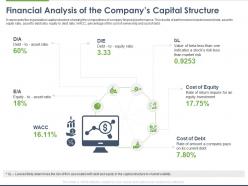 Financial analysis of the companys capital structure ppt powerpoint presentation file objects
It represents the organization capital structure showing the compositions of company financial performance. The results of performance include levered beta, asset to equity ratio, asset to debt ratio, equity to debt ratio, WACC, percentage of the cost of ownership and cost of debt. Presenting this set of slides with name Financial Analysis Of The Companys Capital Structure Ppt Powerpoint Presentation File Objects. The topics discussed in these slides are Asset Ratio, Equity Ratio, Stocks, Market Risk, Investment. This is a completely editable PowerPoint presentation and is available for immediate download. Download now and impress your audience.
-
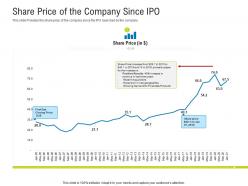 Share price of the company since ipo raise funding after ipo equity ppt slides
This slide Provides the share prize of the company since the IPO launched by the company. Present the topic in a bit more detail with this Share Price Of The Company Since IPO Raise Funding After IPO Equity Ppt Slides. Use it as a tool for discussion and navigation on Demand, Financials, Geographies, Revenue, Price. This template is free to edit as deemed fit for your organization. Therefore download it now.
-
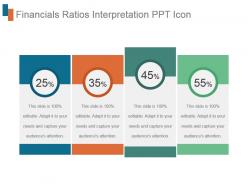 Financials ratios interpretation ppt icon
Presenting financials ratios interpretation ppt icon. This is a financials ratios interpretation ppt icon. This is a four stage process. The stages in this process are layered, management, strategy, business, marketing.
-
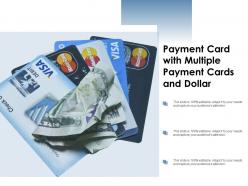 Payment card with multiple payment cards and dollar
Presenting this set of slides with name - Payment Card With Multiple Payment Cards And Dollar. This is a three stage process. The stages in this process are Payment Card, Cash Card, Bank Card.
-
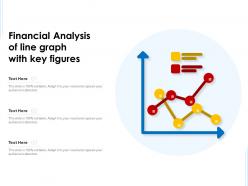 Financial analysis of line graph with key figures
Presenting this set of slides with name Financial Analysis Of Line Graph With Key Figures. The topics discussed in these slide is Financial Analysis Of Line Graph With Key Figures. This is a completely editable PowerPoint presentation and is available for immediate download. Download now and impress your audience.
-
 Bar graph for social media users with test tubes powerpoint slides
Presenting bar graph for social media users with test tubes powerpoint slides. This Power Point template diagram slide has been crafted with graphic of bar graph and test tubes. This PPT diagram contains the concept of analysis for social media users. Use this PPT diagram for business and internet related presentations.
-
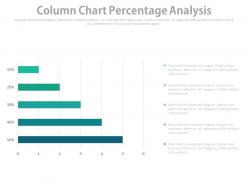 Column chart percentage analysis powerpoint slides
Presenting column chart percentage analysis powerpoint slides. This is a column chart percentage analysis powerpoint slides. This is a five stage process. The stages in this process are financials.


