Financial Analysis & Management PowerPoint Templates, Presentation Examples & PPT Slides
- Sub Categories
-
- 30 60 90 Day Plan
- About Us Company Details
- Action Plan
- Agenda
- Annual Report
- Audit Reports
- Balance Scorecard
- Brand Equity
- Business Case Study
- Business Communication Skills
- Business Plan Development
- Business Problem Solving
- Business Review
- Capital Budgeting
- Career Planning
- Change Management
- Color Palettes
- Communication Process
- Company Location
- Company Vision
- Compare
- Competitive Analysis
- Corporate Governance
- Cost Reduction Strategies
- Custom Business Slides
- Customer Service
- Dashboard
- Data Management
- Decision Making
- Digital Marketing Strategy
- Digital Transformation
- Disaster Management
- Diversity
- Equity Investment
- Financial Analysis
- Financial Services
- Financials
- Growth Hacking Strategy
- Human Resource Management
- Innovation Management
- Interview Process
- Knowledge Management
- Leadership
- Lean Manufacturing
- Legal Law Order
- Management
- Market Segmentation
- Marketing
- Media and Communication
- Meeting Planner
- Mergers and Acquisitions
- Metaverse
- Newspapers
- Operations and Logistics
- Organizational Structure
- Our Goals
- Performance Management
- Pitch Decks
- Pricing Strategies
- Process Management
- Product Development
- Product Launch Ideas
- Product Portfolio
- Project Management
- Purchasing Process
- Quality Assurance
- Quotes and Testimonials
- Real Estate
- Risk Management
- Sales Performance Plan
- Sales Review
- SEO
- Service Offering
- Six Sigma
- Social Media and Network
- Software Development
- Solution Architecture
- Stock Portfolio
- Strategic Management
- Strategic Planning
- Supply Chain Management
- Swimlanes
- System Architecture
- Team Introduction
- Testing and Validation
- Thanks-FAQ
- Time Management
- Timelines Roadmaps
- Value Chain Analysis
- Value Stream Mapping
- Workplace Ethic
-
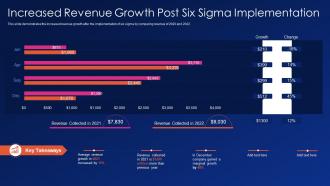 Increased revenue growth post six sigma implementation ppt powerpoint maker
This slide demonstrates the increased revenue growth after the implementation of six sigma by comparing revenue of 2020 and 2022. Present the topic in a bit more detail with this Increased Revenue Growth Post Six Sigma Implementation Ppt Powerpoint Maker. Use it as a tool for discussion and navigation on Average, Revenue, Growth. This template is free to edit as deemed fit for your organization. Therefore download it now.
-
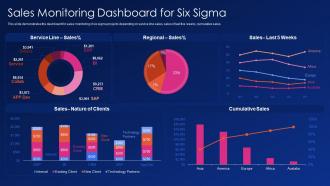 Sales monitoring dashboard for six sigma ppt powerpoint slide portrait
This slide demonstrates the dashboard for sales monitoring of six sigma projects depending on service line sales, sales of last five weeks, cumulative sales. Deliver an outstanding presentation on the topic using this Sales Monitoring Dashboard For Six Sigma Ppt Powerpoint Slide Portrait. Dispense information and present a thorough explanation of Service, Sales using the slides given. This template can be altered and personalized to fit your needs. It is also available for immediate download. So grab it now.
-
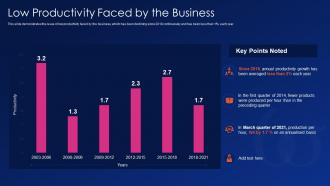 Six sigma it low productivity faced by the business ppt powerpoint visuals
Present the topic in a bit more detail with this Six Sigma It Low Productivity Faced By The Business Ppt Powerpoint Visuals. Use it as a tool for discussion and navigation on Productivity, Growth, Averaged. This template is free to edit as deemed fit for your organization. Therefore download it now.
-
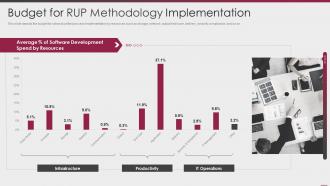 Budget for rup methodology implementation ppt powerpoint templates
This slide depicts the budget for rational unified process implementation by resources such as storage, network, output end user, delivery, security compliance, and so on. Present the topic in a bit more detail with this Budget For RUP Methodology Implementation Ppt Powerpoint Templates. Use it as a tool for discussion and navigation on Infrastructure, Productivity, Resources, Software Development, Average. This template is free to edit as deemed fit for your organization. Therefore download it now.
-
 Cost to fix software problems after deployment ppt powerpoint skills
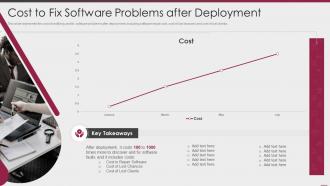
This slide represents the cost of rectifying and fix software problems after deployment, including software repair cost, cost of lost chances and cost of lost clients. Deliver an outstanding presentation on the topic using this Cost To Fix Software Problems After Deployment Ppt Powerpoint Skills. Dispense information and present a thorough explanation of Deployment, Costs using the slides given. This template can be altered and personalized to fit your needs. It is also available for immediate download. So grab it now.
-
 Industries that use rup methodology ppt powerpoint presentation design
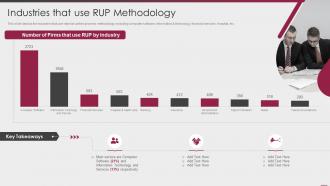
This slide depicts the industries that use rational unified process methodology, including computer software, information and technology, financial services, hospital, etc. Deliver an outstanding presentation on the topic using this Industries That Use RUP Methodology Ppt Powerpoint Presentation Design. Dispense information and present a thorough explanation of Technology, Information, Services using the slides given. This template can be altered and personalized to fit your needs. It is also available for immediate download. So grab it now.
-
 Rup methodology employed companies ppt powerpoint presentation summary
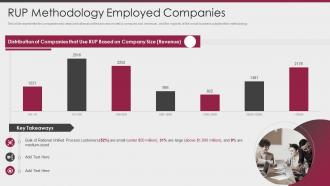
This slide represents the companies who deployed rational unified process model by company size revenue, and the majority of the small business adopted this methodology. Deliver an outstanding presentation on the topic using this RUP Methodology Employed Companies Ppt Powerpoint Presentation Summary. Dispense information and present a thorough explanation of Process Customers, Revenue using the slides given. This template can be altered and personalized to fit your needs. It is also available for immediate download. So grab it now.
-
 Rup methodology software development problems faced by company ppt powerpoint model
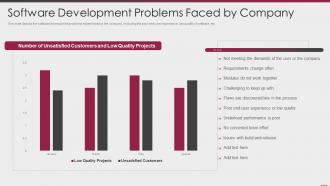
This slide depicts the software development problems experienced by the company, including the poor end user experience, low quality of software, etc. Present the topic in a bit more detail with this RUP Methodology Software Development Problems Faced By Company Ppt Powerpoint Model. Use it as a tool for discussion and navigation on Process, Quality, Team, Requirements. This template is free to edit as deemed fit for your organization. Therefore download it now.
-
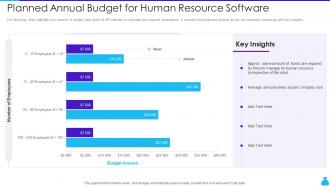 Planned Annual Budget For Human Resource Software
The following slide highlights the amount of budget kept aside of HR software to estimate the required expenditure. It includes the projected amount as per the company size along with key insights. Presenting our well-structured Planned Annual Budget For Human Resource Software. The topics discussed in this slide are Planned Annual Budget For Human Resource Software. This is an instantly available PowerPoint presentation that can be edited conveniently. Download it right away and captivate your audience.
-
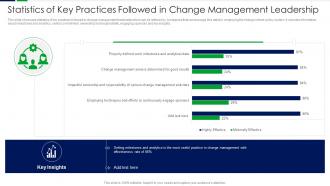 Statistics Of Key Practices Followed In Change Management Leadership
This slide showcase statistics of key practices followed in change management leadership which can be referred by companies that can leverage this data for employing the change in their policy system. It consists information about milestones and analytics, senior commitment, ownership and responsibility, engaging sponsors and key insights. Introducing our Statistics Of Key Practices Followed In Change Management Leadership set of slides. The topics discussed in these slides are Statistics Of Key Practices Followed In Change Management Leadership. This is an immediately available PowerPoint presentation that can be conveniently customized. Download it and convince your audience.
-
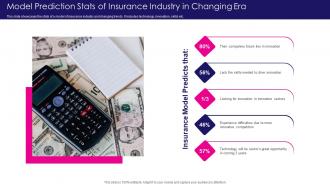 Model Prediction Stats Of Insurance Industry In Changing Era
This slide showcases the stats of a model of insurance industry and changing trends. It includes technology, innovation, skills etc. Presenting our set of slides with name Model Prediction Stats Of Insurance Industry In Changing Era. This exhibits information on five stages of the process. This is an easy-to-edit and innovatively designed PowerPoint template. So download immediately and highlight information on Innovation, Opportunity, Technology.
-
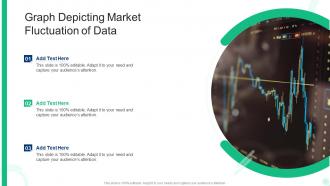 Graph Depicting Market Fluctuation Of Data
Introducing our premium set of slides with Graph Depicting Market Fluctuation Of Data. Elucidate the three stages and present information using this PPT slide. This is a completely adaptable PowerPoint template design that can be used to interpret topics like Graph Depicting Market Fluctuation Of Data. So download instantly and tailor it with your information.
-
 Three Key Sales Statistics To Develop Strategic Plan
This slide shows statistical data essential in organization for sales. It includes sales priorities of business, challenges and channels. Presenting our well-structured Three Key Sales Statistics To Develop Strategic Plan. The topics discussed in this slide are Sales Cycles, Sales Prospecting Challenges, Sales Priorities Business. This is an instantly available PowerPoint presentation that can be edited conveniently. Download it right away and captivate your audience.
-
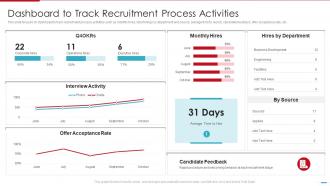 Steps Involved In Employment Process Dashboard To Track Recruitment Process Activities
This slide focuses on dashboard to track recruitment process activities such as monthly hires, total hirings by department and source, average time to recruit, candidate feedback, offer acceptance rate, etc. Deliver an outstanding presentation on the topic using this Steps Involved In Employment Process Dashboard To Track Recruitment Process Activities. Dispense information and present a thorough explanation of Dashboard to Track Recruitment Process Activities using the slides given. This template can be altered and personalized to fit your needs. It is also available for immediate download. So grab it now.
-
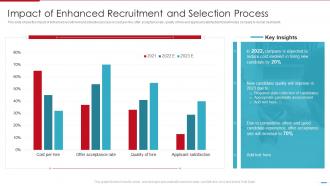 Steps Involved In Employment Process Impact Of Enhanced Recruitment And Selection
This slide shows the impact of enhanced recruitment and selection process on cost per hire, offer acceptance rate, quality of hire and applicant satisfaction that will helps company to recruit best talent. Deliver an outstanding presentation on the topic using this Steps Involved In Employment Process Impact Of Enhanced Recruitment And Selection. Dispense information and present a thorough explanation of Impact of Enhanced Recruitment and Selection Process using the slides given. This template can be altered and personalized to fit your needs. It is also available for immediate download. So grab it now.
-
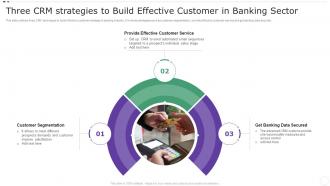 Three CRM Strategies To Build Effective Customer In Banking Sector
This slide outlines three CRM techniques to build effective customer strategy in banking industry. It involves strategies such as customer segmentation, provide effective customer service and get banking data secured. Introducing our premium set of slides with Three CRM Strategies To Build Effective Customer In Banking Sector. Ellicudate the three stages and present information using this PPT slide. This is a completely adaptable PowerPoint template design that can be used to interpret topics like Provide Effective Customer Service, Customer Segmentation, Get Banking Data Secured. So download instantly and tailor it with your information.
-
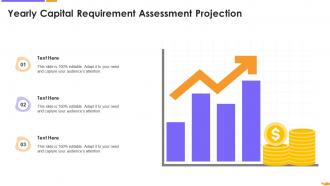 Yearly Capital Requirement Assessment Projection
Introducing our premium set of slides with Yearly Capital Requirement Assessment Projection. Ellicudate the three stages and present information using this PPT slide. This is a completely adaptable PowerPoint template design that can be used to interpret topics like Yearly Capital Requirement Assessment Projection. So download instantly and tailor it with your information.
-
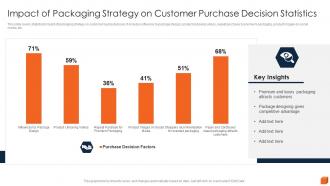 Impact Of Packaging Strategy On Customer Purchase Decision Statistics
This slide covers statistical impact of packaging strategy on customer buying decision. It includes influence by package design, product unboxing videos, repeat purchase by premium packaging, product images on social media, etc. Introducing our Impact Of Packaging Strategy On Customer Purchase Decision Statistics set of slides. The topics discussed in these slides are Attracts Customers, Competitive Advantage, Social Media. This is an immediately available PowerPoint presentation that can be conveniently customized. Download it and convince your audience.
-
 Commercial Insurance Icon For Heavy Equipments
Presenting our set of slides with name Commercial Insurance Icon For Heavy Equipments. This exhibits information on three stages of the process. This is an easy-to-edit and innovatively designed PowerPoint template. So download immediately and highlight information on Commercial Insurance Icon For Heavy Equipments.
-
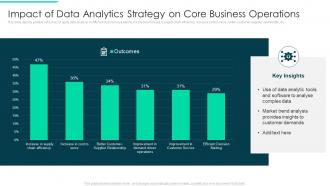 Impact Of Data Analytics Strategy On Core Business Operations
This slide depicts positive outcomes of apply data analysis in different business operations. It includes increase in supply chain efficiency, increase cost to serve, better customer-supplier relationship, etc. Introducing our Impact Of Data Analytics Strategy On Core Business Operations set of slides. The topics discussed in these slides are Customer Demands, Market Trend Analysis, Data Analytic Tools. This is an immediately available PowerPoint presentation that can be conveniently customized. Download it and convince your audience.
-
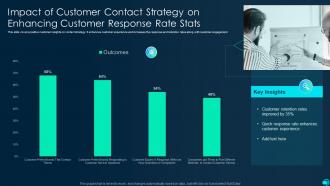 Impact Of Customer Contact Strategy On Enhancing Customer Response Rate Stats
This slide covers positive customer insights on contact strategy. It enhances customer experience and increases the response and retention rates along with customer engagement. Introducing our Impact Of Customer Contact Strategy On Enhancing Customer Response Rate Stats set of slides. The topics discussed in these slides are Customer Retention Rates, Customer Experience. This is an immediately available PowerPoint presentation that can be conveniently customized. Download it and convince your audience.
-
 Current Situation Decrease In Sales Because Of Supplier Problems Procurement Spend Analysis
This template depicts that sales of products decrease due to miscommunication and lack of coordination with suppliers. It also includes monthly sales bar graph for three different products. Present the topic in a bit more detail with this Current Situation Decrease In Sales Because Of Supplier Problems Procurement Spend Analysis. Use it as a tool for discussion and navigation on Current Situation, Decrease In Sales, Supplier Problems. This template is free to edit as deemed fit for your organization. Therefore download it now
-
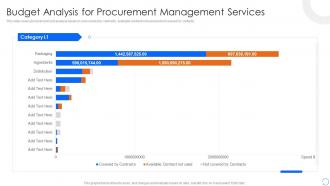 Procurement Spend Analysis Budget Analysis For Procurement Management Services
This slide covers procurement cost analysis based on cost covered by contracts, available contract not used and not covered by contacts. Deliver an outstanding presentation on the topic using this Procurement Spend Analysis Budget Analysis For Procurement Management Services. Dispense information and present a thorough explanation of Budget Analysis, Procurement Management Services using the slides given. This template can be altered and personalized to fit your needs. It is also available for immediate download. So grab it now.
-
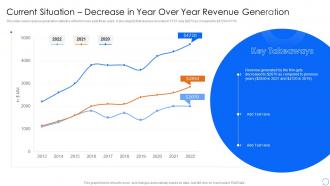 Procurement Spend Analysis Current Situation Decrease In Year Over Year Revenue Generation
This slide covers revenue generation statistics of the firm over past three years. It also depicts that revenue recorded in FY21 was dollar 2070 as compared to dollar 4720 in FY19. Deliver an outstanding presentation on the topic using this Procurement Spend Analysis Current Situation Decrease In Year Over Year Revenue Generation. Dispense information and present a thorough explanation of Revenue Generation using the slides given. This template can be altered and personalized to fit your needs. It is also available for immediate download. So grab it now.
-
 Beginning Work Process Inventory Formula In Powerpoint And Google Slides Cpb
Presenting our Beginning Work Process Inventory Formula In Powerpoint And Google Slides Cpb PowerPoint template design. This PowerPoint slide showcases three stages. It is useful to share insightful information on Beginning Work Process, Inventory Formula This PPT slide can be easily accessed in standard screen and widescreen aspect ratios. It is also available in various formats like PDF, PNG, and JPG. Not only this, the PowerPoint slideshow is completely editable and you can effortlessly modify the font size, font type, and shapes according to your wish. Our PPT layout is compatible with Google Slides as well, so download and edit it as per your knowledge.
-
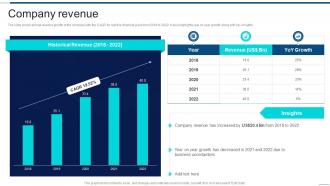 Company Revenue Information Technology Company Profile Ppt Formats
The slide shows annual revenue growth of the company with the CAGR for last five financial years from 2018 to 2022. It also highlights year on year growth along with key insights. Present the topic in a bit more detail with this Company Revenue Information Technology Company Profile Ppt Formats. Use it as a tool for discussion and navigation on Historical Revenue, Growth, Business. This template is free to edit as deemed fit for your organization. Therefore download it now.
-
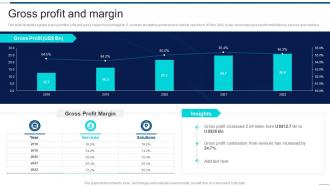 Gross Profit And Margin Information Technology Company Profile Ppt Graphics
This slide illustrates a graph of gross profit in US dollar and gross margin in percentage for IT company illustrating growth trend in last five years from 2018 to 2022. It also showcases gross profit contribution by services and solutions. Present the topic in a bit more detail with this Gross Profit And Margin Information Technology Company Profile Ppt Graphics. Use it as a tool for discussion and navigation on Gross Profit Margin, Gross Profit Contribution, Services. This template is free to edit as deemed fit for your organization. Therefore download it now.
-
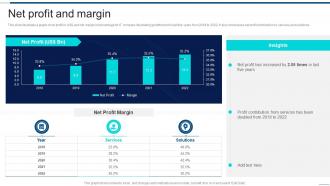 Net Profit And Margin Information Technology Company Profile Ppt Icons
This slide illustrates a graph of net profit in US dollar and net margin in percentage for IT company illustrating growth trend in last five years from 2018 to 2022. It also showcases net profit contribution by services and solutions. Deliver an outstanding presentation on the topic using this Net Profit And Margin Information Technology Company Profile Ppt Icons. Dispense information and present a thorough explanation of Net Profit Margin, Net Profit using the slides given. This template can be altered and personalized to fit your needs. It is also available for immediate download. So grab it now.
-
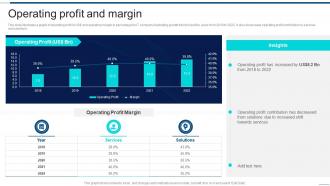 Operating Profit And Margin Information Technology Company Profile Ppt Clipart
This slide illustrates a graph of operating profit in US dollar and operating margin in percentage for IT company illustrating growth trend in last five years from 2018 to 2022. It also showcases operating profit contribution by services and solutions. Present the topic in a bit more detail with this Operating Profit And Margin Information Technology Company Profile Ppt Clipart. Use it as a tool for discussion and navigation on Operating Profit, Operating Profit Margin, Services. This template is free to edit as deemed fit for your organization. Therefore download it now.
-
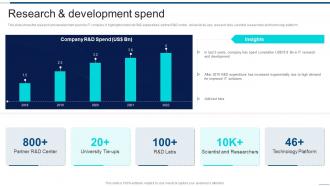 Research And Development Spend Information Technology Company Profile Ppt Structure
This slide shows the research and development spend by IT company. It highlights historical R and D expenditure, partner R and D center, university tie-ups, research labs, scientist, researchers and technology platform. Present the topic in a bit more detail with this Research And Development Spend Information Technology Company Profile Ppt Structure. Use it as a tool for discussion and navigation on Technology Platform, Research And Development, High Demand. This template is free to edit as deemed fit for your organization. Therefore download it now.
-
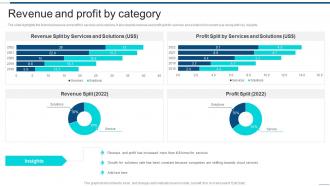 Revenue And Profit By Category Information Technology Company Profile Ppt Slides
The slide highlights the historical revenue and profit for services and solutions. It also depicts revenue and profit split for services and solutions for current year along with key insights. Deliver an outstanding presentation on the topic using this Revenue And Profit By Category Information Technology Company Profile Ppt Slides. Dispense information and present a thorough explanation of Revenue Split, Profit Split, Revenue And Profit using the slides given. This template can be altered and personalized to fit your needs. It is also available for immediate download. So grab it now.
-
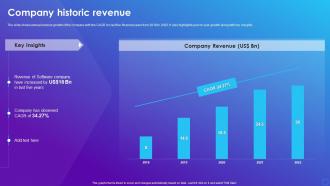 Company Historic Revenue Software Company Profile Ppt Clipart
The slide shows annual revenue growth of the company with the CAGR for last five financial years from 2018 to 2022. It also highlights year on year growth along with key insights. Deliver an outstanding presentation on the topic using this Company Historic Revenue Software Company Profile Ppt Clipart. Dispense information and present a thorough explanation of Company Historic Revenue using the slides given. This template can be altered and personalized to fit your needs. It is also available for immediate download. So grab it now.
-
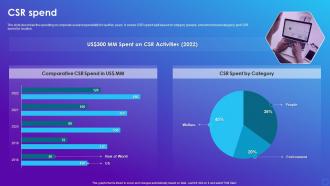 CSR Spend Software Company Profile Ppt Designs
The slide describes the spending on corporate social responsibility for last five years. It shows CSR spend split based on category people, environment and category and CSR spend by location. Deliver an outstanding presentation on the topic using this CSR Spend Software Company Profile Ppt Designs. Dispense information and present a thorough explanation of CSR Spend using the slides given. This template can be altered and personalized to fit your needs. It is also available for immediate download. So grab it now.
-
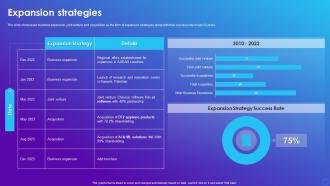 Expansion Strategies Software Company Profile Ppt Diagrams
The slide showcases business expansion, joint venture and acquisition as the form of expansion strategies along with their success rate in last 12 years. Deliver an outstanding presentation on the topic using this Expansion Strategies Software Company Profile Ppt Diagrams. Dispense information and present a thorough explanation of Expansion Strategy, Business Expansion, Acquisition using the slides given. This template can be altered and personalized to fit your needs. It is also available for immediate download. So grab it now.
-
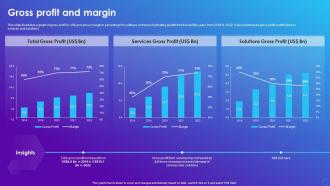 Gross Profit And Margin Software Company Profile Ppt Ideas
This slide illustrates a graph of gross profit in US dollar and gross margin in percentage for software company illustrating growth trend in last five years from 2018 to 2022. It also showcases gross profit contribution by services and solutions. Deliver an outstanding presentation on the topic using this Gross Profit And Margin Software Company Profile Ppt Ideas. Dispense information and present a thorough explanation of Total Gross Profit, Services Gross Profit, Solutions Gross Profit using the slides given. This template can be altered and personalized to fit your needs. It is also available for immediate download. So grab it now.
-
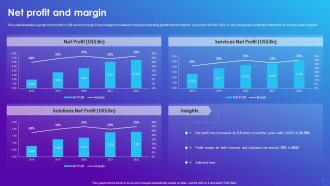 Net Profit And Margin Software Company Profile Ppt Download
This slide illustrates a graph of net profit in US dollar and net margin in percentage for software company illustrating growth trend in last five years from 2018 to 2022. It also showcases net profit contribution by services and solutions. Deliver an outstanding presentation on the topic using this Net Profit And Margin Software Company Profile Ppt Download. Dispense information and present a thorough explanation of Net Profit, Services Net Profit, Solutions Net Profit using the slides given. This template can be altered and personalized to fit your needs. It is also available for immediate download. So grab it now.
-
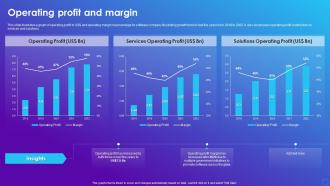 Operating Profit And Margin Software Company Profile Ppt Elements
This slide illustrates a graph of operating profit in US dollar and operating margin in percentage for software company illustrating growth trend in last five years from 2018 to 2022. It also showcases operating profit contribution by services and solutions. Present the topic in a bit more detail with this Operating Profit And Margin Software Company Profile Ppt Elements. Use it as a tool for discussion and navigation on Operating Profit, Services Operating Profit, Solutions Operating Profit. This template is free to edit as deemed fit for your organization. Therefore download it now
-
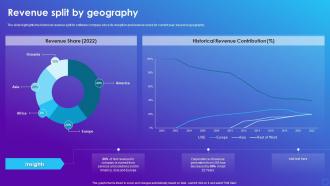 Revenue Split By Geography Software Company Profile Ppt Mockup
The slide highlights the historical revenue split for software company since its inception and revenue share for current year based on geography. Deliver an outstanding presentation on the topic using this Revenue Split By Geography Software Company Profile Ppt Mockup. Dispense information and present a thorough explanation of Revenue Share, Historical Revenue Contribution using the slides given. This template can be altered and personalized to fit your needs. It is also available for immediate download. So grab it now.
-
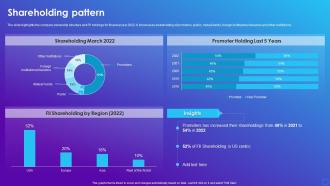 Shareholding Pattern Software Company Profile Ppt Topics
The slide highlights the company ownership structure and FII holdings for financial year 2022. It showcases shareholding of promoters, public, mutual funds, foreign institutional investors and other institutions. Deliver an outstanding presentation on the topic using this Shareholding Pattern Software Company Profile Ppt Topics. Dispense information and present a thorough explanation of Shareholding Pattern using the slides given. This template can be altered and personalized to fit your needs. It is also available for immediate download. So grab it now.
-
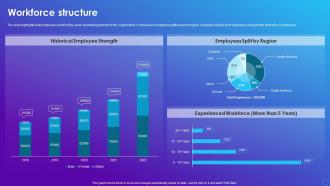 Workforce Structure Software Company Profile Ppt Sample
The slide highlights total employee count for five years illustrating diversity in the organization. It showcases employee split based on region, employee split by work experience and gender diversity of employees. Deliver an outstanding presentation on the topic using this Workforce Structure Software Company Profile Ppt Sample. Dispense information and present a thorough explanation of Historical Employee Strength, Employees Split By Region, Experienced Workforce using the slides given. This template can be altered and personalized to fit your needs. It is also available for immediate download. So grab it now.
-
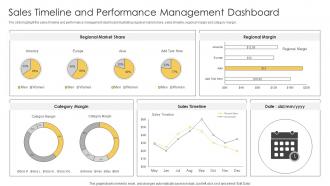 Sales Timeline And Performance Management Dashboard
The slide highlight the sales timeline and performance management dashboard illustrating regional market share, sales timeline, regional margin and category margin. Introducing our Sales Timeline And Performance Management Dashboard set of slides. The topics discussed in these slides are Regional Market Share, Sales Timeline, Regional Margin. This is an immediately available PowerPoint presentation that can be conveniently customized. Download it and convince your audience.
-
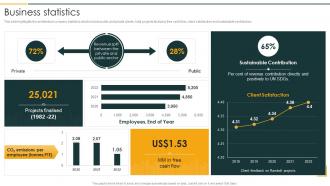 Business Statistics Architecture Company Profile Ppt Guidelines
This slide highlights the architecture company statistics which include public and private clients, total projects finalized, free cash flow, client satisfaction and sustainable contribution. Deliver an outstanding presentation on the topic using this Business Statistics Architecture Company Profile Ppt Guidelines. Dispense information and present a thorough explanation of Sustainable Contribution, Employees, Revenue using the slides given. This template can be altered and personalized to fit your needs. It is also available for immediate download. So grab it now.
-
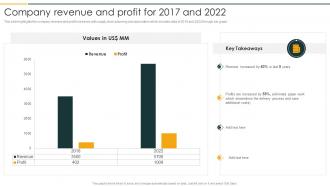 Company Revenue And Profit For 2017 And 2022 Architecture Company Profile
This slide highlights the company revenue and profit increases with supply chain planning and automation which includes data of 2018 and 2022 through bar graph. Present the topic in a bit more detail with this Company Revenue And Profit For 2017 And 2022 Architecture Company Profile. Use it as a tool for discussion and navigation on Revenue, Profit. This template is free to edit as deemed fit for your organization. Therefore download it now
-
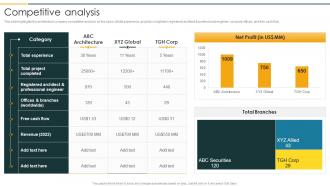 Competitive Analysis Architecture Company Profile Ppt Brochure
This slide highlights the architecture company competitive analysis on the basis of total experience, projects completed, registered architect and professional engineer, company offices, and free cash flow. Deliver an outstanding presentation on the topic using this Competitive Analysis Architecture Company Profile Ppt Brochure. Dispense information and present a thorough explanation of Revenue, Total Experience, Total Project Completed using the slides given. This template can be altered and personalized to fit your needs. It is also available for immediate download. So grab it now.
-
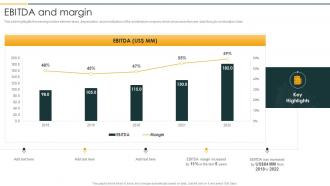 Ebitda And Margin Architecture Company Profile Ppt Inspiration
This slide highlights the earnings before interest, taxes, depreciation, and amortization of the architecture company which showcases five year data through combination chart. Deliver an outstanding presentation on the topic using this Ebitda And Margin Architecture Company Profile Ppt Inspiration. Dispense information and present a thorough explanation of EBITDA And Margin using the slides given. This template can be altered and personalized to fit your needs. It is also available for immediate download. So grab it now.
-
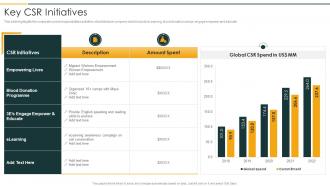 Key CSR Initiatives Architecture Company Profile Ppt Professional
This slide highlights the corporate social responsibilities activities of architecture company which include eLearning, blood donation camps, engage empower and educate. Deliver an outstanding presentation on the topic using this Key CSR Initiatives Architecture Company Profile Ppt Professional. Dispense information and present a thorough explanation of Key CSR Initiatives using the slides given. This template can be altered and personalized to fit your needs. It is also available for immediate download. So grab it now.
-
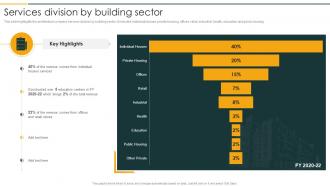 Services Division By Building Sector Architecture Company Profile
This slide highlights the architecture company services division by building sector. It includes individual houses, private housing, offices, retail, industrial, health, education and public housing. Present the topic in a bit more detail with this Services Division By Building Sector Architecture Company Profile. Use it as a tool for discussion and navigation on Services Division By Building Sector. This template is free to edit as deemed fit for your organization. Therefore download it now
-
 Cost Bank Loans In Powerpoint And Google Slides Cpb
Presenting our Cost Bank Loans In Powerpoint And Google Slides Cpb PowerPoint template design. This PowerPoint slide showcases five stages. It is useful to share insightful information on Cost Bank Loans This PPT slide can be easily accessed in standard screen and widescreen aspect ratios. It is also available in various formats like PDF, PNG, and JPG. Not only this, the PowerPoint slideshow is completely editable and you can effortlessly modify the font size, font type, and shapes according to your wish. Our PPT layout is compatible with Google Slides as well, so download and edit it as per your knowledge.
-
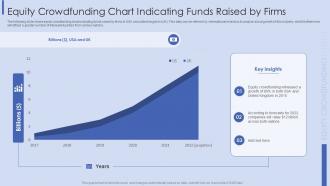 Equity Crowdfunding Chart Indicating Funds Raised By Firms
The following slide shows equity crowdfunding chart indicating funds raised by firms in USA and united kingdom UK. This data can be referred by international investors to analyze about growth of this industry, which furthermore will attract a greater number of interested parties from various nations. Introducing our Equity Crowdfunding Chart Indicating Funds Raised By Firms set of slides. The topics discussed in these slides are Equity Crowdfunding Chart, Indicating Funds Raised By Firms. This is an immediately available PowerPoint presentation that can be conveniently customized. Download it and convince your audience.
-
 Equity Crowdfunding Statistics With Campaigns And Success Rate
This slide illustrates equity crowdfunding statistics with campaigns and success rate which can be referred by investors for gaining the maximum ROI from the most attractive industry. It involves certain industries such as real estate, multimedia, capital goods, logistics, healthcare, retail, software and services, etc. Introducing our Equity Crowdfunding Statistics With Campaigns And Success Rate set of slides. The topics discussed in these slides are Equity Crowdfunding Statistics, Campaigns And Success Rate. This is an immediately available PowerPoint presentation that can be conveniently customized. Download it and convince your audience.
-
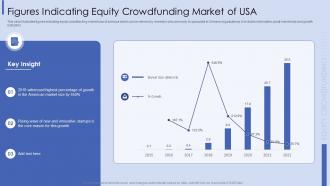 Figures Indicating Equity Crowdfunding Market Of USA
This slide illustrates figures indicating equity crowdfunding market size of america which can be referred by investors who are ready to speculate in Chinese organizations. It includes information about market size and growth indicators. Presenting our well-structured Figures Indicating Equity Crowdfunding Market Of USA. The topics discussed in this slide are Percentage Of Growth, Innovative Startups, Market Size. This is an instantly available PowerPoint presentation that can be edited conveniently. Download it right away and captivate your audience.
-
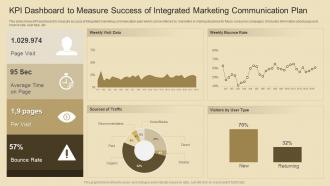 KPI Dashboard To Measure Success Of Integrated Marketing Communication Plan
This slide shows KPI dashboard to measure success of integrated marketing communication plan which can be referred by marketers in making decisions for future consumer campaigns. It includes information about page visit, bounce rate, user type, etc. Introducing our KPI Dashboard To Measure Success Of Integrated Marketing Communication Plan set of slides. The topics discussed in these slides are KPI Dashboard To Measure Success, Integrated Marketing Communication Plan. This is an immediately available PowerPoint presentation that can be conveniently customized. Download it and convince your audience.
-
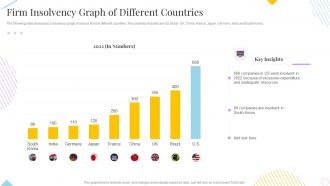 Firm Insolvency Graph Of Different Countries
The following slide showcases a insolvency graph of various firms in different countries. The countries included are US, Brazil, UK, China, France, Japan, Germany, India and South Korea. Introducing our Firm Insolvency Graph Of Different Countries set of slides. The topics discussed in these slides are Excessive Expenditure, Inadequate Resources. This is an immediately available PowerPoint presentation that can be conveniently customized. Download it and convince your audience.
-
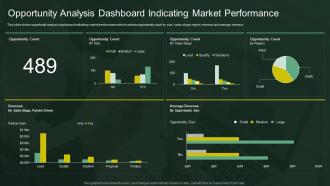 Opportunity Analysis Dashboard Indicating Market Performance
This slide shows opportunity analysis dashboard indicating market performance which contains opportunity count by size, sales stage, region, revenue and average revenue. Introducing our Opportunity Analysis Dashboard Indicating Market Performance set of slides. The topics discussed in these slides are Average Revenue, Opportunity Count, Sales Stage. This is an immediately available PowerPoint presentation that can be conveniently customized. Download it and convince your audience.
-
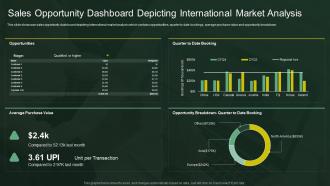 Sales Opportunity Dashboard Depicting International Market Analysis
This slide showcase sales opportunity dashboard depicting international market analysis which contains opportunities, quarter to date bookings, average purchase value and opportunity breakdown. Introducing our Sales Opportunity Dashboard Depicting International Market Analysis set of slides. The topics discussed in these slides are Average Purchase Value, Opportunity Breakdown. This is an immediately available PowerPoint presentation that can be conveniently customized. Download it and convince your audience.
-
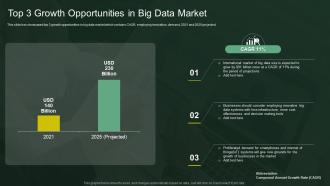 Top 3 Growth Opportunities In Big Data Market
This slide has showcased top 3 growth opportunities in big data market which contains CAGR, employing innovation, demand, 2021 and 2025 projected. Introducing our Top 3 Growth Opportunities In Big Data Market set of slides. The topics discussed in these slides are Decision Making Tools, Growth Of Businesses, International Market Of Big Data. This is an immediately available PowerPoint presentation that can be conveniently customized. Download it and convince your audience.
-
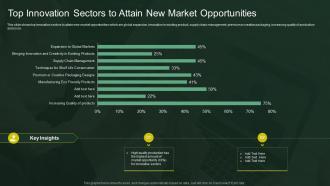 Top Innovation Sectors To Attain New Market Opportunities
This slide shows top innovation sectors to attain new market opportunities which are global expansion, innovation in existing product, supply chain management, premium or creative packaging, increasing quality of production and so on. Presenting our well-structured Top Innovation Sectors To Attain New Market Opportunities. The topics discussed in this slide are Supply Chain Management, Increasing Quality Of Products. This is an instantly available PowerPoint presentation that can be edited conveniently. Download it right away and captivate your audience.
-
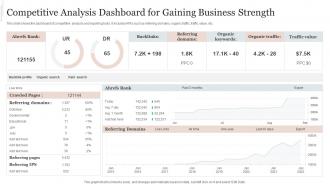 Competitive Analysis Dashboard For Gaining Business Strength
This slide shows the dashboard of competitive analysis and reporting tools. It includes KPIs such as referring domains, organic traffic, traffic value, etc. Introducing our Competitive Analysis Dashboard For Gaining Business Strength set of slides. The topics discussed in these slides are Competitive Analysis Dashboard, Gaining Business Strength. This is an immediately available PowerPoint presentation that can be conveniently customized. Download it and convince your audience.
-
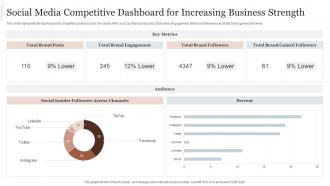 Social Media Competitive Dashboard For Increasing Business Strength
This slide represents the dashboard of competitive analysis tools. It includes KPIs such as total brand posts, total brand engagement, total brand followers and total brand gained followers. Introducing our Social Media Competitive Dashboard For Increasing Business Strength set of slides. The topics discussed in these slides are Social Media, Competitive Dashboard, Increasing Business Strength. This is an immediately available PowerPoint presentation that can be conveniently customized. Download it and convince your audience.
-
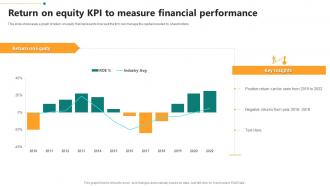 Return On Equity KPI To Measure Financial Performance
This slide showcases a graph of return on equity that represents how well the firm can manage the capital invested by shareholders. Introducing our Return On Equity KPI To Measure Financial Performance set of slides. The topics discussed in these slides are Return On Equity KPI, Measure Financial Performance. This is an immediately available PowerPoint presentation that can be conveniently customized. Download it and convince your audience.


