Financials PowerPoint Templates, Financial Statement PPT Templates
- Sub Categories
-
- 30 60 90 Day Plan
- About Us Company Details
- Action Plan
- Agenda
- Annual Report
- Audit Reports
- Balance Scorecard
- Brand Equity
- Business Case Study
- Business Communication Skills
- Business Plan Development
- Business Problem Solving
- Business Review
- Capital Budgeting
- Career Planning
- Change Management
- Color Palettes
- Communication Process
- Company Location
- Company Vision
- Compare
- Competitive Analysis
- Corporate Governance
- Cost Reduction Strategies
- Custom Business Slides
- Customer Service
- Dashboard
- Data Management
- Decision Making
- Digital Marketing Strategy
- Digital Transformation
- Disaster Management
- Diversity
- Equity Investment
- Financial Analysis
- Financial Services
- Financials
- Growth Hacking Strategy
- Human Resource Management
- Innovation Management
- Interview Process
- Knowledge Management
- Leadership
- Lean Manufacturing
- Legal Law Order
- Management
- Market Segmentation
- Marketing
- Media and Communication
- Meeting Planner
- Mergers and Acquisitions
- Metaverse
- Newspapers
- Operations and Logistics
- Organizational Structure
- Our Goals
- Performance Management
- Pitch Decks
- Pricing Strategies
- Process Management
- Product Development
- Product Launch Ideas
- Product Portfolio
- Project Management
- Purchasing Process
- Quality Assurance
- Quotes and Testimonials
- Real Estate
- Risk Management
- Sales Performance Plan
- Sales Review
- SEO
- Service Offering
- Six Sigma
- Social Media and Network
- Software Development
- Solution Architecture
- Stock Portfolio
- Strategic Management
- Strategic Planning
- Supply Chain Management
- Swimlanes
- System Architecture
- Team Introduction
- Testing and Validation
- Thanks-FAQ
- Time Management
- Timelines Roadmaps
- Value Chain Analysis
- Value Stream Mapping
- Workplace Ethic
-
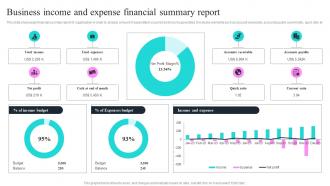 Business Income And Expense Financial Summary Report
This slide showcases financial summary report of organization in order to analyze amount of expenditure occurred and income generated. It includes elements such as account receivable, account payable current ratio, quick ratio etc. Introducing our Business Income And Expense Financial Summary Report set of slides. The topics discussed in these slides are Income, Expenses, Cash. This is an immediately available PowerPoint presentation that can be conveniently customized. Download it and convince your audience.
-
 Customers Willingness To Pay Strategy Icon
Presenting our set of slides with Customers Willingness To Pay Strategy Icon. This exhibits information on Three stages of the process. This is an easy to edit and innovatively designed PowerPoint template. So download immediately and highlight information on Customers Willingness, Pay Strategy Icon.
-
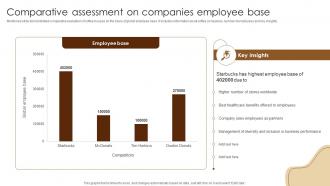 Comparative Assessment On Companies Coffee Business Company Profile CP SS V
Mentioned slide demonstrated comparative evaluation of coffee houses on the basis of global employee base. It includes information about coffee companies, number of employees and key insights. Deliver an outstanding presentation on the topic using this Comparative Assessment On Companies Coffee Business Company Profile CP SS V. Dispense information and present a thorough explanation of Assessment, Employee, Worldwide using the slides given. This template can be altered and personalized to fit your needs. It is also available for immediate download. So grab it now.
-
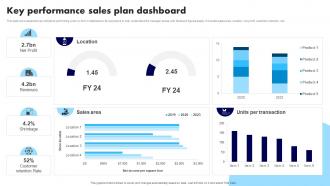 Key Performance Sales Plan Dashboard
This slide showcases the key indicators performing well in a form of dashboard. Its purpose is to help understand the manager areas with facts and figures easily. It includes sales area, location, net profit, customer retention, etc. Introducing our Key Performance Sales Plan Dashboard set of slides. The topics discussed in these slides are Sales Area, Units Per Transaction. This is an immediately available PowerPoint presentation that can be conveniently customized. Download it and convince your audience.
-
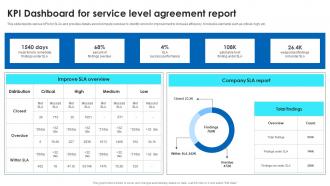 KPI Dashboard For Service Level Agreement Report
This slide depicts various KPIs for SLAs and provides details about company overview to identify errors for improvement to increase efficiency. It includes elements such as critical, high, etc. Introducing our KPI Dashboard For Service Level Agreement Report set of slides. The topics discussed in these slides are Overdue, Improve SLA Overview, Company This is an immediately available PowerPoint presentation that can be conveniently customized. Download it and convince your audience.
-
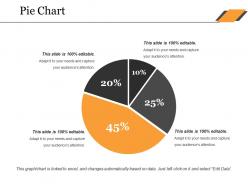 Pie chart ppt microsoft
Presenting Pie Chart PPT Microsoft that has been designed according to your needs and convenience. This template can be saved into various formats like PDF, JPG, and PNG. These PPT slides are completely customizable and editable. You can change the colors, fonts, font size, and font types of the presentation as per your needs. It is also compatible with Google Slides making it an even more suitable option for you. This template also supports the standard (4:3) and widescreen (16:9) sizes.
-
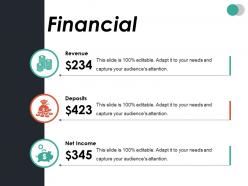 Financial ppt summary professional
Presenting this set of slides with name - Financial Ppt Summary Professional. This is a three stage process. The stages in this process are Finance, Business, Marketing, Strategy, Icons.
-
 Six step agenda
Presenting this set of slides with name - Six Step Agenda. This is a six stage process. The stages in this process are Red Ribbon, Red Banners.
-
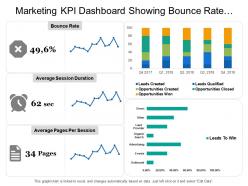 Marketing kpi dashboard showing bounce rate average session duration
Presenting this set of slides with name - Marketing Kpi Dashboard Showing Bounce Rate Average Session Duration. This is a three stage process. The stages in this process are Marketing, Branding, Promoting.
-
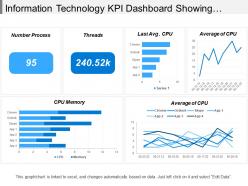 Information technology kpi dashboard showing cpu memory average of cpu
Presenting this set of slides with name - Information Technology Kpi Dashboard Showing Cpu Memory Average Of Cpu. This is a six stage process. The stages in this process are Information Technology, It, Iot.
-
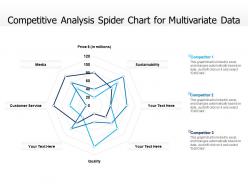 Competitive analysis spider chart for multivariate data
Presenting this set of slides with name Competitive Analysis Spider Chart For Multivariate Data. The topics discussed in these slides are Media, Customer Service, Price Millions, Sustainability, Quality, Competitor. This is a completely editable PowerPoint presentation and is available for immediate download. Download now and impress your audience.
-
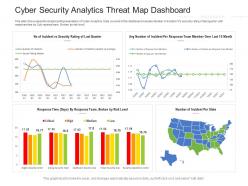 Cyber security analytics threat map dashboard powerpoint template
This slide Showcases the Graphical Representation of Cyber Analytics. Data covered in this dashboard includes Number of incident VS security rating of last quarter with response time by Sub repines team, Broken by risk level. This is a Cyber Security Analytics Threat Map Dashboard Powerpoint Template featuring in built editable components to add your personal touches. Tailor this template as per your liking and display it on a widescreen or standard screen, the choice is yours.
-
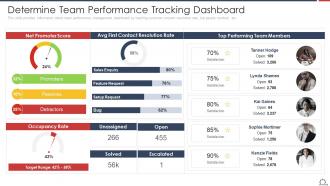 Determine Team Performance Tracking Dashboard Optimize Employee Work Performance
This slide provides information about team performance management dashboard by tracking customer concern resolution rate, top people involved, etc.Deliver an outstanding presentation on the topic using this Determine Team Performance Tracking Dashboard Optimize Employee Work Performance Dispense information and present a thorough explanation of Stakeholder Review Meetings, Steering Group Meetings, Coordination Group Meetings using the slides given. This template can be altered and personalized to fit your needs. It is also available for immediate download. So grab it now.
-
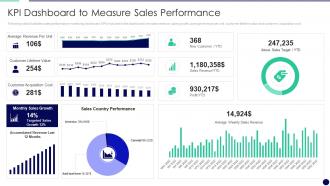 KPI Dashboard To Measure Sales Performance Effectively Managing The Relationship
Following slide illustrates sales performance monitoring dashboard. KPIs included in the dashboard are sales revenue, sales growth, average revenue per unit, customer lifetime value and customer acquisition cost. Deliver an outstanding presentation on the topic using this KPI Dashboard To Measure Sales Performance Effectively Managing The Relationship. Dispense information and present a thorough explanation of KPI Dashboard To Measure Sales Performance using the slides given. This template can be altered and personalized to fit your needs. It is also available for immediate download. So grab it now.
-
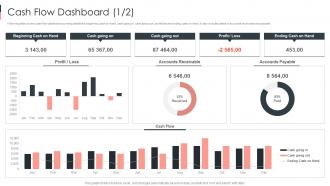 Cash Flow Dashboard Business Sustainability Performance Indicators
Following slide covers cash flow dashboard covering details like beginning cash on hand, cash going in, cash going out, profit or loss and ending cash on hand. It also includes detail of accounts receivable and payable. Present the topic in a bit more detail with this Cash Flow Dashboard Business Sustainability Performance Indicators. Use it as a tool for discussion and navigation on Dashboard, Accounts Payable, Receivable. This template is free to edit as deemed fit for your organization. Therefore download it now.
-
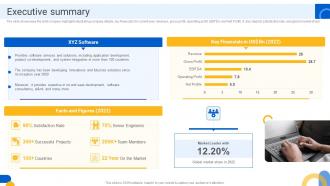 Executive Summary Software And Application Development Company Profile
The slide showcases the brief company highlights illustrating company details, key financials for current year revenue, gross profit, operating profit, EBITDA and Net Profit. It also depicts satisfaction rate, and global market share. Present the topic in a bit more detail with this Executive Summary Software And Application Development Company Profile. Use it as a tool for discussion and navigation on Satisfaction Rate, Successful Projects, Team Members, Senior Engineers. This template is free to edit as deemed fit for your organization. Therefore download it now.
-
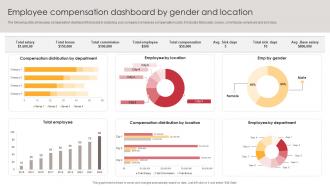 Employee Compensation Dashboard By Gender And Location
The following slide showcases compensation dashboard that assist in analyzing your companys employee compensation costs. It includes total salary, bonus, commission, employee and sick days. Presenting our well structured Employee Compensation Dashboard By Gender And Location. The topics discussed in this slide are Compensation Distribution, Compensation Dashboard, Gender And Location. This is an instantly available PowerPoint presentation that can be edited conveniently. Download it right away and captivate your audience.
-
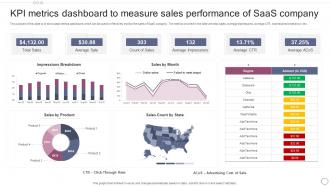 KPI Metrics Dashboard To Measure Sales Performance Of SAAS Company
The purpose of this slide is to showcase metrics dashboard which can be used to effectively monitor the sales of SaaS company. The metrics covered in the slide are total sales, average impressions, average CTR, impressions breakdown, etc. Presenting our well structured KPI Metrics Dashboard To Measure Sales Performance Of SAAS Company. The topics discussed in this slide are Impressions Breakdown, Sales, Sales By Product. This is an instantly available PowerPoint presentation that can be edited conveniently. Download it right away and captivate your audience.
-
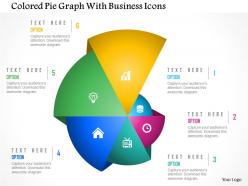 Colored pie graph with business icons powerpoint template
We are proud to present our colored pie graph with business icons powerpoint template. Graphic of colored pie graph and icons has been used to craft this PPT diagram. This PPT diagram contains the concept of business informationand result analysis . Use this PPT diagram for business and marketing presentations.
-
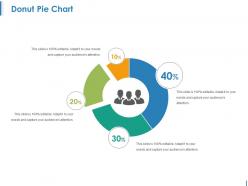 Donut pie chart ppt examples
Presenting this set of slides with name - Donut Pie Chart Ppt Examples. This is a four stage process. The stages in this process are Donut Pie Chart, Finance, Marketing, Strategy, Analysis.
-
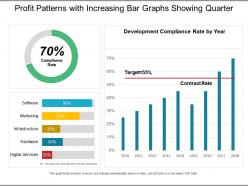 Profit patterns with increasing bar graphs showing quarter
Presenting this set of slides with name - Profit Patterns With Increasing Bar Graphs Showing Quarter. This is a three stage process. The stages in this process are Engineering, Procurement And Construction, Construction Management, Engineering, Purchasing And Construction .
-
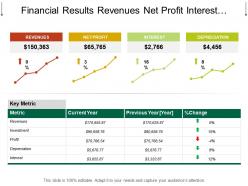 Financial results revenues net profit interest depreciation
Presenting, Financial Results Revenues Net Profit Interest Depreciation PowerPoint template. This presentation slide is beneficial for managers, employees, accountant, CA, finance manager, and organizations looking to project their business process through a flow chart. This presentation template is hundred percent editable, which means you can change the text, color, and view of the given template according to your desire. You can choose icons among the thousands of options accessible. This presentation slide is compatible with Google Slides. Ease of download and convert into jpeg or pdf format.
-
 Financing Instruments Powerpoint Presentation Slides
Presenting this set of slides with name - Financing Instruments Powerpoint Presentation Slides. This deck comprises of a total of thirty-five slides. It has PPT templates with creative visuals and well-researched content. Not just this, our PowerPoint professionals have crafted this deck with appropriate diagrams, layouts, icons, graphs, charts and more. This content ready presentation deck is fully editable. You can also modify the content as per your need. Download PowerPoint templates in both widescreen and standard screen. The presentation is fully supported by Google Slides. It can be easily converted into JPG or PDF format.
-
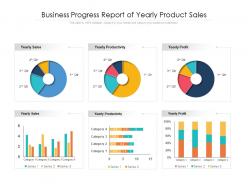 Business progress report of yearly product sales
Presenting this set of slides with name Business Progress Report Of Yearly Product Sales. The topics discussed in these slides are Yearly Sales, Yearly Productivity, Yearly Profit. This is a completely editable PowerPoint presentation and is available for immediate download. Download now and impress your audience.
-
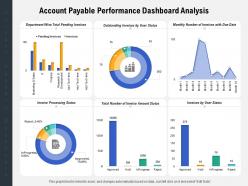 Account payable performance dashboard analysis
Presenting this set of slides with name Account Payable Performance Dashboard Analysis. The topics discussed in these slides are Processing, Sales, Marketing. This is a completely editable PowerPoint presentation and is available for immediate download. Download now and impress your audience.
-
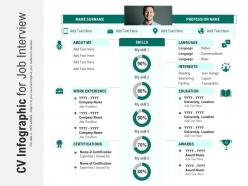 Cv infographic for job interview
Presenting our well structured CV Infographic For Job Interview. The topics discussed in this slide are Work Experience, Education, Interests, Language, Awards, Certifications. This is an instantly available PowerPoint presentation that can be edited conveniently. Download it right away and captivate your audience.
-
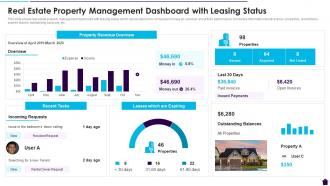 Real Estate Property Management Dashboard With Leasing Status
Introducing our Real Estate Property Management Dashboard With Leasing Status set of slides. The topics discussed in these slides are Real Estate Property Management Dashboard With Leasing Status. This is an immediately available PowerPoint presentation that can be conveniently customized. Download it and convince your audience.
-
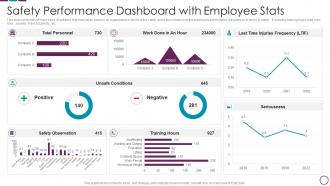 Safety Performance Dashboard With Employee Stats
This slide comprises of many types of activities that have taken place in an organization in terms of the safety and it also shows how the employees performance are going on in terms of safety . It includes training hours, total man-hour , severity of the accidents , etc. Presenting our well-structured Safety Performance Dashboard With Employee Stats. The topics discussed in this slide are Safety Performance Dashboard With Employee Stats. This is an instantly available PowerPoint presentation that can be edited conveniently. Download it right away and captivate your audience.
-
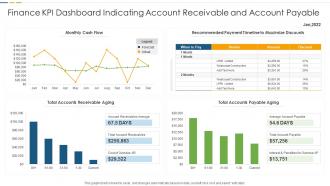 Finance KPI Dashboard Indicating Account Receivable And Account Payable
Introducing our Finance KPI Dashboard Indicating Account Receivable And Account Payable set of slides. The topics discussed in these slides are Monthly Cash Flow, Payment Timeline, Accounts Payable. This is an immediately available PowerPoint presentation that can be conveniently customized. Download it and convince your audience.
-
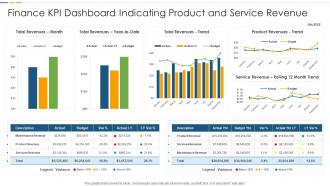 Finance KPI Dashboard Indicating Product And Service Revenue
Introducing our Finance KPI Dashboard Indicating Product And Service Revenue set of slides. The topics discussed in these slides are Finance KPI Dashboard Indicating Product And Service Revenue. This is an immediately available PowerPoint presentation that can be conveniently customized. Download it and convince your audience.
-
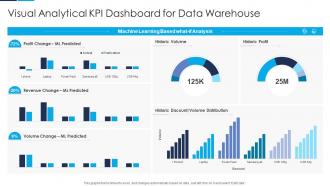 Visual Analytical KPI Dashboard Snapshot For Data Warehouse
Presenting our well structured Visual Analytical KPI Dashboard Snapshot For Data Warehouse. The topics discussed in this slide are Profit, Revenue Change, Analysis. This is an instantly available PowerPoint presentation that can be edited conveniently. Download it right away and captivate your audience.
-
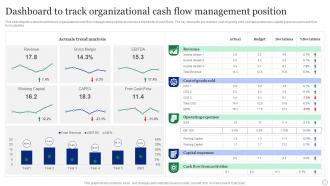 Dashboard To Track Organizational Cash Flow Management Position
This slide depicts a dashboard to track organizational cash flow management position and analyse the trends of cash flows. The key elements are revenue, cost of goods sold, operating expenses, capital expenses and cash flow from activities. Introducing our Dashboard To Track Organizational Cash Flow Management Position set of slides. The topics discussed in these slides are Actuals Trend Analysis, Organizational, Management Position. This is an immediately available PowerPoint presentation that can be conveniently customized. Download it and convince your audience.
-
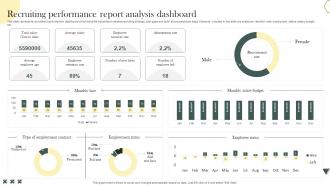 Recruiting Performance Report Analysis Dashboard
This slide represents recruitment and retention dashboard which benefits industries to assess recruiting strategy, plan gaps and build strong employee base. Elements included in this slide are employee retention rate, employment status, salary budget, etc. Presenting our well structured Recruiting Performance Report Analysis Dashboard. The topics discussed in this slide are Total Salary, Average Salary, Absenteeism Rate. This is an instantly available PowerPoint presentation that can be edited conveniently. Download it right away and captivate your audience.
-
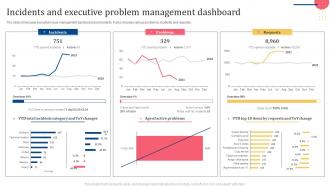 Incidents And Executive Problem Management Dashboard
The slide showcases executive issue management dashboard and incidents. It also includes various problems, incidents and requests. Introducing our Incidents And Executive Problem Management Dashboard set of slides. The topics discussed in these slides are Incidents, Problems, Requests. This is an immediately available PowerPoint presentation that can be conveniently customized. Download it and convince your audience.
-
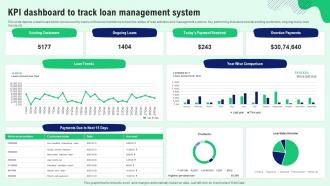 KPI Dashboard To Track Loan Management System
This slide depicts a dashboard which can be used by banks or financial institutions to track the status of loan activities and management systems. Key performing indicators include existing customers, ongoing loans, loan trends etc. Introducing our KPI Dashboard To Track Loan Management System set of slides. The topics discussed in these slides are Existing Customers, Ongoing Loans, Payment Received. This is an immediately available PowerPoint presentation that can be conveniently customized. Download it and convince your audience.
-
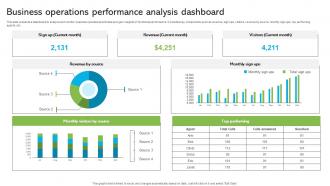 Business Operations Performance Analysis Dashboard
This slide presents a dashboard to analyze and monitor business operational activities and gain insights of functional performance. It includes key components such as revenue, sigh ups, visitors, revenue by source, monthly sign ups, top performing agents, etc. Introducing our Business Operations Performance Analysis Dashboard set of slides. The topics discussed in these slides are Monthly Visitors, Top Performing, Support Agents. This is an immediately available PowerPoint presentation that can be conveniently customized. Download it and convince your audience.
-
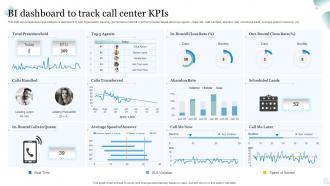 BI Dashboard To Track Call Center KPIS
This slide showcases business intelligence dashboard to help organization track key performance metrics. It further includes details about top agents, close rate, calls handled, abandon rate, scheduled leads, average speed of answer, etc. Presenting our well structured BI Dashboard To Track Call Center KPIS. The topics discussed in this slide are Abandon Rate, Calls Transferred, Premium Sold. This is an instantly available PowerPoint presentation that can be edited conveniently. Download it right away and captivate your audience.
-
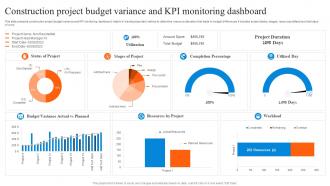 Construction Project Budget Variance And Kpi Monitoring Dashboard
This slide presents construction project budget variance and KPI monitoring dashboard, helpful in tracking important metrics to determine resource allocation that leads to budget differences. It includes project status, stages, resources utilised and total days of work. Presenting our well structured Construction Project Budget Variance And Kpi Monitoring Dashboard. The topics discussed in this slide are Construction Project, Budget Variance. This is an instantly available PowerPoint presentation that can be edited conveniently. Download it right away and captivate your audience.
-
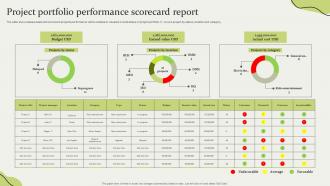 Project Portfolio Performance Scorecard Report
The slide showcaseses a balanced scorecard projects performance which enables to visualize overall status of project portfolio. It covers project by status, location abd category. presenting our well structured project portfolio performance scorecard report. the topics discussed in this slide are budget, earned value, actual cost. this is an instantly available powerpoint presentation that can be edited conveniently. download it right away and captivate your audience.
-
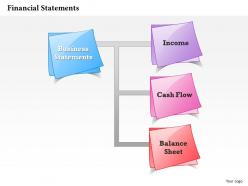 0314 financial statements of cash flow
Slide runs smoothly on all related software. PPT slides can be deployed in a simple and direct manner. More customization options by affixing your company’s logo, trademark. No space constraints while adding elements. PPT graphics don’t pixelate when projected on widescreen. Changeable layout including font, text, color and design. Append title and sub-title at will. Compatible with Google slides for better shared information distribution.
-
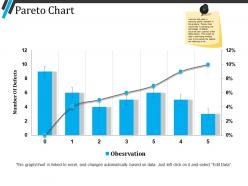 Pareto chart powerpoint templates
Presenting pareto chart powerpoint templates. This is a pareto chart powerpoint templates. This is a seven stage process. The stages in this process are pareto chart, business, growth, finance, analysis.
-
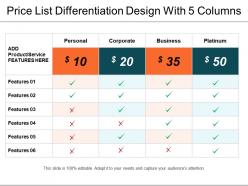 Price list differentiation design with 5 columns
Presenting price list differentiation design with 5 columns. This is a price list differentiation design with 5 columns. This is a four stage process. The stages in this process are price list table with 4 boxes, price list differentiation design with 5 columns, price list diversification table with 4 columns, service price list with service type and 4 columns.
-
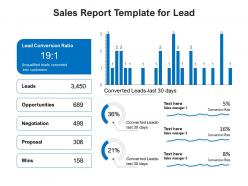 Sales report template for lead
Presenting this set of slides with name Sales Report Template For Lead. The topics discussed in these slides are Opportunities, Negotiation, Proposal. This is a completely editable PowerPoint presentation and is available for immediate download. Download now and impress your audience.
-
 Portfolio dashboard for project management and tracking
Introducing our Portfolio Dashboard For Project Management And Tracking set of slides. The topics discussed in these slides are Portfolio Financial, Planned Cost, Projects. This is an immediately available PowerPoint presentation that can be conveniently customized. Download it and convince your audience.
-
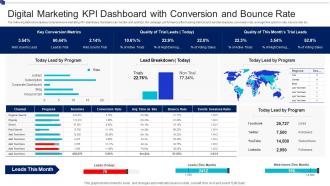 Digital Marketing KPI Dashboard With Conversion And Bounce Rate
The following slide showcases a comprehensive marketing KPI dashboard. Marketers can monitor and optimize the campaign performance after tracking metrics such as total sessions, conversion rate, average time spent on site, bounce rate etc. Presenting our well structured Digital Marketing KPI Dashboard With Conversion And Bounce Rate. The topics discussed in this slide are Today Lead By Program, Lead Breakdown, Today Lead By Program. This is an instantly available PowerPoint presentation that can be edited conveniently. Download it right away and captivate your audience.
-
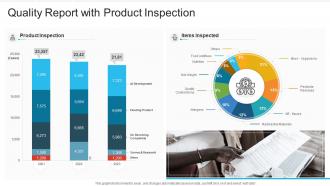 Quality Report With Product Inspection
This graph or chart is linked to excel, and changes automatically based on data. Just left click on it and select edit data. Introducing our Quality Report With Product Inspection set of slides. The topics discussed in these slides are Product Inspection, Items Inspected, Food Additives, Micro Organisms, Pesticide Residues, Radioactive Materials. This is an immediately available PowerPoint presentation that can be conveniently customized. Download it and convince your audience.
-
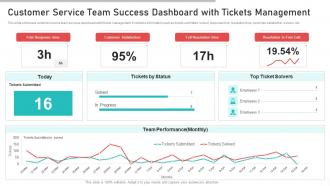 Customer Service Team Success Dashboard With Tickets Management
This slide showcase customer service team success dashboard with tickets management. It contains information such as tickets submitted, solved, response time, resolution time, customer satisfaction, solvers, etc. Introducing our Customer Service Team Success Dashboard With Tickets Management set of slides. The topics discussed in these slides are Customer Satisfaction, Full Resolution Time, Resolution In First Call. This is an immediately available PowerPoint presentation that can be conveniently customized. Download it and convince your audience.
-
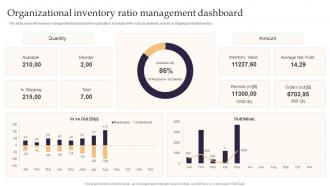 Organizational Inventory Ratio Management Dashboard
This slide shows the inventory management dashboard of an organization. It includes KPIs such as available, reorder, in shipping and total inventory. Introducing our Organizational Inventory Ratio Management Dashboard set of slides. The topics discussed in these slides are Organizational, Inventory, Ratio Management, Dashboard. This is an immediately available PowerPoint presentation that can be conveniently customized. Download it and convince your audience.
-
 Cost Management Dashboard Snapshot Cloud Complexity Challenges And Solution
This slide covers dashboard platform for the resource organization, resource security, auditing, and cost. It also includes reporting, dashboards, budgets, optimizations, etc. Deliver an outstanding presentation on the topic using this Cost Management Dashboard Cloud Complexity Challenges And Solution. Dispense information and present a thorough explanation of Entity Summary, Potential Savings, Cost By Service using the slides given. This template can be altered and personalized to fit your needs. It is also available for immediate download. So grab it now.
-
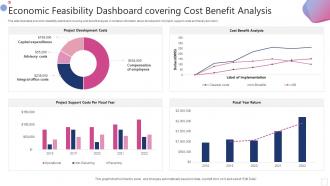 Economic Feasibility Dashboard Covering Cost Benefit Analysis
This slide illustrates economic feasibility dashboard covering cost benefit analysis. It contains information about development of project, support costs and fiscal year return. Presenting our well structured Economic Feasibility Dashboard Covering Cost Benefit Analysis. The topics discussed in this slide are Economic, Feasibility, Dashboard. This is an instantly available PowerPoint presentation that can be edited conveniently. Download it right away and captivate your audience.
-
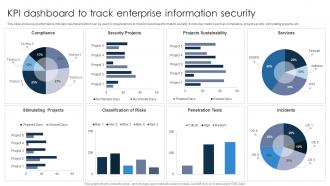 KPI Dashboard Snapshot To Track Enterprise Information Security
This slide shows key performance indicator dashboard which can be used by organizations to monitor business information security. It includes metrics such as compliance, project security, stimulating projects, etc. Presenting our well structured KPI Dashboard Snapshot To Track Enterprise Information Security. The topics discussed in this slide are Security Projects, Projects Sustainability, Compliance. This is an instantly available PowerPoint presentation that can be edited conveniently. Download it right away and captivate your audience.
-
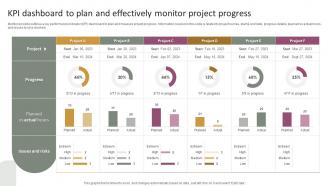 KPI Dashboard To Plan And Effectively Monitor Project Progress
Mentioned slide outlines a key performance indicator KPI dashboard to plan and measure project progress. Information covered in this slide is related to project names, start and end date, progress details, planned vs actual hours, and issues and risks involved. Introducing our KPI Dashboard To Plan And Effectively Monitor Project Progress set of slides. The topics discussed in these slides are KPI Dashboard To Plan, Effectively Monitor, Project Progress. This is an immediately available PowerPoint presentation that can be conveniently customized. Download it and convince your audience.
-
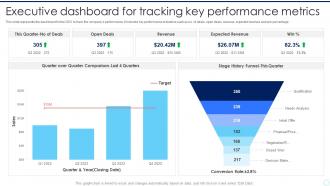 Executive Dashboard For Tracking Key Performance Metrics
This slide represents the dashboard for the CEO to track the companys performance. It includes key performance indicators such as no. of deals, open deals, revenue, expected revenue and win percentage. Presenting our well structured Executive Dashboard For Tracking Key Performance Metrics. The topics discussed in this slide are Open Deals, Revenue, Expected Revenue, Performance Metrics. This is an instantly available PowerPoint presentation that can be edited conveniently. Download it right away and captivate your audience.
-
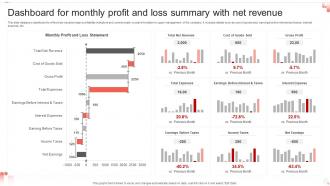 Dashboard For Monthly Profit And Loss Summary With Net Revenue
This slide displays a dashboard to effectively visualize major profitability indicators and communicate crucial information to upper management of the company. It includes details such as cost of goods sold, earnings before interest and taxes, interest expense, etc. Presenting our well structured Dashboard For Monthly Profit And Loss Summary With Net Revenue. The topics discussed in this slide are Profit, Loss Statement, Gross Profit. This is an instantly available PowerPoint presentation that can be edited conveniently. Download it right away and captivate your audience.
-
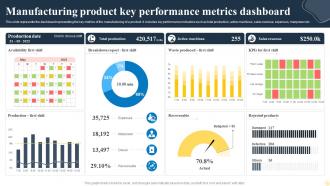 Manufacturing Product Key Performance Metrics Dashboard
This slide represents the dashboard representing the key metrics of the manufacturing of a product. It includes key performance indicators such as total production, active machines, sales revenue, expenses, manpower etc. Presenting our well structured Manufacturing Product Key Performance Metrics Dashboard. The topics discussed in this slide are Manufacturing Product, Performance Metrics Dashboard. This is an instantly available PowerPoint presentation that can be edited conveniently. Download it right away and captivate your audience.
-
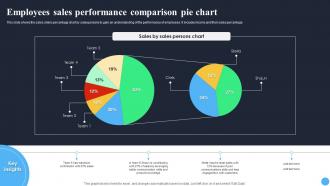 Employees Sales Performance Comparison Pie Chart
This slide shows the sales share percentage chart by salespersons to gain an understanding of the performance of employees. It includes teams and their sales percentage. Presenting our well structured Employees Sales Performance Comparison Pie Chart. The topics discussed in this slide are Sales By Sales, Persons Chart, Pie Chart. This is an instantly available PowerPoint presentation that can be edited conveniently. Download it right away and captivate your audience.
-
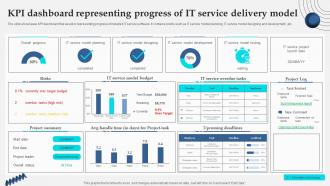 Kpi Dashboard Representing Progress Of It Service Delivery Model
The slide showcases KPI dashboard that assist in representing progress of installed IT service software. It contains points such as IT service model planning, IT service model designing and development, etc. Presenting our well structured Kpi Dashboard Representing Progress Of It Service Delivery Model. The topics discussed in this slide are Currently Over Target Budget, Overdue Tasks.This is an instantly available PowerPoint presentation that can be edited conveniently. Download it right away and captivate your audience.
-
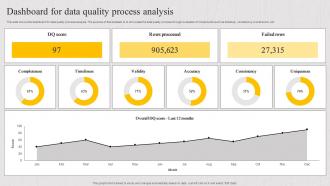 Dashboard For Data Quality Process Analysis
This slide shows the dashboard for data quality process analysis. The purpose of this template is to showcase the data quality process through evaluation of components such as timelines, consistency overall score, etc. Presenting our well structured Dashboard For Data Quality Process Analysis. The topics discussed in this slide are Completeness, Timeliness, Validity, Accuracy, Consistency. This is an instantly available PowerPoint presentation that can be edited conveniently. Download it right away and captivate your audience.
-
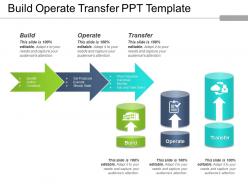 Build operate transfer ppt template
Presenting build, operate and transfer PPT template. The slide is 100% editable. You can modify the text, color, font as per the requirements. The slide is fully compatible with Google Slide. This slide can be viewed both in standard screen size and widescreen size because of its high resolution. The number of fields can be added or deleted as per your requirements. The PPT template can be saved in any format like PDF, JPEG, and PNG.
-
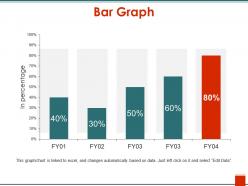 Bar graph powerpoint ideas
Presenting the Bar Graph PowerPoint Ideas template. The template is fully editable in MS PowerPoint and other similar software. Modify the font type, size, diagram color, background color, etc. according to your needs. The slide is also compatible with Google Slides and can be saved in numerous images or document formats such as JPG or PDF. High-quality graphics ensure that pixelation does not arise.


