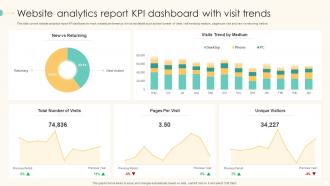
Financials PowerPoint Templates, Financial Statement PPT Templates
- Sub Categories
-
- 30 60 90 Day Plan
- About Us Company Details
- Action Plan
- Agenda
- Annual Report
- Audit Reports
- Balance Scorecard
- Brand Equity
- Business Case Study
- Business Communication Skills
- Business Plan Development
- Business Problem Solving
- Business Review
- Capital Budgeting
- Career Planning
- Change Management
- Color Palettes
- Communication Process
- Company Location
- Company Vision
- Compare
- Competitive Analysis
- Corporate Governance
- Cost Reduction Strategies
- Custom Business Slides
- Customer Service
- Dashboard
- Data Management
- Decision Making
- Digital Marketing Strategy
- Digital Transformation
- Disaster Management
- Diversity
- Equity Investment
- Financial Analysis
- Financial Services
- Financials
- Growth Hacking Strategy
- Human Resource Management
- Innovation Management
- Interview Process
- Knowledge Management
- Leadership
- Lean Manufacturing
- Legal Law Order
- Management
- Market Segmentation
- Marketing
- Media and Communication
- Meeting Planner
- Mergers and Acquisitions
- Metaverse
- Newspapers
- Operations and Logistics
- Organizational Structure
- Our Goals
- Performance Management
- Pitch Decks
- Pricing Strategies
- Process Management
- Product Development
- Product Launch Ideas
- Product Portfolio
- Project Management
- Purchasing Process
- Quality Assurance
- Quotes and Testimonials
- Real Estate
- Risk Management
- Sales Performance Plan
- Sales Review
- SEO
- Service Offering
- Six Sigma
- Social Media and Network
- Software Development
- Solution Architecture
- Stock Portfolio
- Strategic Management
- Strategic Planning
- Supply Chain Management
- Swimlanes
- System Architecture
- Team Introduction
- Testing and Validation
- Thanks-FAQ
- Time Management
- Timelines Roadmaps
- Value Chain Analysis
- Value Stream Mapping
- Workplace Ethic
-
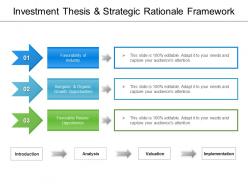 Investment thesis and strategic rationale framework
Presenting investment thesis and strategic rationale framework. This is a investment thesis and strategic rationale framework. This is a three stage process. The stages in this process are investment thesis, investment strategy, investment objectives.
-
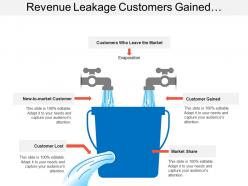 Revenue leakage customers gained lost market share
Presenting this set of slides with name - Revenue Leakage Customers Gained Lost Market Share. This is a two stage process. The stages in this process are Revenue Leakage, Capital Leakage, Income Leakage.
-
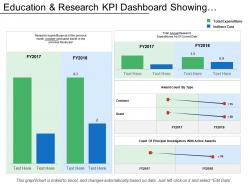 Education and research kpi dashboard showing research expenditure
Presenting education and research KPI dashboard showing research expenditure PPT slide. The expenditure on research and development presentation slide designed by the professional team of SlideTeam. The research expenditure PPT template is fully editable in PowerPoint. The research and development expenditure PowerPoint template is compatible with Google Slide so a user can share this dashboard slide with others. A user can make changes in the font size, font type, color as well as dimensions of the research expenditure PPT template as per the requirement. You may edit the value in the expense research and development presentation slide as the slide gets linked with the Excel sheet.
-
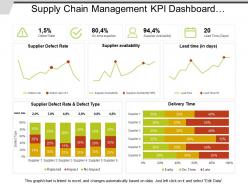 Supply chain management kpi dashboard showing defect rate and delivery time
Presenting this set of slides with name - Supply Chain Management Kpi Dashboard Showing Defect Rate And Delivery Time. This is a three stage process. The stages in this process are Demand Forecasting, Predicting Future Demand, Supply Chain Management.
-
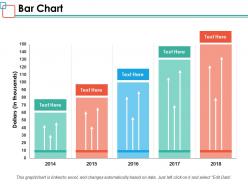 Bar chart ppt powerpoint presentation inspiration images
Presenting this set of slides with name - Bar Chart Ppt Powerpoint Presentation Inspiration Images. This is a five stage process. The stages in this process are Business, Management, Strategy, Analysis, Marketing.
-
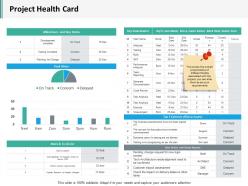 Project health card slide2 ppt infographics structure
Presenting this set of slides with name - Project Health Card Slide2 Ppt Infographics Structure. This is a two stage process. The stages in this process are Business, Management, Strategy, Analysis, Marketing.
-
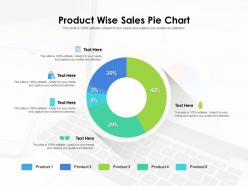 Product wise sales pie chart
Presenting this set of slides with name Product Wise Sales Pie Chart. The topics discussed in these slide is Product Wise Sales Pie Chart. This is a completely editable PowerPoint presentation and is available for immediate download. Download now and impress your audience.
-
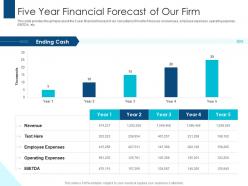 Five year financial forecast of our firm pitching for consulting services ppt icon good
This slide provides the glimpse about the 5 year financial forecast of our consultancy firm which focuses on revenues, employee expenses, operating expense, EBITDA, etc. Deliver an outstanding presentation on the topic using this Five Year Financial Forecast Of Our Firm Pitching For Consulting Services Ppt Icon Good. Dispense information and present a thorough explanation of Revenue, Employee Expenses, Operating Expenses using the slides given. This template can be altered and personalized to fit your needs. It is also available for immediate download. So grab it now.
-
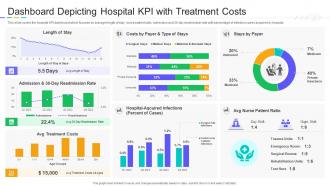 Dashboard Depicting Hospital KPI With Treatment Costs
This slide covers the hospital KPI dashboard which focuses on average length of stay, nurse patient ratio, admission and 30 day readmission rate with percentage of infection cases acquired by hospital. Introducing our Dashboard Depicting Hospital KPI With Treatment Costs set of slides. The topics discussed in these slides are Length Of Stay, Stays By Payer, Admission AND 30 Day Readmission Rate, Avg Nurse Patient Ratio. This is an immediately available PowerPoint presentation that can be conveniently customized. Download it and convince your audience.
-
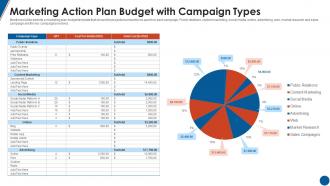 Marketing Action Plan Budget With Campaign Types
Mentioned slide exhibits a marketing plan budget template that shows the projected amount to be spent on each campaign. Public relations, content marketing, social media, online, advertising, web, market research and sales campaign are the key campaigns involved. Introducing our Marketing Action Plan Budget With Campaign Types set of slides. The topics discussed in these slides are Marketing Action Plan Budget With Campaign Types. This is an immediately available PowerPoint presentation that can be conveniently customized. Download it and convince your audience.
-
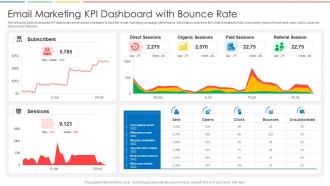 Email Marketing Kpi Dashboard With Bounce Rate
The following slide showcases KPI dashboard which allows marketers to track the email marketing campaign performance. Information covered in this slide is related to total subscribers, types of email sent, open, clicks, bounces and unsubscribed etc. Introducing our Email Marketing KPI Dashboard With Bounce Rate set of slides. The topics discussed in these slides are Direct Sessions, Organic Sessions, Paid Sessions, Referral Session. This is an immediately available PowerPoint presentation that can be conveniently customized. Download it and convince your audience.
-
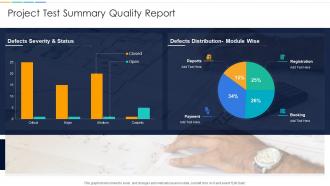 Project Test Summary Quality Report
This graph or chart is linked to excel, and changes automatically based on data. Just left click on it and select Edit Data. Presenting our well structured Project Test Summary Quality Report. The topics discussed in this slide are Defects Severity And Status, Defects Distribution Module Wise, Payment, Booking, Registration, Reports. This is an instantly available PowerPoint presentation that can be edited conveniently. Download it right away and captivate your audience.
-
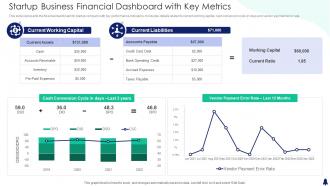 Startup Business Financial Dashboard With Key Metrics
This slide represents the financial dashboard for startup company with key performance indicators. It includes details related to current working capital, cash conversion cycle in days and vendor payment error rate. Introducing our Startup Business Financial Dashboard With Key Metrics set of slides. The topics discussed in these slides are Current Working Capital, Current Liabilities, Working Capital, Cash Conversion. This is an immediately available PowerPoint presentation that can be conveniently customized. Download it and convince your audience.
-
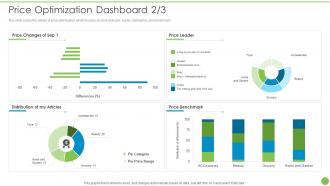 Price Optimization Dashboard Snapshot Pricing Data Analytics Techniques
This slide covers the details of price optimization which focuses on price changes, leader, distribution, and benchmark. Present the topic in a bit more detail with this Price Optimization Dashboard Snapshot Pricing Data Analytics Techniques. Use it as a tool for discussion and navigation on Price Optimization Dashboard Snapshot. This template is free to edit as deemed fit for your organization. Therefore download it now.
-
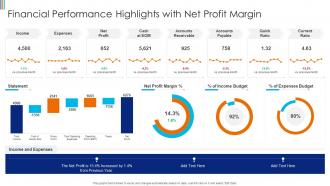 Financial Performance Highlights With Net Profit Margin
Present the topic in a bit more detail with this Financial Performance Highlights With Net Profit Margin. Use it as a tool for discussion and navigation on Net Profit Margin, Income Budget, Expenses Budget. This template is free to edit as deemed fit for your organization. Therefore download it now.
-
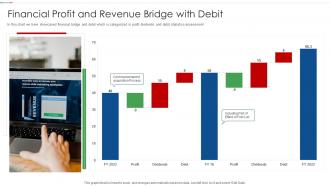 Financial Profit And Revenue Bridge With Debit
In this chart we have showcased financial bridge and debit which is categorized in profit dividends and debit statistics assessment Presenting our well structured Financial Profit And Revenue Bridge With Debit. The topics discussed in this slide are Financial Profit, Revenue Bridge, Debit. This is an instantly available PowerPoint presentation that can be edited conveniently. Download it right away and captivate your audience.
-
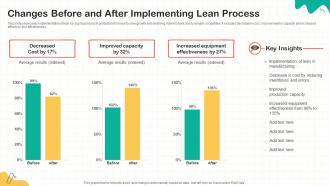 Changes Before And After Implementing Lean Process
This slide showcases implementation of lean six sigma process in production firm due to slow growth and declining market share and to remain competitive. It includes decrease in cost , improvement in capacity and increased efficiency and effectiveness. Introducing our Changes Before And After Implementing Lean Process set of slides. The topics discussed in these slides are Decreased Cost, Improved Capacity, Increased Equipment Effectiveness. This is an immediately available PowerPoint presentation that can be conveniently customized. Download it and convince your audience.
-
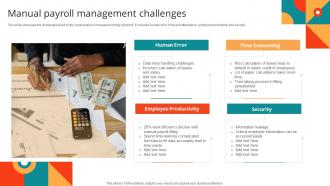 Manual Payroll Management Challenges
This slide showcase the challenges faced by the organisation in manual recording of payroll. It includes human error, time and attendance, employee productivity and security. Introducing our premium set of slides with Manual Payroll Management Challenges. Ellicudate the one stages and present information using this PPT slide. This is a completely adaptable PowerPoint template design that can be used to interpret topics like Human Error, Time Consuming, Employee Productivity, Security. So download instantly and tailor it with your information.
-
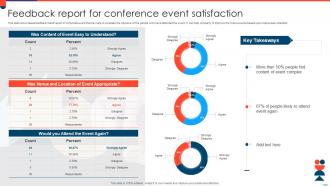 Feedback Report For Conference Event Satisfaction
This slide showcases feedback result report of corporate event that can help to evaluate the opinions of the people who have attended the event. It can help company to improve the future events based upon responses collected. Presenting our well structured Feedback Report For Conference Event Satisfaction. The topics discussed in this slide are Venue And Location, Event Appropriate, Strongly Disagree. This is an instantly available PowerPoint presentation that can be edited conveniently. Download it right away and captivate your audience.
-
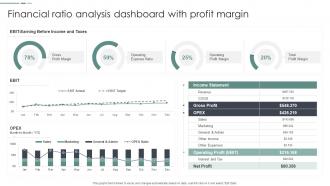 Financial Ratio Analysis Dashboard With Profit Margin
Introducing our Financial Ratio Analysis Dashboard With Profit Margin set of slides. The topics discussed in these slides are Financial Ratio Analysis, Dashboard, Profit Margin. This is an immediately available PowerPoint presentation that can be conveniently customized. Download it and convince your audience.
-
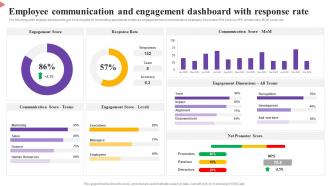 Employee Communication And Engagement Dashboard With Response Rate
The following slide displays dashboard to get- time insights for formulating appropriate employee engagement and communication strategies. It includes KPIs such as NPS, dimensions, MOM score, etc. Introducing our Employee Communication And Engagement Dashboard With Response Rate set of slides. The topics discussed in these slides are Engagement Score, Response Rate, Communication Score. This is an immediately available PowerPoint presentation that can be conveniently customized. Download it and convince your audience.
-
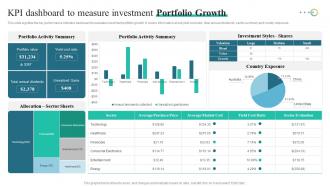 KPI Dashboard To Measure Investment Portfolio Growth
This slide signifies the key performance indicator dashboard to evaluate investment portfolio growth. It covers information about yield cost ratio, total annual dividends, sector summary and country exposure. Introducing our KPI Dashboard To Measure Investment Portfolio Growth set of slides. The topics discussed in these slides are KPI Dashboard, Measure Investment, Portfolio Growth. This is an immediately available PowerPoint presentation that can be conveniently customized. Download it and convince your audience.
-
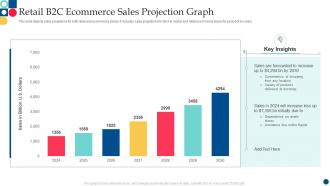 Retail B2c Ecommerce Sales Projection Graph
This slide depicts sales projections for both retail and ecommerce stores. It includes sales projections for brick mortar and retail ecommerce stores for period of six years. Introducing our Retail B2c Ecommerce Sales Projection Graph set of slides. The topics discussed in these slides are Sales Forecasted, Variety Products, Delivered Doorstep. This is an immediately available PowerPoint presentation that can be conveniently customized. Download it and convince your audience.
-
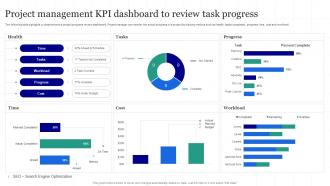 Project Management KPI Dashboard To Review Task Progress
The following slide highlights a comprehensive project progress review dashboard. Project manager can monitor the actual progress of a project by tracking metrics such as health, tasks completed, progress, time, cost and workload. Introducing our Project Progress Review With Change Request set of slides. The topics discussed in these slides are Time, Tasks, Workload, Progress, Cost. This is an immediately available PowerPoint presentation that can be conveniently customized. Download it and convince your audience.
-
 Project Management Cost Estimation Icon
Presenting our set of slides with Project Management Cost Estimation Icon. This exhibits information on four stages of the process. This is an easy to edit and innovatively designed PowerPoint template. So download immediately and highlight information on Project Management, Cost Estimation Icon.
-
 Analysing Employee Engagement Questionnaire Successful Employee Engagement Action Planning
The following slide depicts the key results of employee engagement survey to evaluate staff connection with their organization. It includes elements such as employees are motivated to meet their targets, healthy relations with colleagues, appreciates work culture etc. Present the topic in a bit more detail with this Analysing Employee Engagement Questionnaire Successful Employee Engagement Action Planning. Use it as a tool for discussion and navigation on Questionnaire, Engagement, Advancement. This template is free to edit as deemed fit for your organization. Therefore download it now.
-
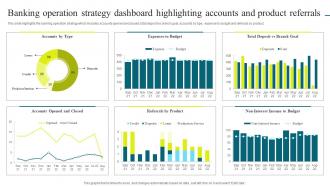 Banking Operation Strategy Dashboard Optimizing Banking Operations And Services Model
This slide highlights the banking operation strategy dashboard which showcases current account and saving account growth rate, savings account deposits, current account deposits and retail term deposits. Deliver an outstanding presentation on the topic using this Banking Operation Strategy Dashboard Optimizing Banking Operations And Services Model. Dispense information and present a thorough explanation of Banking Operation Strategy Dashboard, Highlighting Deposits And Growth Rate using the slides given. This template can be altered and personalized to fit your needs. It is also available for immediate download. So grab it now.
-
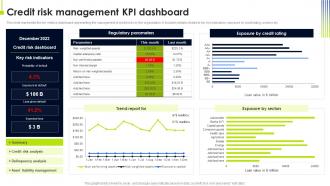 Credit Risk Management KPI Dashboard Operational Risk Management Strategic
This slide represents the key metrics dashboard representing the management of credit risks by the organization. It includes details related to key risk indicators, exposure by credit rating, sectors etc. Present the topic in a bit more detail with this Credit Risk Management KPI Dashboard Operational Risk Management Strategic. Use it as a tool for discussion and navigation on Regulatory Parameters, Trend Report, Exposure By Sectors. This template is free to edit as deemed fit for your organization. Therefore download it now.
-
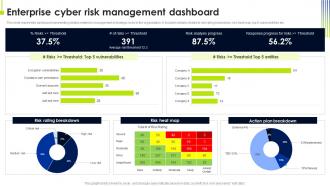 Enterprise Cyber Risk Management Operational Risk Management Strategic
This slide represents dashboard representing details related to management of strategic risks in the organization. It includes details related to risk rating breakdown, risk heat map, top 5 vulnerabilities etc. Present the topic in a bit more detail with this Enterprise Cyber Risk Management Operational Risk Management Strategic. Use it as a tool for discussion and navigation on Risk Rating Breakdown, Risk Heat Map, Action Plan Breakdown. This template is free to edit as deemed fit for your organization. Therefore download it now.
-
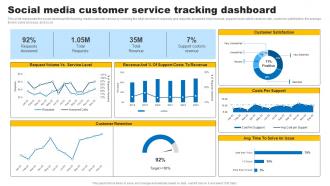 Social Media Customer Service Tracking Dashboard Social Media In Customer Service
This slide represents the social dashboard for tracking media customer service by covering the total number of requests and requests answered, total revenue, support costs rate to revenue rate, customer satisfaction, the average time to solve an issue, and so on. Present the topic in a bit more detail with this Social Media Customer Service Tracking Dashboard Social Media In Customer Service. Use it as a tool for discussion and navigation on Social Dashboard, Tracking Media, Customer Service, Revenue Rate, Customer Satisfaction. This template is free to edit as deemed fit for your organization. Therefore download it now.
-
 Internal Business Process Audit Dashboard
The slide showcases dashboard that presents evaluation for internal business process audit implemented in organization .It contains elements such as sub auditor chart, auditor chart etc. Presenting our well structured Internal Business Process Audit Dashboard. The topics discussed in this slide are Enterprise Working Environment, Internal Business Process This is an instantly available PowerPoint presentation that can be edited conveniently. Download it right away and captivate your audience.
-
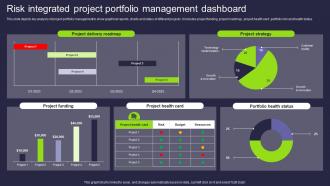 Risk Integrated Project Portfolio Management Dashboard
This slide depicts key analysis of project portfolio management to show graphical reports, charts and status of different projects. it includes project funding ,project roadmap , project health card ,portfolio risk and health status. Introducing our Risk Integrated Project Portfolio Management Dashboard set of slides. The topics discussed in these slides are Project Delivery Roadmap, Project Strategy, Project Health Card. This is an immediately available PowerPoint presentation that can be conveniently customized. Download it and convince your audience.
-
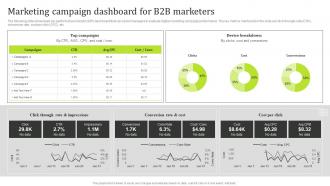 Marketing Campaign Dashboard For B2B Marketers State Of The Information Technology Industry MKT SS V
The following slide showcases key performance indicator KPI dashboard that can assist managers to evaluate digital marketing campaign performance. The key metrics mentioned in the slide are click-through-rate CTR, conversion rate, cost per click CPC, etc. Present the topic in a bit more detail with this Marketing Campaign Dashboard For B2B Marketers State Of The Information Technology Industry MKT SS V. Use it as a tool for discussion and navigation on Device Breakdown, Cost Per Click. This template is free to edit as deemed fit for your organization. Therefore download it now.
-
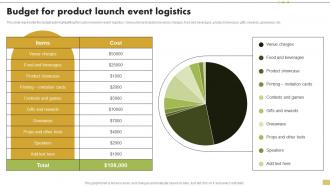 Budget For Product Launch Event Logistics Steps For Implementation Of Corporate
This slide represents the budget plan highlighting the costs involved in event logistics. Various items included are venue charges, food and beverages, product showcase, gifts, rewards, giveaways, etc. Present the topic in a bit more detail with this Budget For Product Launch Event Logistics Steps For Implementation Of Corporate. Use it as a tool for discussion and navigation on Items, Cost. This template is free to edit as deemed fit for your organization. Therefore download it now.
-
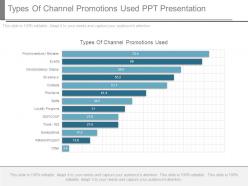 Types of channel promotions used ppt presentation
Presenting types of channel promotions used ppt presentation. This is a types of channel promotions used ppt presentation. This is a thirteen stage process. The stages in this process are types of channel promotions used, loyalty programs.
-
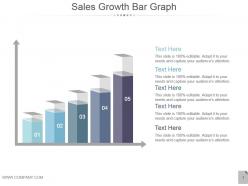 Sales growth bar graph powerpoint templates
Presenting sales growth bar graph powerpoint templates. This is a sales growth bar graph powerpoint templates. This is a five stage process. The stages in this process are growth, business, marketing, arrows, management.
-
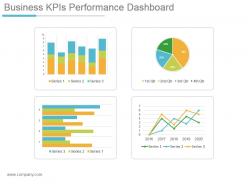 Business kpis performance dashboard snapshot powerpoint slide clipart
Presenting business kpis performance dashboard snapshot powerpoint slide clipart. This is a business kpis performance dashboard powerpoint slide clipart. This is a four stage process. The stages in this process are series, qtr.
-
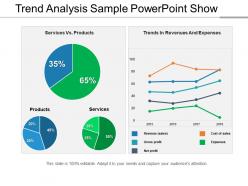 Trend analysis sample powerpoint show
Presenting a PowerPoint slide named Trend Analysis Sample PowerPoint Show. Create a compelling presentation with this PPT diagram, which is both professional and editable. Customize colors, choose font styles, and size. You can choose from a wide variety of icons. Resize and scale the images to fit any content. The PPT slide is compatible with Google Slides and can be fetched at once. You can save it as both PDF and JPG format. This PPT slide is data-driven and linked to the Excel sheet.
-
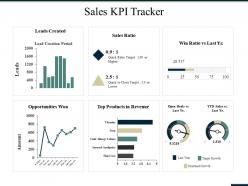 Sales kpi tracker ppt summary grid
Presenting this set of slides with name - Sales Kpi Tracker Ppt Summary Grid. This is a six stage process. The stages in this process are Leads Created, Sales Ratio, Opportunities Won, Products In Revenue, Open Deals Vs.
-
 Mobile banking icon powerpoint
Presenting this set of slides with name - Mobile Banking Icon Powerpoint. This is a one stage process. The stages in this process are Mobile Banking, Online Banking, Mobile Payment.
-
 Stakeholder icon one person dollar sign icon
Presenting this set of slides with name - Stakeholder Icon One Person Dollar Sign Icon. This is a two stage process. The stages in this process are Stakeholder Icon, Corporate Icon, Shareholder Icon.
-
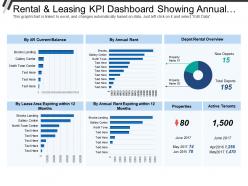 Rental and leasing kpi dashboard showing annual rent depot rental overview
Presenting this set of slides with name - Rental And Leasing Kpi Dashboard Showing Annual Rent Depot Rental Overview. This is a seven stage process. The stages in this process are Rental And Leasing, Dealing And Leasing, Rental And Engage.
-
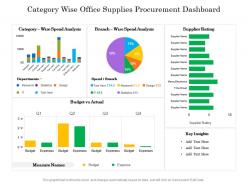 Category wise office supplies procurement dashboard
Presenting this set of slides with name Category Wise Office Supplies Procurement Dashboard. The topics discussed in these slides are Analysis, Budget, Measure. This is a completely editable PowerPoint presentation and is available for immediate download. Download now and impress your audience.
-
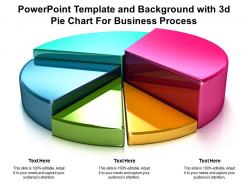 Powerpoint template and background with 3d pie chart for business process
Bolster your presentation designs and make them impactful with our Powerpoint Template And Background With 3d Pie Chart For Business Process. This cutting edge PPT will help you meet your audience expectations due to its interactive design. Useful content has been added to help you convey your ideas vision and principle aspects more proficiently. Throw light on what is important and take your presentation game a notch higher with this multipurpose design that comes with an assortment of features. No matter what is the purpose of your presentation conveying business ideas proposals analysis reports or any other you will find this creative design template perfect for all the scenarios. Also input any information and keep your audience hooked with this content ready template that is fully editable and customizable. Besides this you can represent large sets of complex data and information with this template design that can be adopted by any industry agency individual or group to deliver awe inspiring presentations.
-
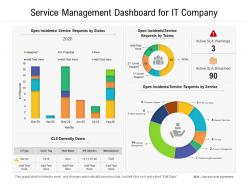 Service management dashboard for it company
Presenting this set of slides with name Service Management Dashboard For IT Company. The topics discussed in these slides are Service, Management, Network. This is a completely editable PowerPoint presentation and is available for immediate download. Download now and impress your audience.
-
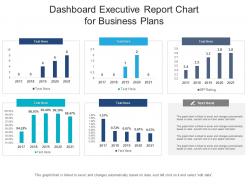 Dashboard snapshot executive report chart for business plans powerpoint template
You can use this Dashboard Snapshot Executive Report Chart For Business Plans Powerpoint Template to showcase the most crucial verticals of your organization or a project. This dashboard template comes with graphical representations to make the depiction of insights, data, reports, etc, very easy. It is useful in simplifying complex business concepts, allowing the viewers to make better decisions and judgments. This PowerPoint layout is specially designed for different department heads to display diverse sets of information on the topic and help make the viewers become better analysts. Therefore, this PowerPoint layout is not only resourceful, but it is also attention-grabbing and high-quality. Everything from the content and graphics used in this slide can be modified and adjusted as per your needs. It can also be reproduced in PNG, JPG, and PDF formats, which increases the user-friendliness of this layout.
-
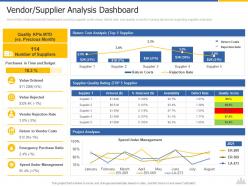 Vendor supplier analysis dashboard construction project risk landscape ppt clipart
Here in this slide we include Dashboard covering supplier order value, defect rate, and quality score for making decisions regarding supplier selection. Deliver an outstanding presentation on the topic using this Vendor Supplier Analysis Dashboard Construction Project Risk Landscape Ppt Clipart. Dispense information and present a thorough explanation of Rejection Rate, Vendor Costs, Management, Value Ordered, Supplier using the slides given. This template can be altered and personalized to fit your needs. It is also available for immediate download. So grab it now.
-
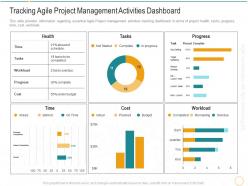 Tracking agile project management activities dashboard digital transformation agile methodology it
This slide provides information regarding essential Agile Project management activities tracking dashboard in terms of project health, tasks, progress, time, cost, workload. Present the topic in a bit more detail with this Tracking Agile Project Management Activities Dashboard Digital Transformation Agile Methodology IT. Use it as a tool for discussion and navigation on Tracking Agile Project Management Activities Dashboard. This template is free to edit as deemed fit for your organization. Therefore download it now.
-
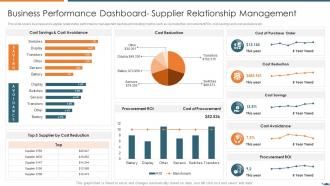 Business performance dashboard snapshot vendor relationship management strategies
This slide covers business and supplier relationship performance management dashboard including metrics such as cist reduction, procurement ROI, cost savings and cost avoidance etc. Present the topic in a bit more detail with this Business Performance Dashboard Snapshot Vendor Relationship Management Strategies. Use it as a tool for discussion and navigation on Cost Savings And Cost Avoidance, Cost Reduction, Cost Of Purchase Order. This template is free to edit as deemed fit for your organization. Therefore download it now.
-
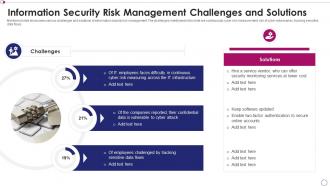 Information security risk management challenges and solutions
Mentioned slide showcases various challenges and solutions of information security risk management. The challenges mentioned in the slide are continuously cyber risk measurement, risk of cyber adversaries, tracking sensitive data flows. Introducing our Information Security Risk Management Challenges And Solutions set of slides. The topics discussed in these slides are Measuring, Service, Security. This is an immediately available PowerPoint presentation that can be conveniently customized. Download it and convince your audience.
-
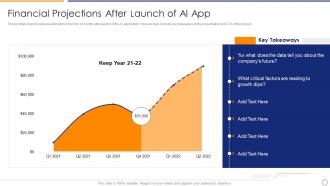 Ai analytics investor pitch deck financial projections after launch of ai app
This template depicts revenue estimation in the first 18 months after launch of the AI application. Here we have includes key takeaways of the presentation and CTA of the project. Present the topic in a bit more detail with this Ai Analytics Investor Pitch Deck Financial Projections After Launch Of Ai App. Use it as a tool for discussion and navigation on Financial Projections After Launch Of AI App. This template is free to edit as deemed fit for your organization. Therefore download it now.
-
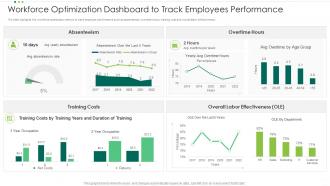 Workforce Optimization Dashboard To Track Employees Performance
The slide highlights the workforce optimization metrics to track employee performance such as absenteeism, overtime hours, training cost and overall labor effectiveness. Presenting our well structured Workforce Optimization Dashboard To Track Employees Performance. The topics discussed in this slide are Absenteeism, Overtime Hours, Training Costs, Overall Labor Effectiveness. This is an instantly available PowerPoint presentation that can be edited conveniently. Download it right away and captivate your audience.
-
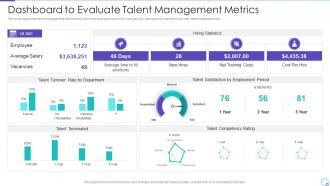 Talent Management System for Effective Hiring Process Dashboard to Evaluate Talent
This slide represents talent management dashboards. It includes average time to hire, cost per hire, training cost, talent turnover rate, talent satisfaction etc. Present the topic in a bit more detail with this Talent Management System for Effective Hiring Process Dashboard to Evaluate Talent. Use it as a tool for discussion and navigation on Dashboard To Evaluate Talent Management Metrics. This template is free to edit as deemed fit for your organization. Therefore download it now.
-
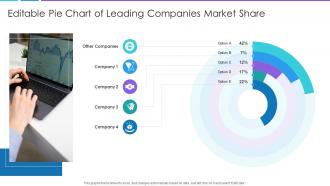 Editable Pie Chart Of Leading Companies Market Share
Presenting our well structured Editable Pie Chart Of Leading Companies Market Share. The topics discussed in this slide are Editable Pie Chart Of Leading Companies Market Share. This is an instantly available PowerPoint presentation that can be edited conveniently. Download it right away and captivate your audience.
-
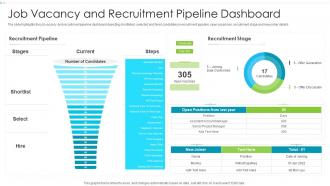 Job Vacancy And Recruitment Pipeline Dashboard
The slide highlights the job vacancy and recruitment pipeline dashboard depicting shortlisted, selected and hired candidates in recruitment pipeline, open vacancies, recruitment stage and new joiner details. Introducing our Job Vacancy And Recruitment Pipeline Dashboard set of slides. The topics discussed in these slides are Recruitment Stage, Recruitment Pipeline, Offer Discussion. This is an immediately available PowerPoint presentation that can be conveniently customized. Download it and convince your audience.
-
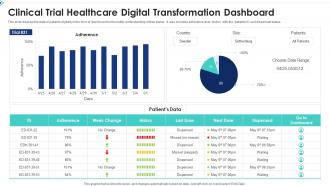 Clinical Trial Healthcare Digital Transformation Dashboard
This slide displays the data of patients digitally in the form of dashboard for the better understanding of their status. It also includes adherence level, history with the patients ID and dispensed status. Introducing our Clinical Trial Healthcare Digital Transformation Dashboard set of slides. The topics discussed in these slides are Clinical Trial Healthcare Digital Transformation Dashboard. This is an immediately available PowerPoint presentation that can be conveniently customized. Download it and convince your audience.
-
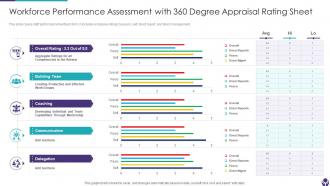 Workforce Performance Assessment With 360 Degree Appraisal Rating Sheet
This slide covers staff performance feedback form. It includes employee ratings by peers, self, direct report, and direct management. Introducing our Workforce Performance Assessment With 360 Degree Appraisal Rating Sheet set of slides. The topics discussed in these slides are Building Team, Coaching, Communication, Delegation. This is an immediately available PowerPoint presentation that can be conveniently customized. Download it and convince your audience.
-
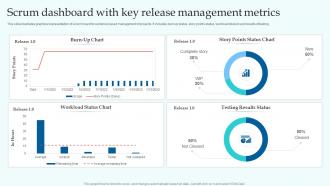 Scrum Dashboard With Key Release Management Metrics
This slide illustrates graphical representation of scrum board for evidence based management of projects. It includes burn up status, story points status, workload division and results of testing. Introducing our Scrum Dashboard With Key Release Management Metrics set of slides. The topics discussed in these slides are Testing Results Status, Workload Status Chart, Burn Up Chart. This is an immediately available PowerPoint presentation that can be conveniently customized. Download it and convince your audience.
-
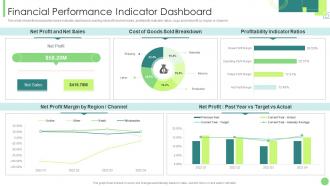 Financial Performance Indicator Dashboard Kpis To Assess Business Performance
This slide shows financial performance indicator dashboard covering net profit and net sales, profitability indicator ratios, cogs and net profit by region or channel. Present the topic in a bit more detail with this Financial Performance Indicator Dashboard Kpis To Assess Business Performance. Use it as a tool for discussion and navigation on Financial, Performance, Dashboard. This template is free to edit as deemed fit for your organization. Therefore download it now.


