Financials PowerPoint Templates, Financial Statement PPT Templates
- Sub Categories
-
- 30 60 90 Day Plan
- About Us Company Details
- Action Plan
- Agenda
- Annual Report
- Audit Reports
- Balance Scorecard
- Brand Equity
- Business Case Study
- Business Communication Skills
- Business Plan Development
- Business Problem Solving
- Business Review
- Capital Budgeting
- Career Planning
- Change Management
- Color Palettes
- Communication Process
- Company Location
- Company Vision
- Compare
- Competitive Analysis
- Corporate Governance
- Cost Reduction Strategies
- Custom Business Slides
- Customer Service
- Dashboard
- Data Management
- Decision Making
- Digital Marketing Strategy
- Digital Transformation
- Disaster Management
- Diversity
- Equity Investment
- Financial Analysis
- Financial Services
- Financials
- Growth Hacking Strategy
- Human Resource Management
- Innovation Management
- Interview Process
- Knowledge Management
- Leadership
- Lean Manufacturing
- Legal Law Order
- Management
- Market Segmentation
- Marketing
- Media and Communication
- Meeting Planner
- Mergers and Acquisitions
- Metaverse
- Newspapers
- Operations and Logistics
- Organizational Structure
- Our Goals
- Performance Management
- Pitch Decks
- Pricing Strategies
- Process Management
- Product Development
- Product Launch Ideas
- Product Portfolio
- Project Management
- Purchasing Process
- Quality Assurance
- Quotes and Testimonials
- Real Estate
- Risk Management
- Sales Performance Plan
- Sales Review
- SEO
- Service Offering
- Six Sigma
- Social Media and Network
- Software Development
- Solution Architecture
- Stock Portfolio
- Strategic Management
- Strategic Planning
- Supply Chain Management
- Swimlanes
- System Architecture
- Team Introduction
- Testing and Validation
- Thanks-FAQ
- Time Management
- Timelines Roadmaps
- Value Chain Analysis
- Value Stream Mapping
- Workplace Ethic
-
 Security Company Sales Revenue By Market And Services Smart Security Systems Company Profile
This slide highlights the security company sales revenue by market share and commodity in pie chart format which includes Northeast, Southwest, Southeast, Midwest regions sales revenue. Deliver an outstanding presentation on the topic using this Security Company Sales Revenue By Market And Services Smart Security Systems Company Profile. Dispense information and present a thorough explanation of Revenue, Services, Networking Solutions using the slides given. This template can be altered and personalized to fit your needs. It is also available for immediate download. So grab it now.
-
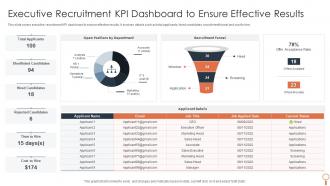 Executive Recruitment Kpi Dashboard To Ensure Effective Results
This slide covers executive recruitment KPI dashboard to ensure effective results. It involves details such as total applicants, hired candidates, recruitment funnel and cost to hire. Introducing our Executive Recruitment Kpi Dashboard To Ensure Effective Results set of slides. The topics discussed in these slides are Executive, Recruitment, Dashboard. This is an immediately available PowerPoint presentation that can be conveniently customized. Download it and convince your audience.
-
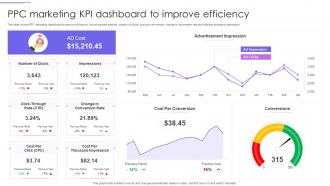 PPC Marketing KPI Dashboard To Improve Efficiency
This slide covers PPC marketing dashboard to improve efficiency. It involves total spends, number of clicks, cost per conversion, change in conversion rate and cost per thousand impression. Presenting our well structured PPC Marketing KPI Dashboard To Improve Efficiency. The topics discussed in this slide are Advertisement Impression, Cost Per Thousand, Cost Per Click. This is an instantly available PowerPoint presentation that can be edited conveniently. Download it right away and captivate your audience.
-
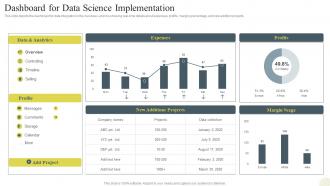 Data Science Technology Dashboard Snapshot For Data Science Implementation
This slide depicts the dashboard for data integration in the business, and it is showing real-time details about expenses, profits, margins percentage, and new addition projects. Present the topic in a bit more detail with this Data Science Technology Dashboard Snapshot For Data Science Implementation. Use it as a tool for discussion and navigation on Analytics, Implementation, Integration. This template is free to edit as deemed fit for your organization. Therefore download it now.
-
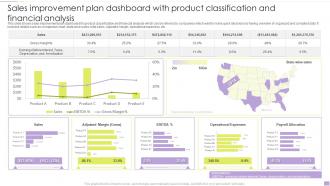 Sales Improvement Plan Dashboard With Product Classification And Financial Analysis
This slide shows sales improvement plan dashboard for product classification and financial analysis which can be referred by companies which want to make quick decisions by having overview of organized and compiled data. It includes details such as comparison chart, state wise sales, total sales, adjusted margin, operational expenses, etc.. Introducing our Sales Improvement Plan Dashboard With Product Classification And Financial Analysis set of slides. The topics discussed in these slides are Sales Improvement Plan, Dashboard, Product Classification, Financial Analysis. This is an immediately available PowerPoint presentation that can be conveniently customized. Download it and convince your audience.
-
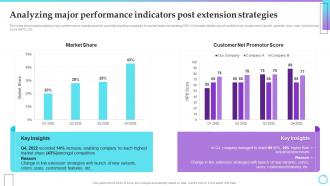 Analyzing Major Performance Indicators Post Brand Extension Strategy Implementation For Gainin
This slide showcases analyzing major performance indicators which can help branding managers to assess extension strategy KPIs. It provides details about market share, product line, launch, variants, color, size, net promotor score NPS, etc. Deliver an outstanding presentation on the topic using this Analyzing Major Performance Indicators Post Brand Extension Strategy Implementation For Gainin. Dispense information and present a thorough explanation of Market Share, Customer, Net Promotor Score, Key Insights using the slides given. This template can be altered and personalized to fit your needs. It is also available for immediate download. So grab it now.
-
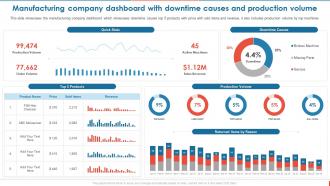 Manufacturing Company Dashboard With Downtime Causes Consumer Goods Manufacturing
This slide showcases the manufacturing company dashboard which showcases downtime causes top 5 products with price with sold items and revenue, it also includes production volume by top machines. Present the topic in a bit more detail with this Manufacturing Company Dashboard With Downtime Causes Consumer Goods Manufacturing. Use it as a tool for discussion and navigation on Manufacturing, Dashboard, Downtime Causes, Production Volume. This template is free to edit as deemed fit for your organization. Therefore download it now.
-
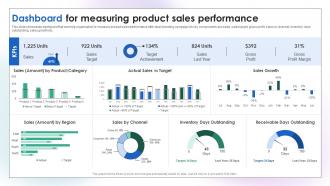 Dual Branding Campaign To Increase Product Dashboard For Measuring Product Sales Performance
This slide showcases dashboard that can help organization to measure product sales performance after dual branding campaign. Its key components are sales, sales target, gross profit, sales by channel, inventory days outstanding, sales growth etc. Present the topic in a bit more detail with this Dual Branding Campaign To Increase Product Dashboard For Measuring Product Sales Performance. Use it as a tool for discussion and navigation on Actual Sales Vs Target, Sales Growth, Sales By Channel. This template is free to edit as deemed fit for your organization. Therefore download it now.
-
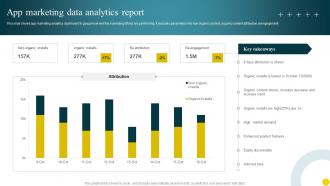 App Marketing Data Analytics Report
This slide shows app marketing analytics dashboard to gauge how well the marketing efforts are performing. It includes parameters like non organic content, organic content attribution, reengegement. Introducing our App Marketing Data Analytics Report set of slides. The topics discussed in these slides are App Marketing, Data Analytics Report, Organic Installs. This is an immediately available PowerPoint presentation that can be conveniently customized. Download it and convince your audience.
-
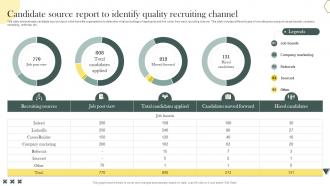 Candidate Source Report To Identify Quality Recruiting Channel
This slide demonstrates candidate source report which benefits organisations to determine what percentage of applicants and hire come from each recruiting channel. This slide includes different types of recruiting sources such as job boards, company marketing, referrals, etc. Introducing our Candidate Source Report To Identify Quality Recruiting Channel set of slides. The topics discussed in these slides are Company Marketing, Job Boards, Sourced. This is an immediately available PowerPoint presentation that can be conveniently customized. Download it and convince your audience.
-
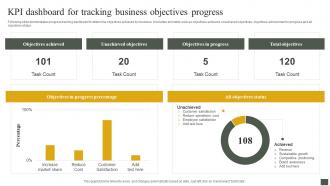 Kpi Dashboard For Tracking Business Objectives Progress
Following slide demonstrates progress tracking dashboard to determine objectives achieved by business. It includes elements such as objectives achieved, unachieved objectives, objectives achievement in progress and all objectives status.Presenting our well structured Kpi Dashboard For Tracking Business Objectives Progress. The topics discussed in this slide are Objectives Achieved, Unachieved Objectives, Objectives Progress . This is an instantly available PowerPoint presentation that can be edited conveniently. Download it right away and captivate your audience.
-
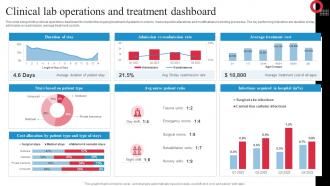 Clinical Lab Operations And Treatment Dashboard
This slide brings forth a clinical operations dashboard to monitor the ongoing treatment of patients in order to make requisite alterations and modifications in existing processes. The key performing indicators are duration of stay, admission vs readmission, average treatment cost etc. Introducing our Clinical Lab Operations And Treatment Dashboard set of slides. The topics discussed in these slides are Emergency, Trauma, Surgical. This is an immediately available PowerPoint presentation that can be conveniently customized. Download it and convince your audience.
-
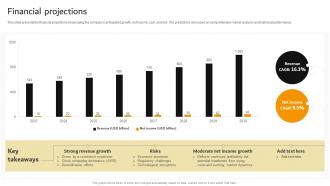 Financial Projections Amazon Business Model BMC SS
This slide presents the financial projections showcasing the companys anticipated growth, net income, cost, and risk. The predictions are based on comprehensive market analysis and historical performance. Present the topic in a bit more detail with this Financial Projections Amazon Business Model BMC SS Use it as a tool for discussion and navigation on Product Sourcing And Procurement, Fulfillment And Delivery, Marketing And Advertising This template is free to edit as deemed fit for your organization. Therefore download it now.
-
 Icon For Cloud Transformation Services In Finance
Introducing our premium set of slides with Icon For Cloud Transformation Services In Finance. Ellicudate the three stages and present information using this PPT slide. This is a completely adaptable PowerPoint template design that can be used to interpret topics like Transformation, Services, Finance. So download instantly and tailor it with your information.
-
 Columns Stacked 3 PU Chart SS
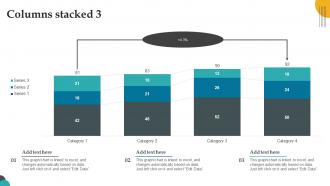
Introducing our Columns Stacked 3 PU Chart SS set of slides. The topics discussed in these slides are Columns Stacked 3. This is an immediately available PowerPoint presentation that can be conveniently customized. Download it and convince your audience.
-
 Columns Stacked And Clustered PU Chart SS
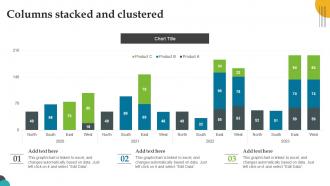
Presenting our well structured Columns Stacked And Clustered PU Chart SS. The topics discussed in this slide are Columns Stacked And Clustered. This is an instantly available PowerPoint presentation that can be edited conveniently. Download it right away and captivate your audience.
-
 Consumer Service KPI Analysis Dashboard
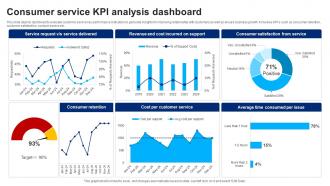
This slide depicts dashboard to evaluate customer service key performance indicators to generate insights for improving relationship with customers as well as ensure business growth. It involves KPIs such as consumer retention, customer satisfaction, cost per service etc. Introducing our Consumer Service KPI Analysis Dashboard set of slides. The topics discussed in these slides are Customer, Average, Satisfaction. This is an immediately available PowerPoint presentation that can be conveniently customized. Download it and convince your audience.
-
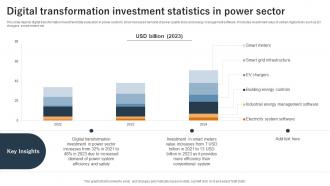 Digital Transformation Investment Statistics In Power Sector
This slide depicts digital transformation investment data evaluation in power sector to show increased demand of power quality tools and energy management software. It includes investment value of certain digital tools such as EV chargers, smart meters etc. Presenting our well structured Digital Transformation Investment Statistics In Power Sector. The topics discussed in this slide are Investment, System, Increases. This is an instantly available PowerPoint presentation that can be edited conveniently. Download it right away and captivate your audience.
-
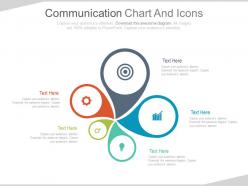 Five staged communication chart and icons powerpoint slides
Presenting five staged communication chart and icons powerpoint slides. This Power Point template diagram slide has been crafted with graphic of five staged chart and icons diagram. This PPT diagram contains the concept of business communication strategy representation. Use this PPT diagram for business and marketing related presentations.
-
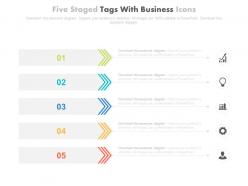 Five staged tags with business icons for business process powerpoint slides
Presenting five staged tags with business icons for business process powerpoint slides. This Power Point template diagram slide has been crafted with graphic of five staged tags and icons diagram. This PPT diagram contains the concept of business process flow representation. Use this PPT diagram for business and marketing related presentations.
-
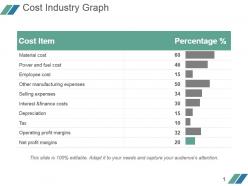 Cost industry graph powerpoint slide background image
Presenting cost industry graph powerpoint slide background image. This is a cost industry graph powerpoint slide background image. This is a ten stage process. The stages in this process are cost item, material cost, power and fuel cost, employee cost, other manufacturing expenses, selling expenses, interest and finance costs, depreciation, tax, operating profit margins, net profit margins, percentage.
-
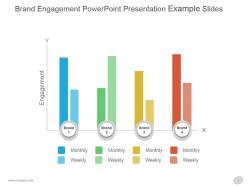 Brand engagement powerpoint presentation example slides
Presenting brand engagement powerpoint presentation example slides. This is a brand engagement powerpoint presentation example slides. This is a four stage process. The stages in this process are engagement, monthly, weekly, brand.
-
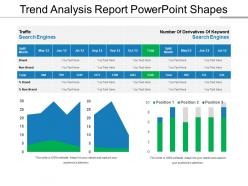 Trend analysis report powerpoint shapes
Presenting Trend Analysis Report PowerPoint Shapes. Customize the slide as per your wants. You are free to change anything in the slide. Modify the colors, background, font type, and font size. It can be transformed and saved in various formats like JPG, PNG, PDF, and JPEG. The slide goes well with the Google Slides and major Microsoft versions. It can be viewed on standard screen size and widescreen size as well.
-
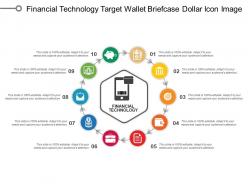 Financial technology target wallet briefcase dollar icon image
Presenting this set of slides with name - Financial Technology Target Wallet Briefcase Dollar Icon Image. This is a ten stage process. The stages in this process are Financial Technology, Fintech, Financial Services.
-
 Sponsorship roadmap template project team sponsors employees
Presenting this set of slides with name - Sponsorship Roadmap Template Project Team Sponsors Employees. This is a five stage process. The stages in this process are Sponsorship Roadmap Template, Sponsorship Timeline Template, Sponsorship Linear Process Template.
-
 Financial Market Instruments Powerpoint Presentation Slides
Presenting this set of slides with name - Financial Market Instruments Powerpoint Presentation Slides. This deck consists of total of thirtyseven slides. It has PPT slides highlighting important topics of Financial Market Instruments Powerpoint Presentation Slides. This deck comprises of amazing visuals with thoroughly researched content. Each template is well crafted and designed by our PowerPoint experts. Download PowerPoint templates in both widescreen and standard screen. The presentation is fully supported by Google Slides. It can be easily converted into JPG or PDF format.
-
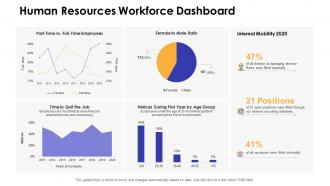 Dashboards by function human resources workforce dashboard
Deliver an outstanding presentation on the topic using this Dashboards By Function Human Resources Workforce Dashboard. Dispense information and present a thorough explanation of Human Resources Workforce Dashboard using the slides given. This template can be altered and personalized to fit your needs. It is also available for immediate download. So grab it now.
-
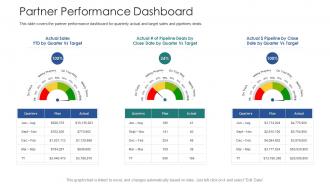 Vendor channel partner training partner performance dashboard
This slide covers the partner performance dashboard for quarterly actual and target sales and pipelines deals. Deliver an outstanding presentation on the topic using this Vendor Channel Partner Training Partner Performance Dashboard. Dispense information and present a thorough explanation of Target, Plan using the slides given. This template can be altered and personalized to fit your needs. It is also available for immediate download. So grab it now.
-
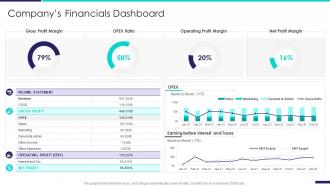 Company profile information technology companys financials dashboard snapshot
This graph or chart is linked to excel, and changes automatically based on data. Just left click on it and select Edit Data. Present the topic in a bit more detail with this Company Profile Information Technology Companys Financials Dashboard snapshot. Use it as a tool for discussion and navigation on Gross Profit Margin, OPEX Ratio, Operating Profit Margin, Net Profit Margin. This template is free to edit as deemed fit for your organization. Therefore download it now.
-
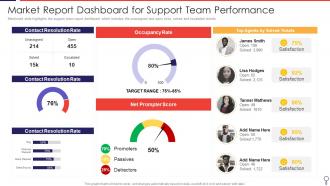 Market Report Dashboard Snapshot For Support Team Performance
Mentioned slide highlights the support team report dashboard which includes the unassigned and open ticks, solved and escalated tickets. Presenting our well-structured Market Report Dashboard Snapshot For Support Team Performance. The topics discussed in this slide are Dashboard, Performance, Escalated. This is an instantly available PowerPoint presentation that can be edited conveniently. Download it right away and captivate your audience.
-
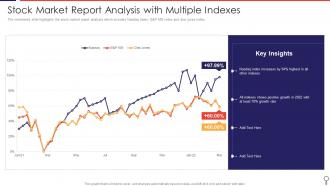 Stock Market Report Analysis With Multiple Indexes
The mentioned slide highlights the stock market report analysis which includes Nasdaq index, S and P 500 index and dow jones index. Introducing our Stock Market Report Analysis With Multiple Indexes set of slides. The topics discussed in these slides are Stock Market Report Analysis With Multiple Indexes. This is an immediately available PowerPoint presentation that can be conveniently customized. Download it and convince your audience.
-
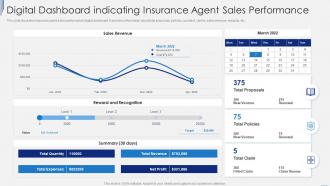 Digital Dashboard Indicating Insurance Agent Sales Performance
This slide illustrates insurance agent sales performance digital dashboard. It provides information about total proposals, policies, accident, claims, sales revenue, rewards, etc. Introducing our Digital Dashboard Indicating Insurance Agent Sales Performance set of slides. The topics discussed in these slides are Sales Revenue, Reward And Recognition, Expenses. This is an immediately available PowerPoint presentation that can be conveniently customized. Download it and convince your audience.
-
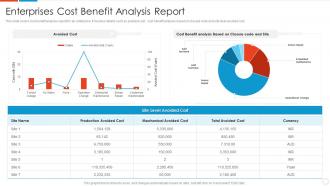 Enterprises Cost Benefit Analysis Report
This slide covers cost benefit analysis report for an enterprise. It involves details such as avoided cost , cost benefit analysis based on closure code and site level avoided cost. Presenting our well-structured Enterprises Cost Benefit Analysis Report. The topics discussed in this slide are Enterprises Cost Benefit Analysis Report. This is an instantly available PowerPoint presentation that can be edited conveniently. Download it right away and captivate your audience.
-
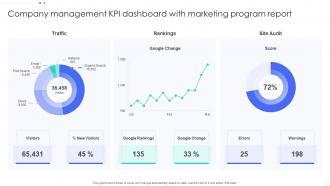 Company Management KPI Dashboard Snapshot With Marketing Program Report
This graph or chart is linked to excel, and changes automatically based on data. Just left click on it and select Edit Data. Introducing our Company Management KPI Dashboard Snapshot With Marketing Program Report set of slides. The topics discussed in these slides are Rankings, Site Audit, Traffic. This is an immediately available PowerPoint presentation that can be conveniently customized. Download it and convince your audience.
-
 Project Cost Expense Report Icon
Presenting our set of slides with Project Cost Expense Report Icon. This exhibits information on three stages of the process. This is an easy to edit and innovatively designed PowerPoint template. So download immediately and highlight information on Project Cost, Expense Report Icon.
-
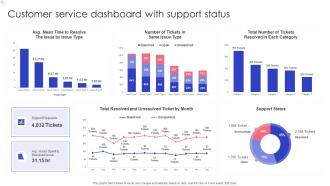 Customer Service Dashboard With Support Status
Introducing our Customer Service Dashboard With Support Status set of slides. The topics discussed in these slides are Customer Service Dashboard, Support Status. This is an immediately available PowerPoint presentation that can be conveniently customized. Download it and convince your audience.
-
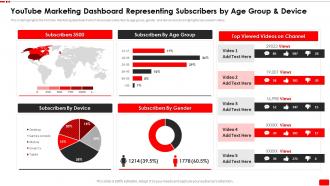 Youtube Marketing Dashboard Representing Subscribers By Video Content Marketing Plan For Youtube Advertising
This slide highlights the YouTube Marketing dashboard which showcase subscriber by age group, gender and device and also highlights top viewed videos. Present the topic in a bit more detail with this Youtube Marketing Dashboard Representing Subscribers By Video Content Marketing Plan For Youtube Advertising. Use it as a tool for discussion and navigation on Marketing, Dashboard, Representing. This template is free to edit as deemed fit for your organization. Therefore download it now.
-
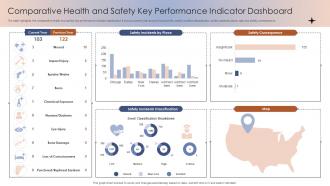 Comparative Health And Safety Key Performance Indicator Dashboard
The slide highlights the comparative health and safety key performance indicator dashboard. It shows current year and previous events, safety incident classification, safety cases by place, map and safety consequence Introducing our Comparative Health And Safety Key Performance Indicator Dashboard set of slides. The topics discussed in these slides are Comparative Health, Safety, Key Performance Indicator, Dashboard. This is an immediately available PowerPoint presentation that can be conveniently customized. Download it and convince your audience.
-
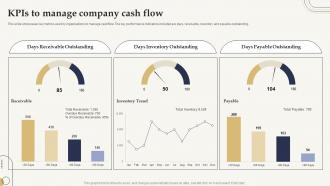 KPIs To Manage Company Cash Flow
This slide showcases key metrics used by organizations to manage cashflow. The key performance indicators included are days, receivable, inventory and payable outstanding. Presenting our well-structured KPIs To Manage Company Cash Flow. The topics discussed in this slide are Days Receivable Outstanding, Days Inventory Outstanding, Days Payable Outstanding. This is an instantly available PowerPoint presentation that can be edited conveniently. Download it right away and captivate your audience.
-
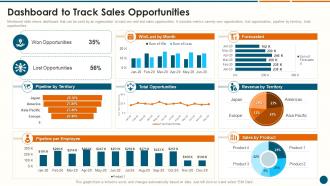 Dashboard To Track Sales Opportunities Structuring A New Product Launch Campaign
Mentioned slide shows dashboard that can be used by an organization to track win and lost sales opportunities. It includes metrics namely won opportunities, lost opportunities, pipeline by territory, total opportunities. Deliver an outstanding presentation on the topic using this Dashboard To Track Sales Opportunities Structuring A New Product Launch Campaign. Dispense information and present a thorough explanation of Won Opportunities, Total Opportunities, Revenue By Territory using the slides given. This template can be altered and personalized to fit your needs. It is also available for immediate download. So grab it now.
-
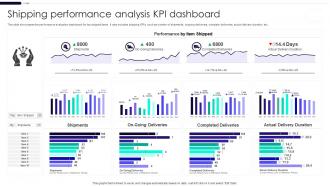 Shipping Performance Analysis KPI Dashboard
This slide showcases the performance evaluation dashboard for top shipped items. It also includes shipping KPIs such as number of shipments, ongoing deliveries, complete deliveries, actual delivery duration, etc. Introducing our Shipping Performance Analysis KPI Dashboard set of slides. The topics discussed in these slides are Completed Deliveries, Actual Delivery Duration, On Going Deliveries, Shipments. This is an immediately available PowerPoint presentation that can be conveniently customized. Download it and convince your audience.
-
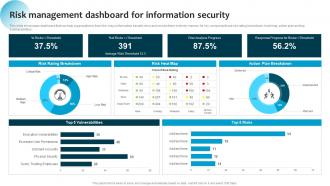 Information System Security And Risk Administration Plan Risk Management Dashboard For Information Security
This slide showcases dashboard that can help organization to track the major information security risks and resolve them in timely manner. Its key components are risk rating breakdown, heat map, action plan and top 5 vulnerabilities. Deliver an outstanding presentation on the topic using this Information System Security And Risk Administration Plan Risk Management Dashboard For Information Security. Dispense information and present a thorough explanation of Risk Rating Breakdown, Risk Heat Map, Action Plan Breakdown using the slides given. This template can be altered and personalized to fit your needs. It is also available for immediate download. So grab it now.
-
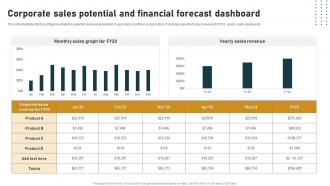 Corporate Sales Potential And Financial Forecast Dashboard
This slide illustrates facts and figures related to expected revenue generation in upcoming months in a corporation. It includes expected sales revenue for FY23, yearly sales revenue etc. Introducing our Corporate Sales Potential And Financial Forecast Dashboard set of slides. The topics discussed in these slides are Monthly Sales Graph, Revenue, Corporate Sales. This is an immediately available PowerPoint presentation that can be conveniently customized. Download it and convince your audience.
-
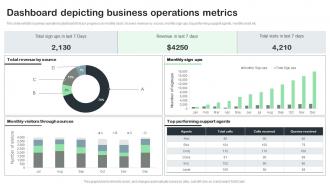 Dashboard Depicting Business Operations Metrics
This slide exhibits business operations dashboard to track progress on monthly basis. It covers revenue by source, monthly sign ups, top performing support agents, monthly visits etc. Introducing our Dashboard Depicting Business Operations Metrics set of slides. The topics discussed in these slides are Dashboard Depicting, Business Operations Metrics. This is an immediately available PowerPoint presentation that can be conveniently customized. Download it and convince your audience.
-
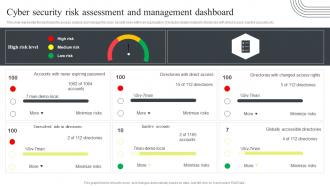 Cyber Security Attacks Response Plan Cyber Security Risk Assessment And Management Dashboard
This slide represents the dashboard to assess, analyze and manage the cyber security risks within an organization. It includes details related to directories with direct access, inactive accounts etc. Deliver an outstanding presentation on the topic using this Cyber Security Attacks Response Plan Cyber Security Risk Assessment And Management Dashboard. Dispense information and present a thorough explanation of Cyber Security, Risk Assessment, Management Dashboard using the slides given. This template can be altered and personalized to fit your needs. It is also available for immediate download. So grab it now.
-
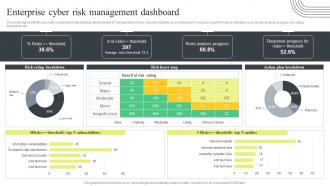 Cyber Security Attacks Response Plan Enterprise Cyber Risk Management Dashboard
This slide represents the key metrics dashboard representing details related to management of cyber security incidents by an enterprise. It includes key performance indicators such as risk analysis progress, risk rating breakdown etc. Deliver an outstanding presentation on the topic using this Cyber Security Attacks Response Plan Enterprise Cyber Risk Management Dashboard. Dispense information and present a thorough explanation of Enterprise Cyber, Risk Management, Dashboard, Action Plan Breakdown using the slides given. This template can be altered and personalized to fit your needs. It is also available for immediate download. So grab it now.
-
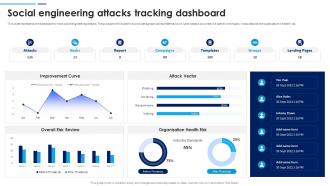 Social Engineering Attacks Tracking Dashboard Social Engineering Attacks Prevention
Deliver an outstanding presentation on the topic using this Social Engineering Attacks Tracking Dashboard Social Engineering Attacks Prevention. Dispense information and present a thorough explanation of Social Engineering Attacks, Tracking Dashboard, Organization Health Risk, Improvement Curve using the slides given. This template can be altered and personalized to fit your needs. It is also available for immediate download. So grab it now.
-
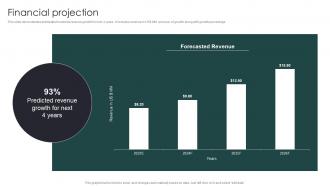 Financial Projection Big Data Management Investment Raising Pitch Deck
This slide demonstrates anticipated business revenue growth for next 4 years. It includes revenue in US dollar MM and year of growth along with growth percentage. Present the topic in a bit more detail with this Financial Projection Big Data Management Investment Raising Pitch Deck. Use it as a tool for discussion and navigation on Predicted Revenue Growth, Forecasted Revenue, 2023 To 2028. This template is free to edit as deemed fit for your organization. Therefore download it now.
-
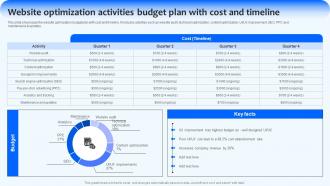 Website Optimization Activities Budget Implementing Management Strategies Strategy SS V
This slide showcases the website optimization budget plan with cost and timeline. It includes activities such as website audit, technical optimization, content optimization, UI UX improvement, SEO, PPC and maintenance and updates. Present the topic in a bit more detail with this Website Optimization Activities Budget Implementing Management Strategies Strategy SS V. Use it as a tool for discussion and navigation on Activities, Budget, Timeline. This template is free to edit as deemed fit for your organization. Therefore download it now.
-
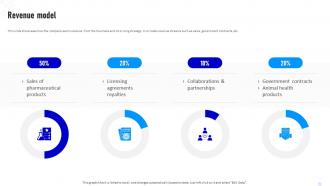 Revenue Model Pfizer Business Model Ppt File Background Designs BMC SS
This slide showcases how the company earns revenue from the business and its pricing strategy. It includes revenue streams such as sales, government contracts, etc. Deliver an outstanding presentation on the topic using this Revenue Model Pfizer Business Model Ppt File Background Designs BMC SS. Dispense information and present a thorough explanation of Licensing Agreements Royalties, Sales Of Pharmaceutical Products, Collaborations And Partnerships using the slides given. This template can be altered and personalized to fit your needs. It is also available for immediate download. So grab it now.
-
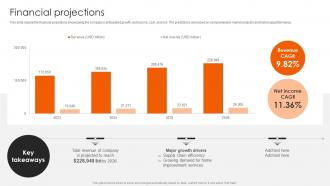 Financial Projections Home Depot Business Model BMC SS
This slide display the financial projections showcasing the companys anticipated growth, net income, cost, and risk. The predictions are based on comprehensive market analysis and historical performance. Present the topic in a bit more detail with this Financial Projections Home Depot Business Model BMC SS Use it as a tool for discussion and navigation on Financial Projections This template is free to edit as deemed fit for your organization. Therefore download it now.
-
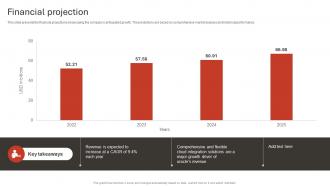 Financial Projection Oracle Business Model BMC SS
This slide presents the financial projections showcasing the companys anticipated growth. The predictions are based on comprehensive market analysis and historical performance. Present the topic in a bit more detail with this Financial Projection Oracle Business Model BMC SS Use it as a tool for discussion and navigation on Financial Projection This template is free to edit as deemed fit for your organization. Therefore download it now.
-
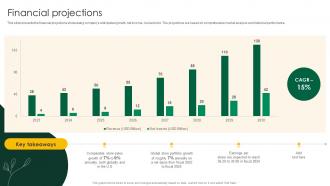 Financial Projections Starbucks Business Model BMC SS
This slide presents the financial projections showcasing companys anticipated growth, net income, cost and risk. The projections are based on comprehensive market analysis and historical performance. Present the topic in a bit more detail with this Financial Projections Starbucks Business Model BMC SS Use it as a tool for discussion and navigation on Financial Projections This template is free to edit as deemed fit for your organization. Therefore download it now.
-
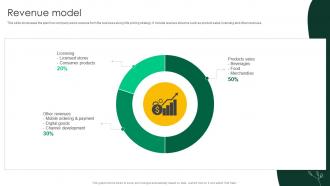 Revenue Model Starbucks Business Model BMC SS
This slide showcases the plan how company earns revenue from the business along it its pricing strategy. It include revenue streams such as product sales, licensing and other revenues. Present the topic in a bit more detail with this Revenue Model Starbucks Business Model BMC SS Use it as a tool for discussion and navigation on Consumer Products, Other Revenues, Products Sales This template is free to edit as deemed fit for your organization. Therefore download it now.
-
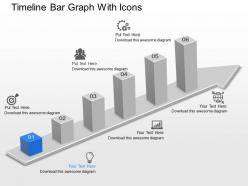 Du timeline bar graph with icons powerpoint template
Presenting du timeline bar graph with icons powerpoint template. Presenting du timeline bar graph with icons powerpoint template. Presenting du timeline bar graph with icons powerpoint template. This Power Point template diagram has been crafted with graphic of timeline and bar graph diagram. This PPT diagram contains the concept of business result analysis. Use this PPT diagram for business and marketing related presentations.
-
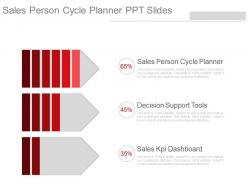 Sales person cycle planner ppt slides
Use of high-level of picture quality images and icons. Provided instructions to edit and modify the slide design. Easy to download and save. Instant addition of your company name or brand logo in the background. Edit the size, style and orientation of the slide icons. Beneficial for the sales and marketing professional s or the business managers The stages in this process are sales person cycle planner, decision support tools, sales kpi dashboard.
-
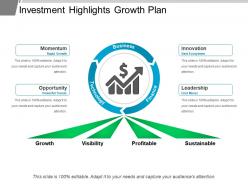 Investment highlights growth plan powerpoint show
Introducing investment highlights growth plan PowerPoint image. These are the astounding PowerPoint graphics which also have an immensely delineated PPT design visual narratives. All the contents, symbols, format, and PowerPoint Image, etc. are fully alterable. These PPT designs are descriptive with an elasticity to restore the statistics and very advantageous for the corporate experts and research scholars. They are also very simple and easy to download too.
-
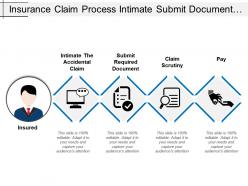 Insurance claim process intimate submit document security pay
Presenting this set of slides with name - Insurance Claim Process Intimate Submit Document Security Pay. This is a four stage process. The stages in this process are Insurance Claim Process, Insurance Claim Steps, Insurance Claim Procedure.
-
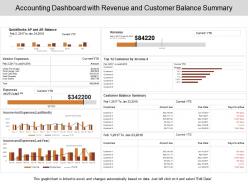 Accounting dashboard with revenue and customer balance summary
Pre-designed accounting dashboard with revenue and customer balance summary PPT template. High-resolution PowerPoint presentation backgrounds for better clarity of the information displayed. Offers wide variety of options and colors to alter the appearance. Allows adding of enterprise personal details such as brand name, logo and much more. Enough space available to enter text and its related points in the PPT slide. This slide is available in both Standard and Widescreen slide size. Compatible with multiple formats like JPEG, PDF and Google slides.
-
 Earn money icon of saving currency
Presenting this set of slides with name - Earn Money Icon Of Saving Currency. This is a four stages process. The stages in this process are Earn Money, Earn Cash, Earn Funds.


