Business Operational Risk Management Powerpoint Presentation Slides
Finding ways to reduce threats in business operations, then here You have professionally designed business operational risk management PowerPoint presentation graphics. Best thing is that with our content ready PPT you can easily manage your requirements and purposes of a risk assessment plan. To make this key risk indicator presentation more specific, we have added exclusive slides like industry operations summary, operational challenges, sales & marketing challenges, company strategy, product roadmap, financial summary, operating plan, threat mitigation strategies and many more. Not only this, our ORM presentation templates help to reduce the roadblocks in order to develop a better business management. Also, if you want to Create presentations on similar topics like risk assessment, implementation of threat control, strategic goals, tactical planning, integrated business planning, manpower planning, industry problem solving etc., then go with this organizational risk management PPT. So now what are you waiting for? Download our professionally created business operational risk management PowerPoint presentation graphics now and get the desired results. Address their gripes with our Business Operational Risk Management Powerpoint Presentation Slides. Identify cause for genuine complaint.
Finding ways to reduce threats in business operations, then here You have professionally designed business operational risk..
- Google Slides is a new FREE Presentation software from Google.
- All our content is 100% compatible with Google Slides.
- Just download our designs, and upload them to Google Slides and they will work automatically.
- Amaze your audience with SlideTeam and Google Slides.
-
Want Changes to This PPT Slide? Check out our Presentation Design Services
- WideScreen Aspect ratio is becoming a very popular format. When you download this product, the downloaded ZIP will contain this product in both standard and widescreen format.
-

- Some older products that we have may only be in standard format, but they can easily be converted to widescreen.
- To do this, please open the SlideTeam product in Powerpoint, and go to
- Design ( On the top bar) -> Page Setup -> and select "On-screen Show (16:9)” in the drop down for "Slides Sized for".
- The slide or theme will change to widescreen, and all graphics will adjust automatically. You can similarly convert our content to any other desired screen aspect ratio.
Compatible With Google Slides

Get This In WideScreen
You must be logged in to download this presentation.
PowerPoint presentation slides
This deck covers 80 templates. All slides are fully editable. Easy to download. High-resolution design templates. Compatible with google slides. This deck can be converted to PDF formats. Compatible with standard and widescreen. The presentation is 100% risk-free.
People who downloaded this PowerPoint presentation also viewed the following :
Content of this Powerpoint Presentation
Slide 1: This slide introduces Business Operational Risk Management. State Your Company Name and begins.
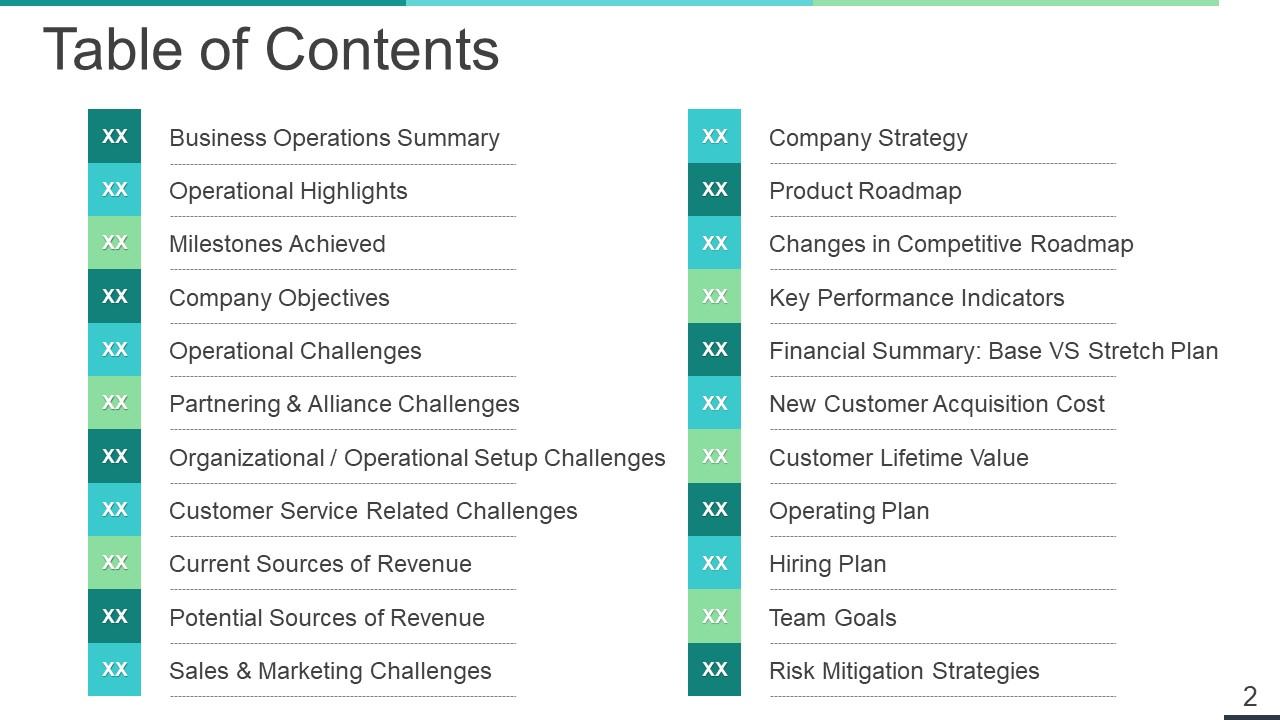
Slide 2: This slide shows Table of Contents with these highlights of the points we have listed- Business Operations Summary, Operational Highlights, Milestones Achieved, Company Objectives, Operational Challenges, Partnering & Alliance Challenges, Organizational / Operational Setup Challenges, Customer Service Related Challenges, Current Sources of Revenue, Potential Sources of Revenue, Sales & Marketing Challenges, Company Strategy, Product Roadmap, Changes in Competitive Roadmap, Key Performance Indicators, Financial Summary: Base VS Stretch Plan, New Customer Acquisition Cost, Customer Lifetime Value, Operating Plan, Hiring Plan, Team Goals, Risk Mitigation Strategies.
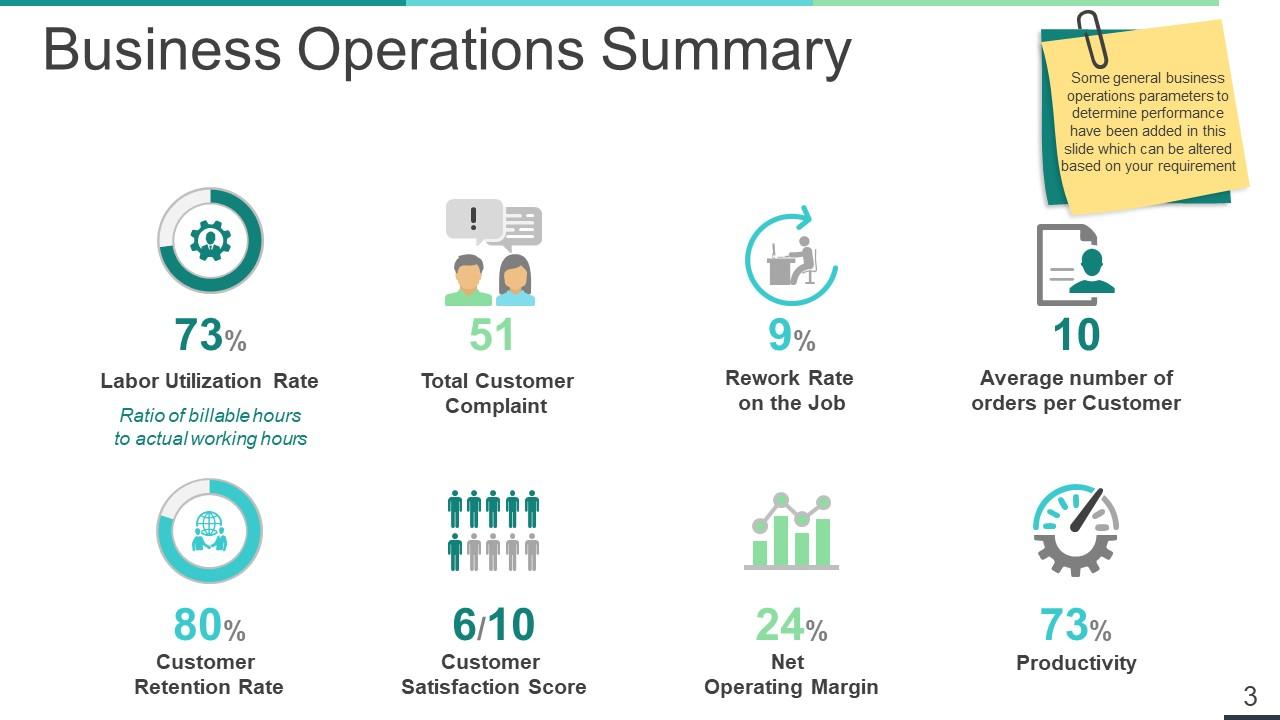
Slide 3: This slide presents Business Operations Summary. Some general business operations parameters to determine performance have been added in this slide which can be altered based on your requirement
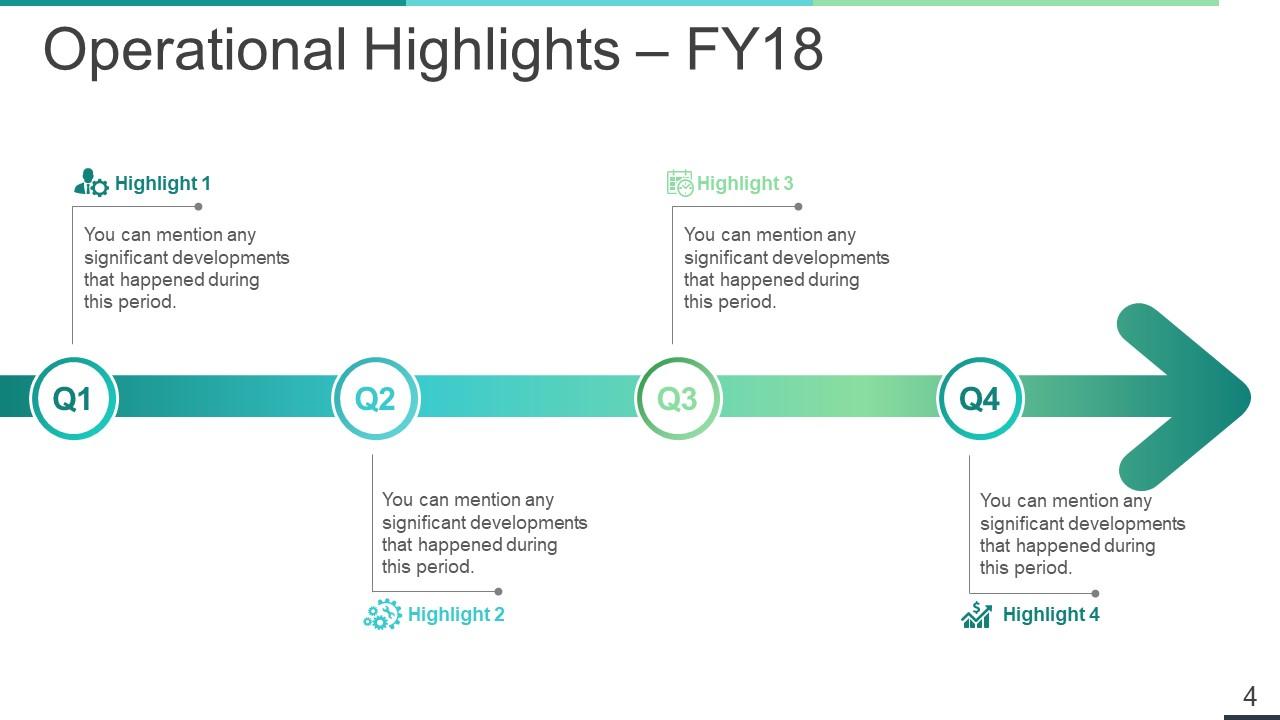
Slide 4: This slide showcases Operational Highlights.
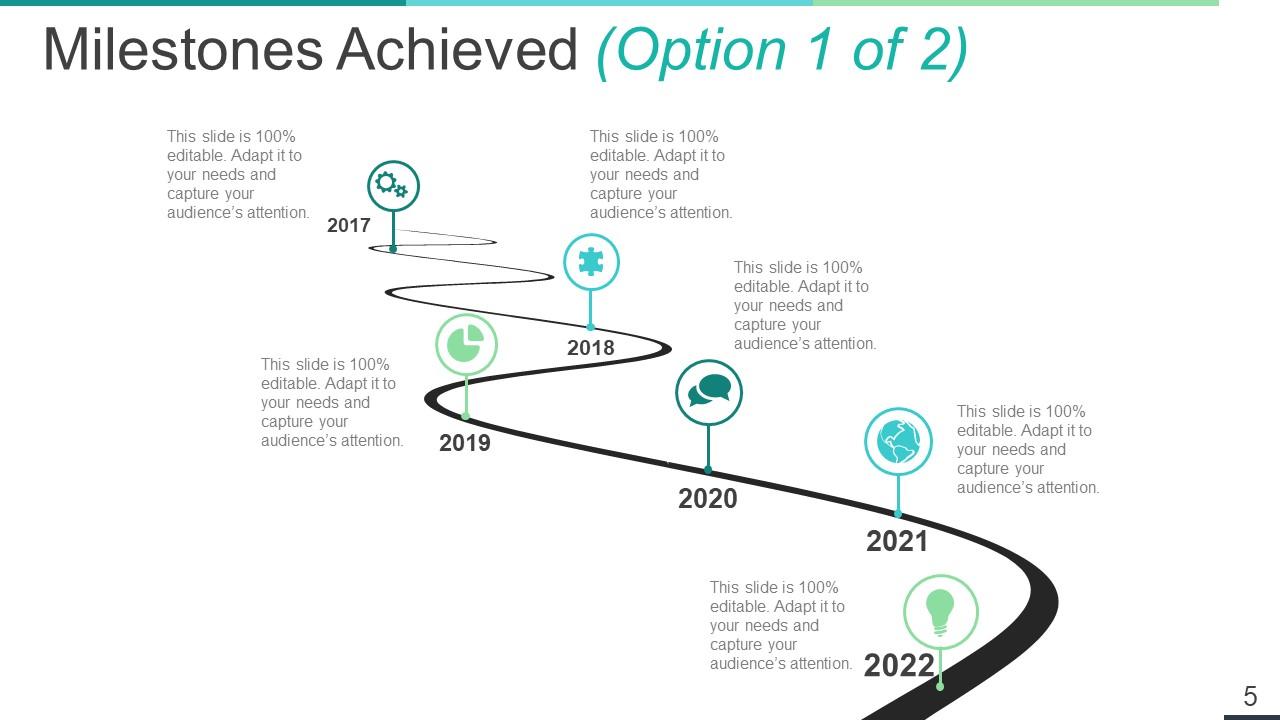
Slide 5: This slide presents Milestones Achieved (Option 1 of 2).
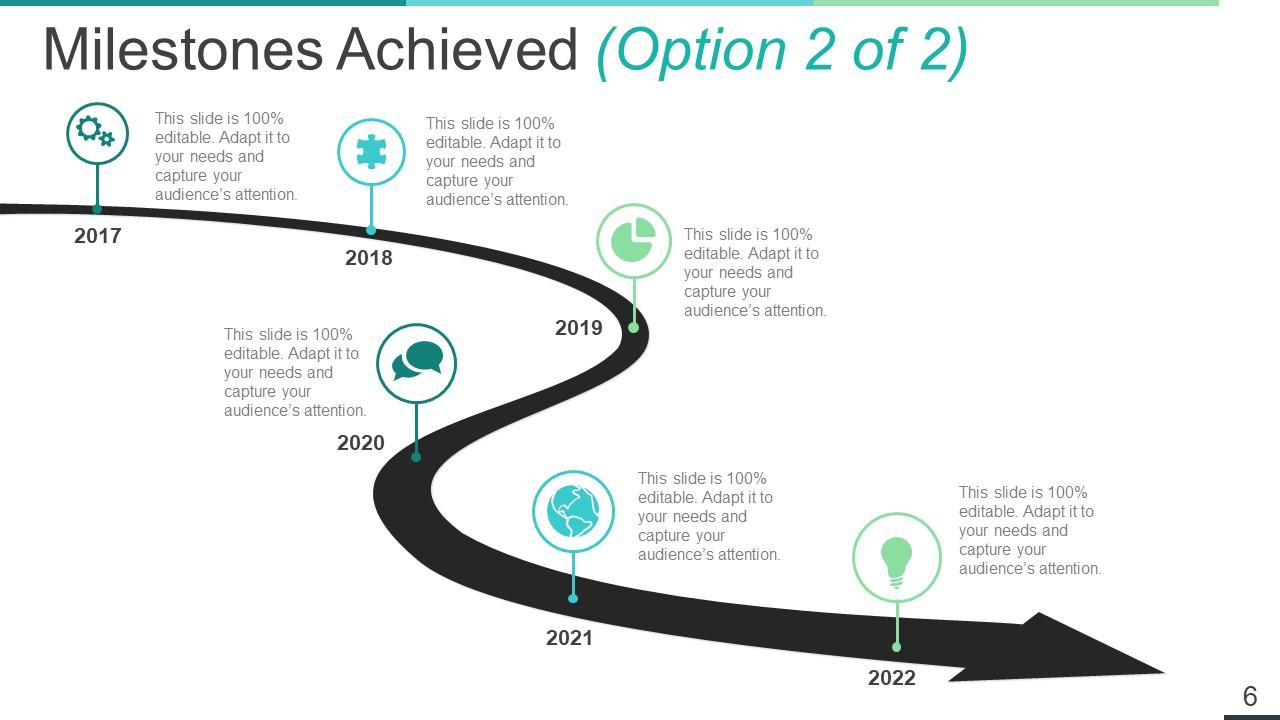
Slide 6: This slide shows Milestones Achieved (Option 2 of 2) with a circular timeline.
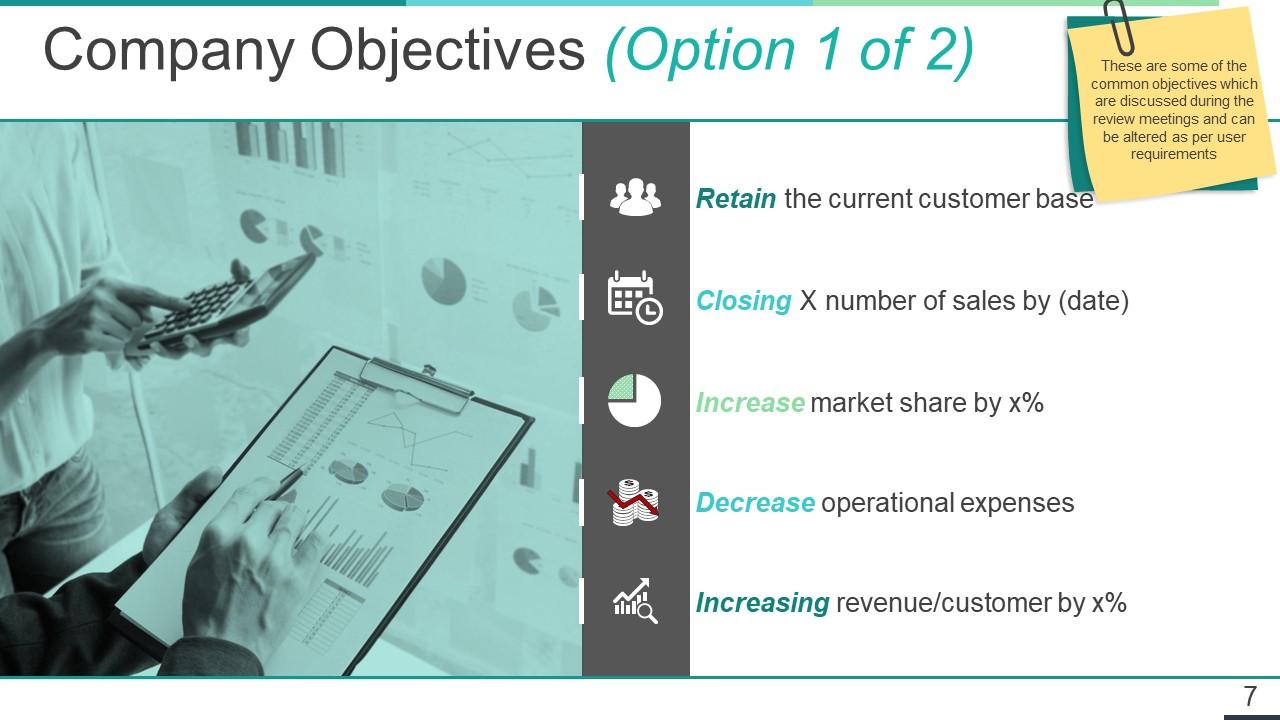
Slide 7: This slide presents Company Objectives (Option 1 of 2) with these of the points we have listed- Retain the current customer base, Increase market share by x%, Increasing revenue/customer by x%, Closing X number of sales by (date), Decrease operational expenses, These are some of the common objectives which are discussed during the review meetings and can be altered as per user requirements
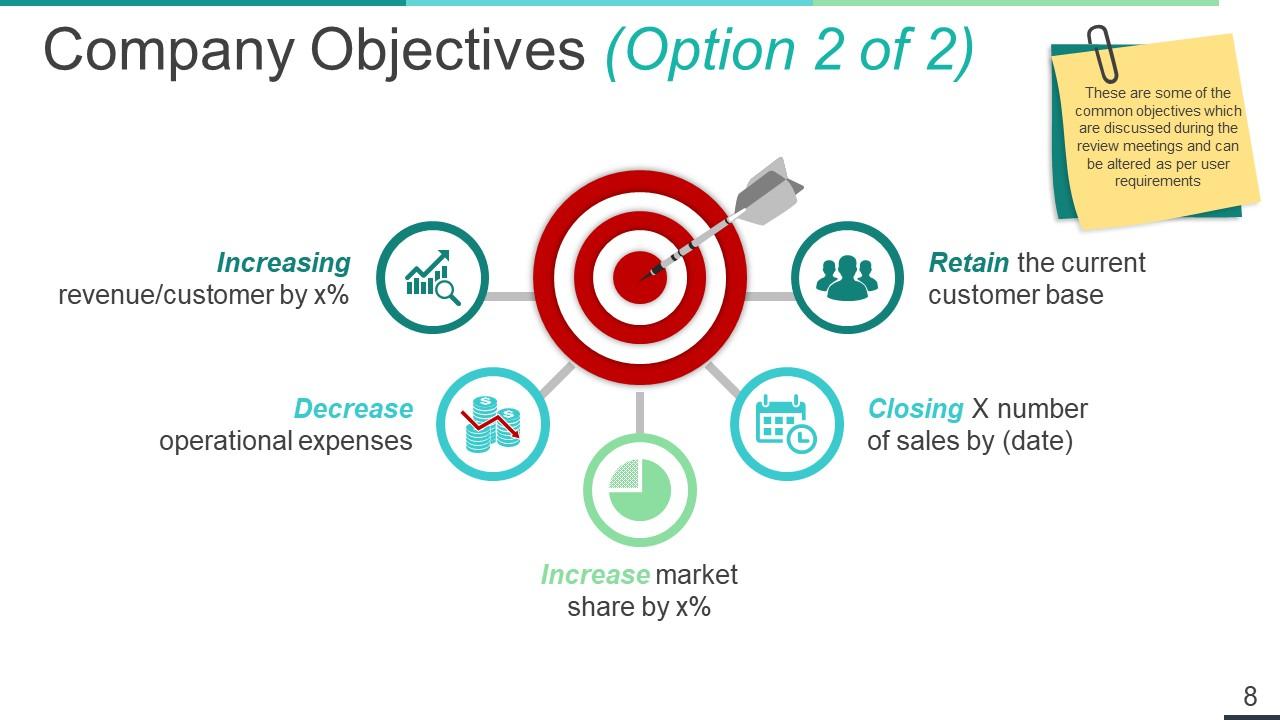
Slide 8: This slide showcases Company Objectives (Option 2 of 2) which further shows- Retain the current customer base, Increase market share by x%, Increasing revenue/customer by x%, Closing X number of sales by (date), Decrease operational expenses, These are some of the common objectives which are discussed during the review meetings and can be altered as per user requirements
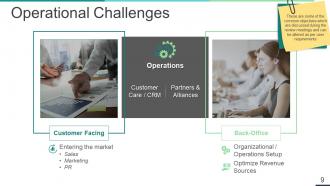
Slide 9: This slide presents Operational Challenges.These are some of the common objectives which are discussed during the review meetings and can be altered as per user requirements
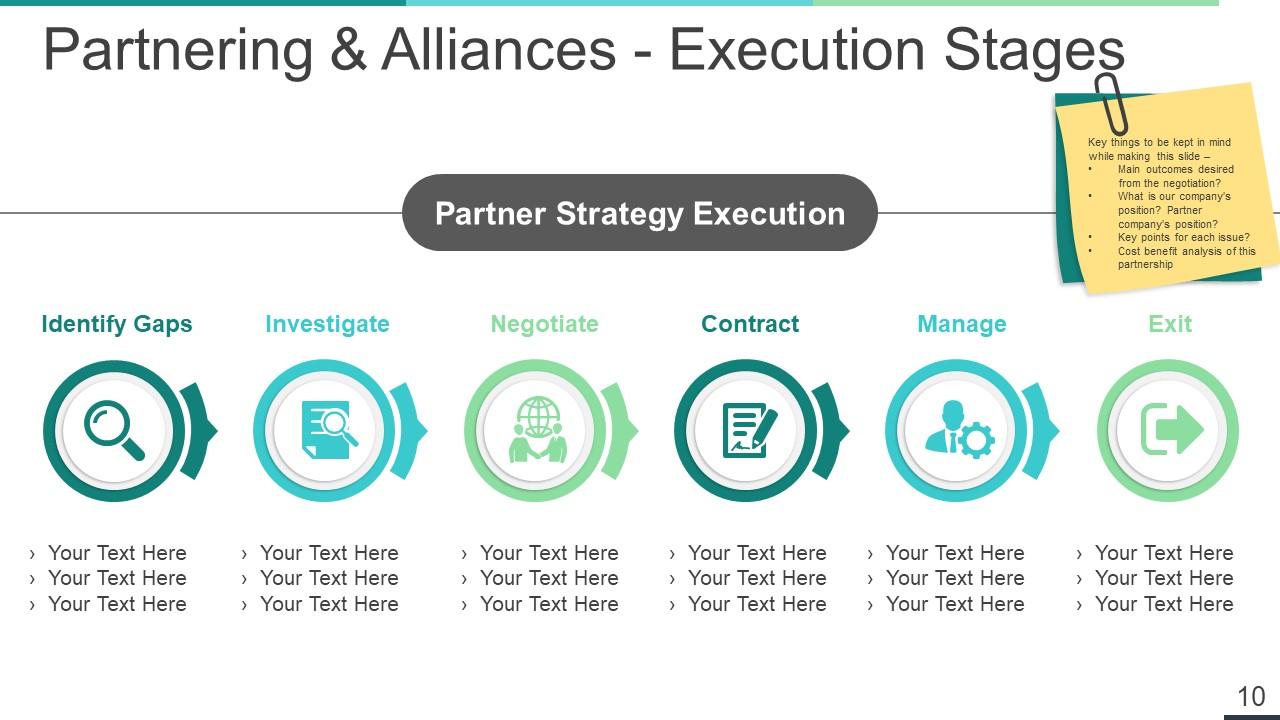
Slide 10: This slide showcases Partnering & Alliances - Execution Stages which further project- Partner Strategy Execution, Identify Gaps, Investigate, Negotiate, Contract, Manage, Exit
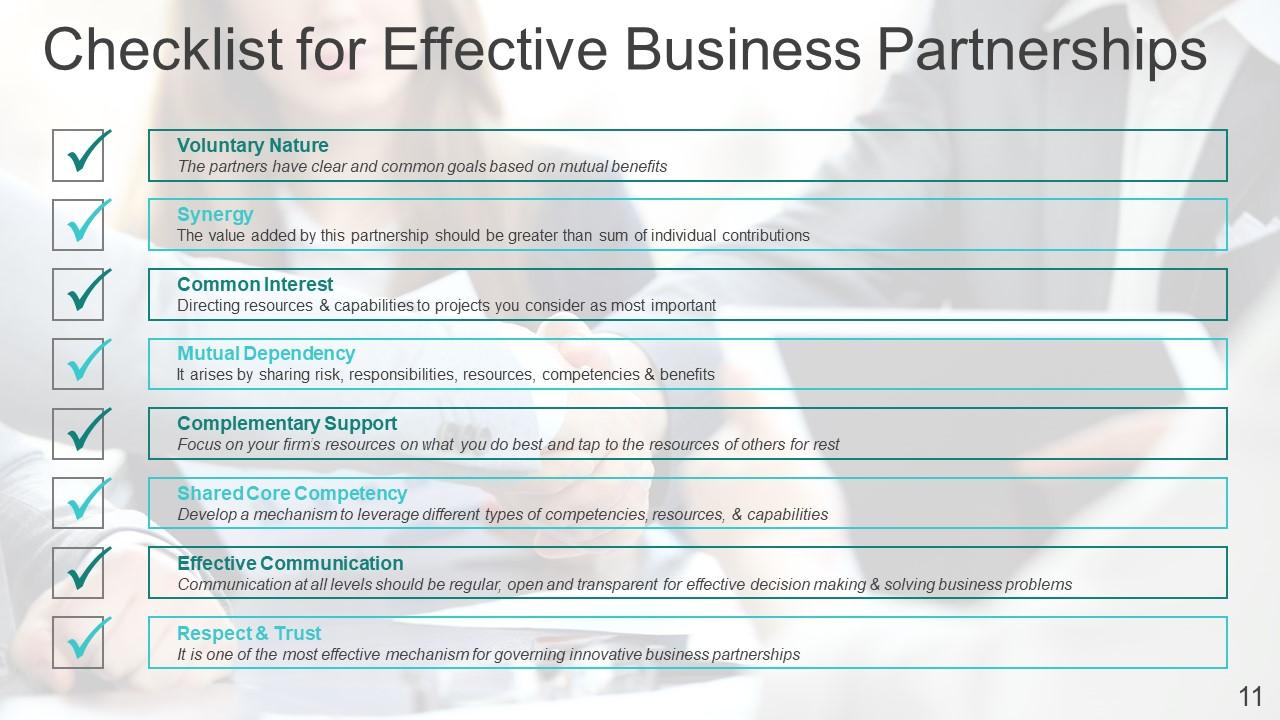
Slide 11: This slide showcases Checklist for Effective Business Partnerships with these of the eight points- Voluntary Nature, Synergy, Mutual Dependency, Respect & Trust, Effective Communication, Shared Core Competency, Complementary Support, Common Interest.
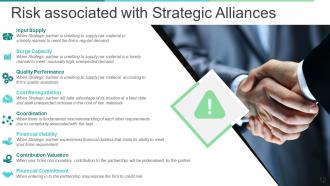
Slide 12: This slide showcases Risk associated with Strategic Alliances with these of the following strategies- Contribution Valuation, Financial Commitment, Financial Viability, Cost Renegotiation, Quality Performance, Surge Capacity, Coordination, Input Supply.
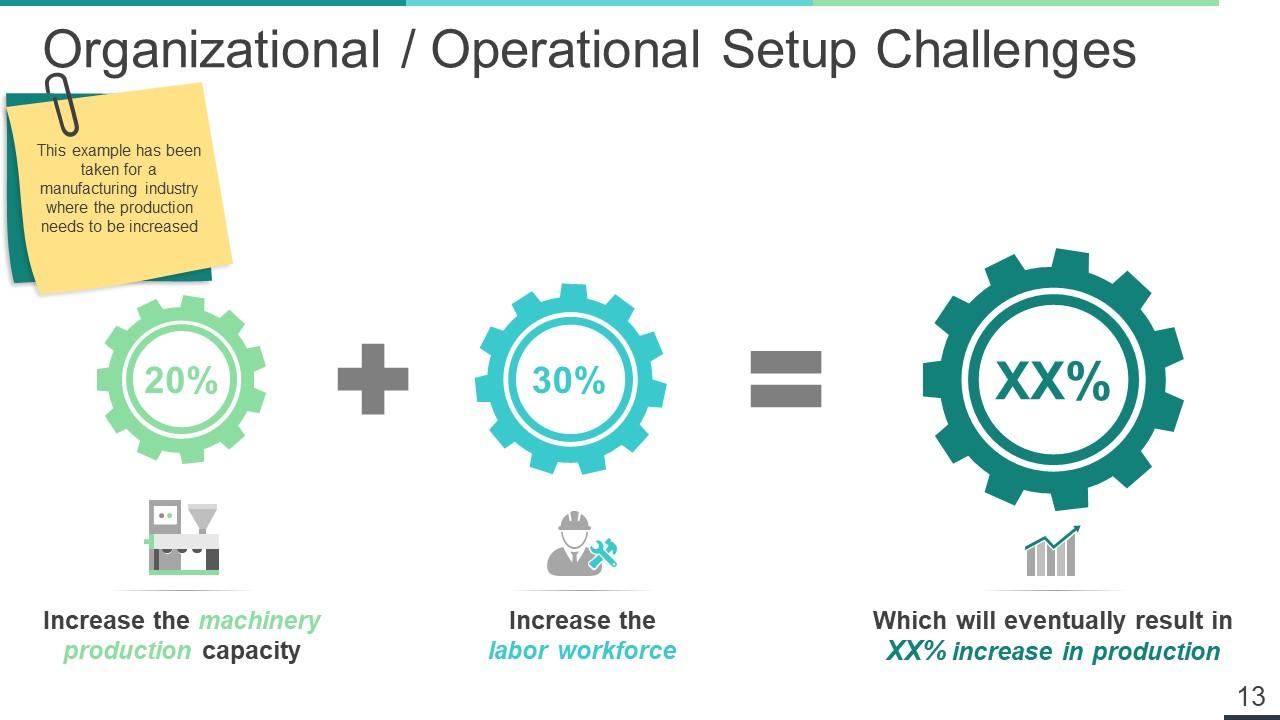
Slide 13: This slide presents Organizational / Operational Setup Challenges. This example has been taken for a manufacturing industry where the production needs to be increased
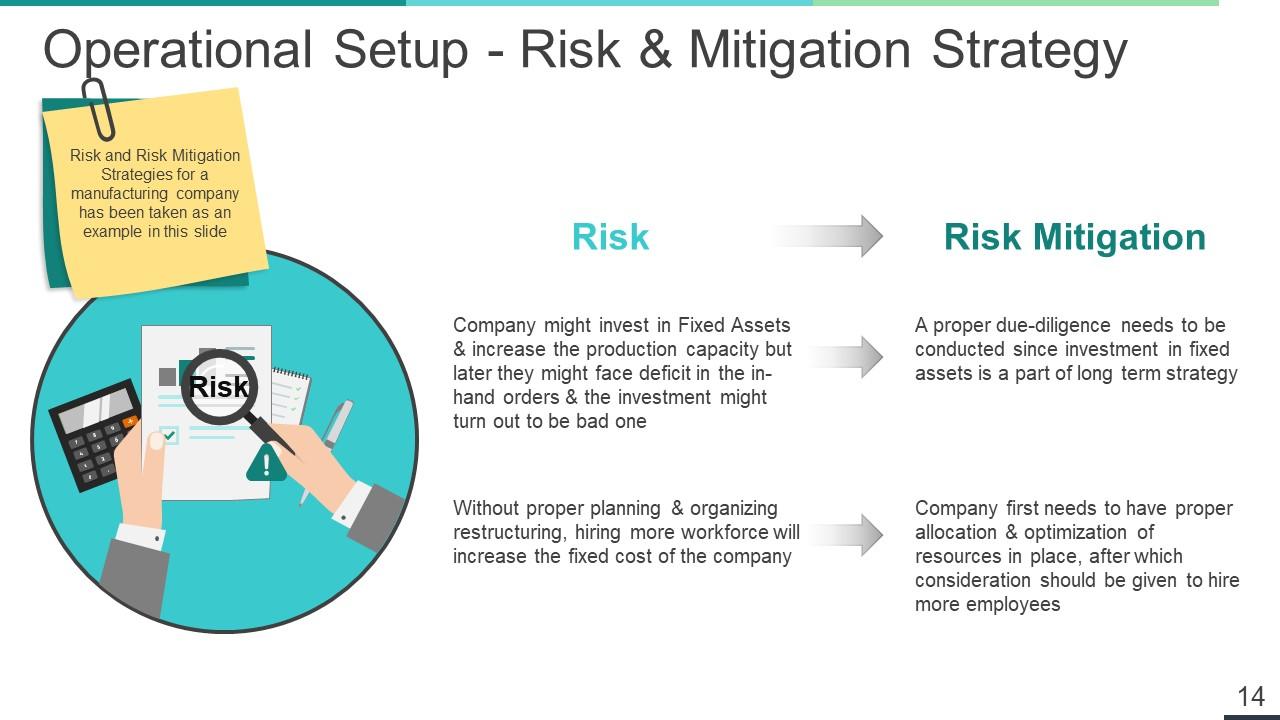
Slide 14: This slide showcases Operational Setup - Risk & Mitigation Strategy. Risk and Risk Mitigation Strategies for a manufacturing company has been taken as an example in this slide
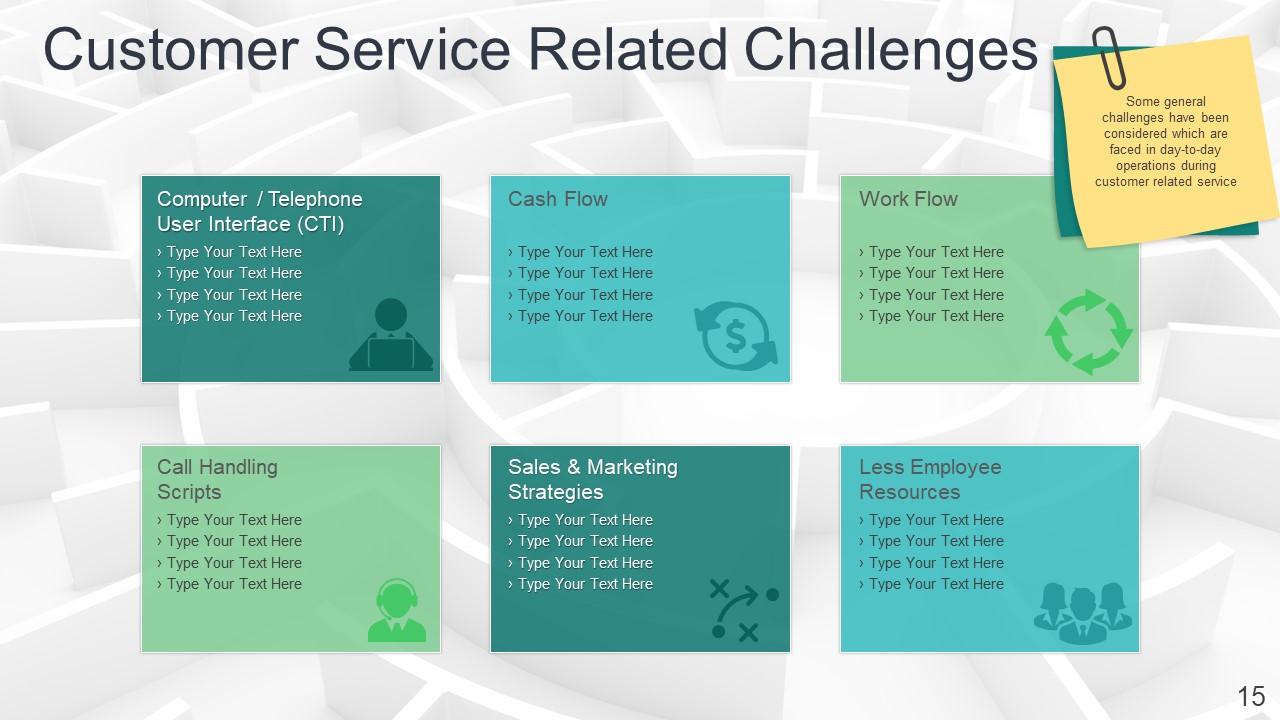
Slide 15: This slide shows Customer Service Related Challenges with these challenges we have projected- Cash Flow, Work Flow, Less Employee Resources, Call Handling Scripts, Computer / Telephone User Interface (CTI), Sales & Marketing Strategies, Some general challenges have been considered which are faced in day-to-day operations during customer related service
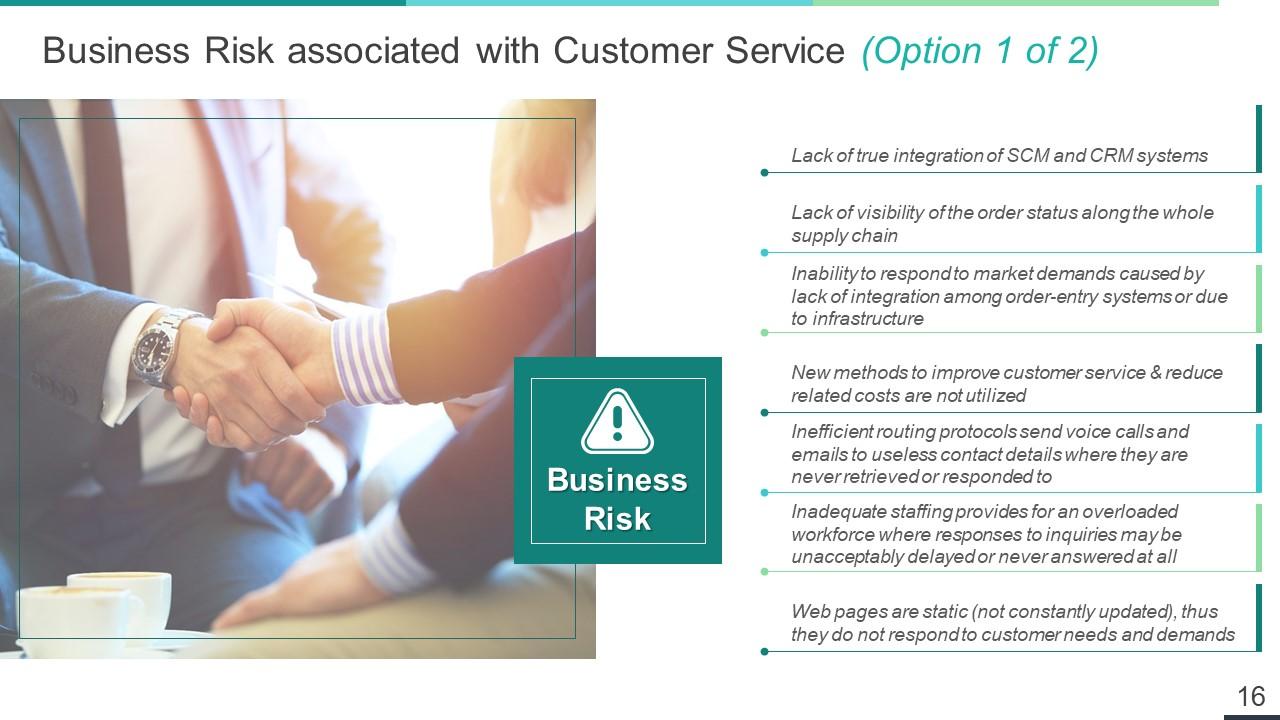
Slide 16: This slide presents Business Risk associated with Customer Service (Option 1 of 2) with the Business Risk.
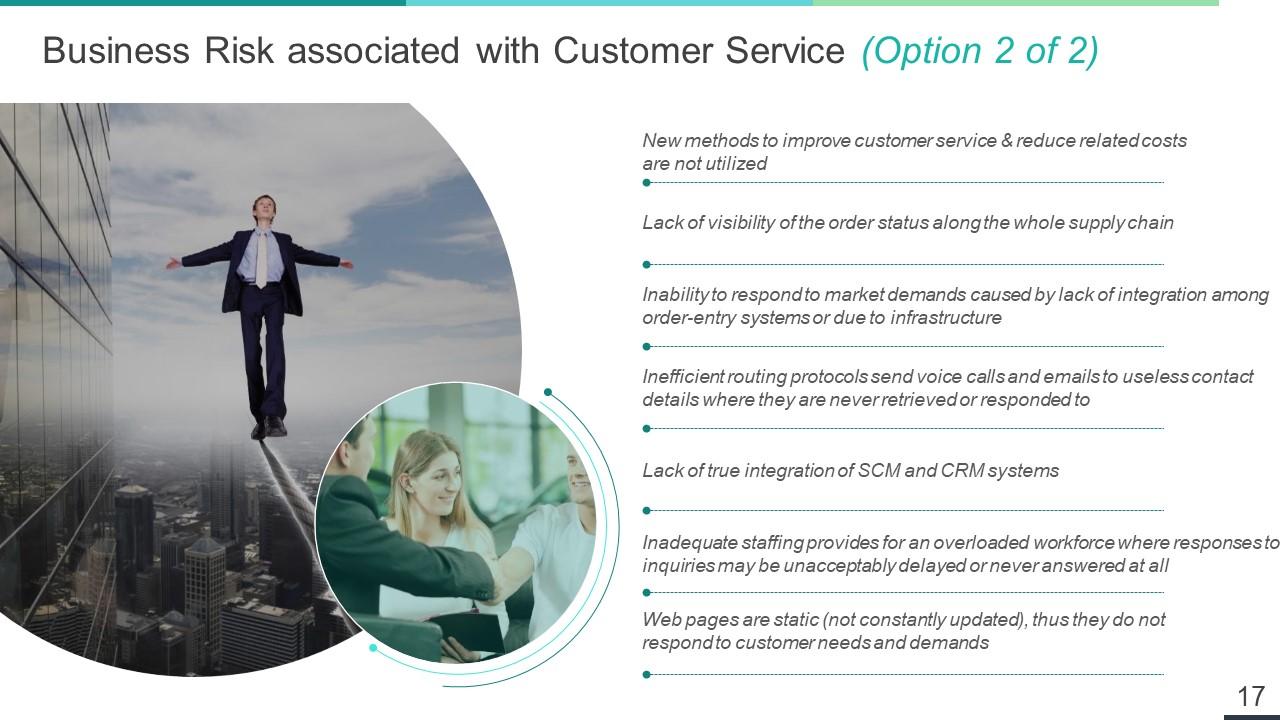
Slide 17: This slide showcases Business Risk associated with Customer Service (Option 2 of 2).
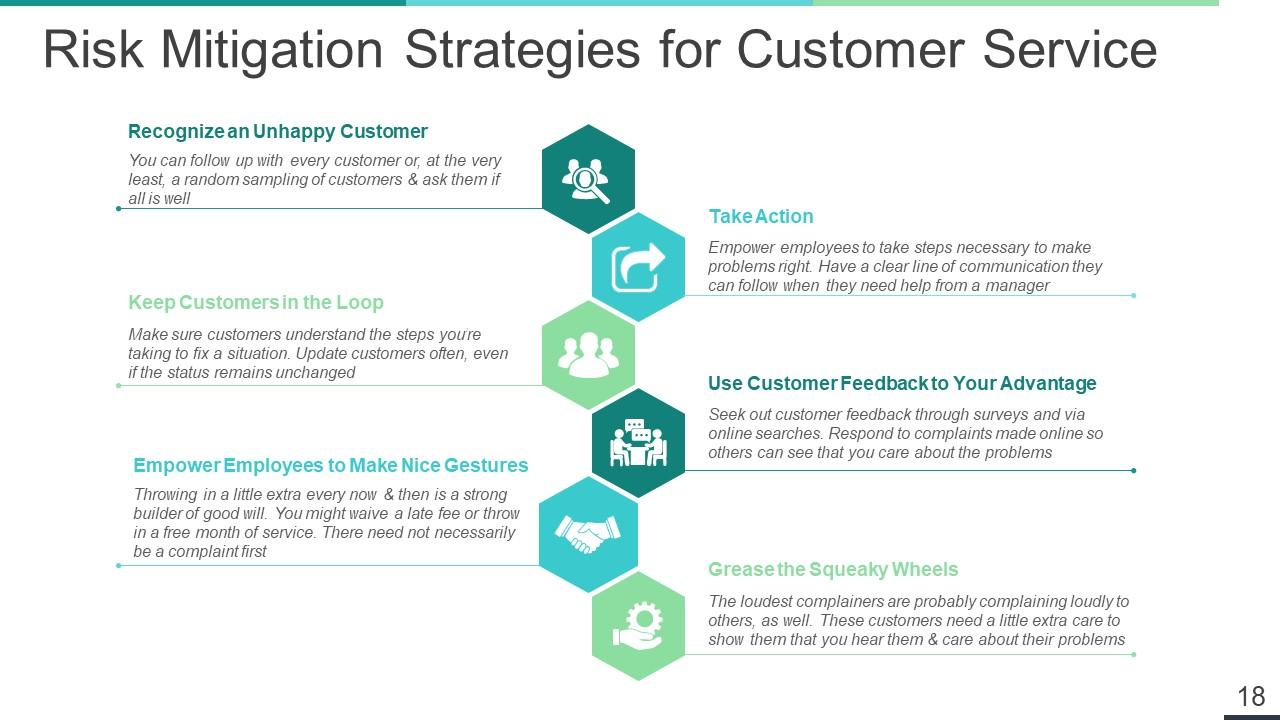
Slide 18: This slide shows Risk Mitigation Strategies for Customer Service some of the parameters- Recognize an Unhappy Customer, Take Action, Keep Customers in the Loop, Use Customer Feedback to Your Advantage.
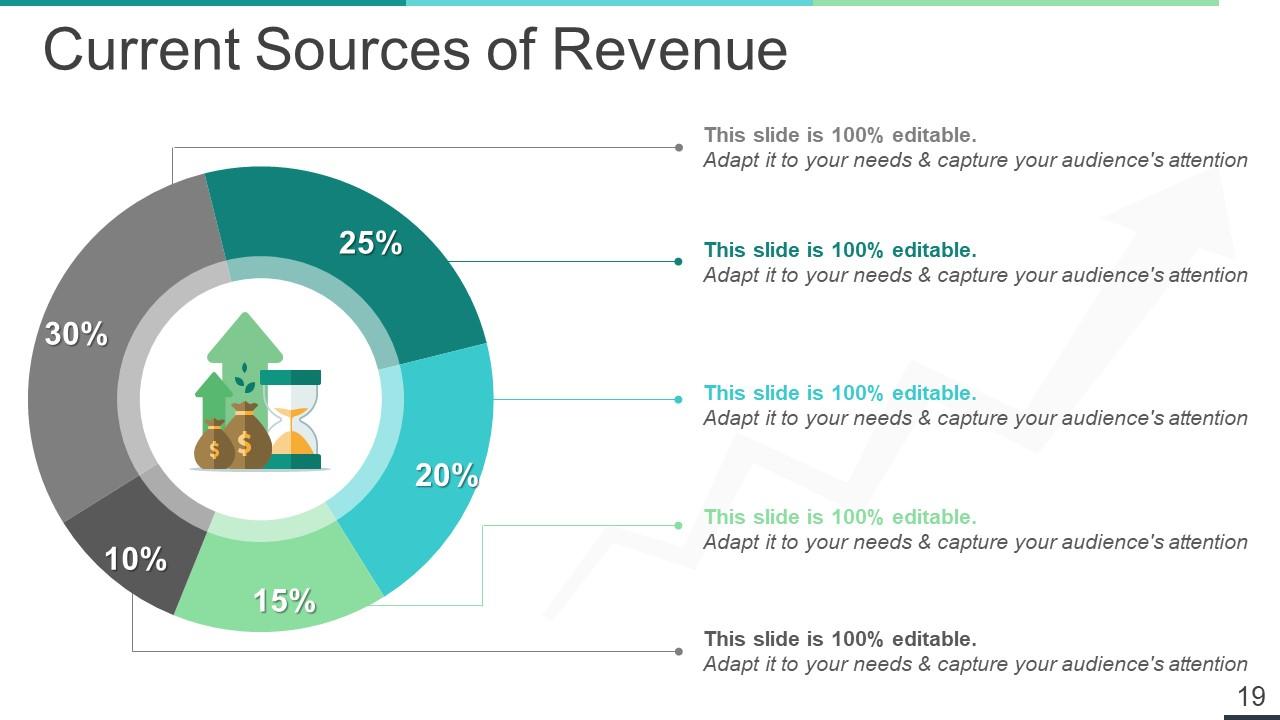
Slide 19: This slide presents Current Sources of Revenue.
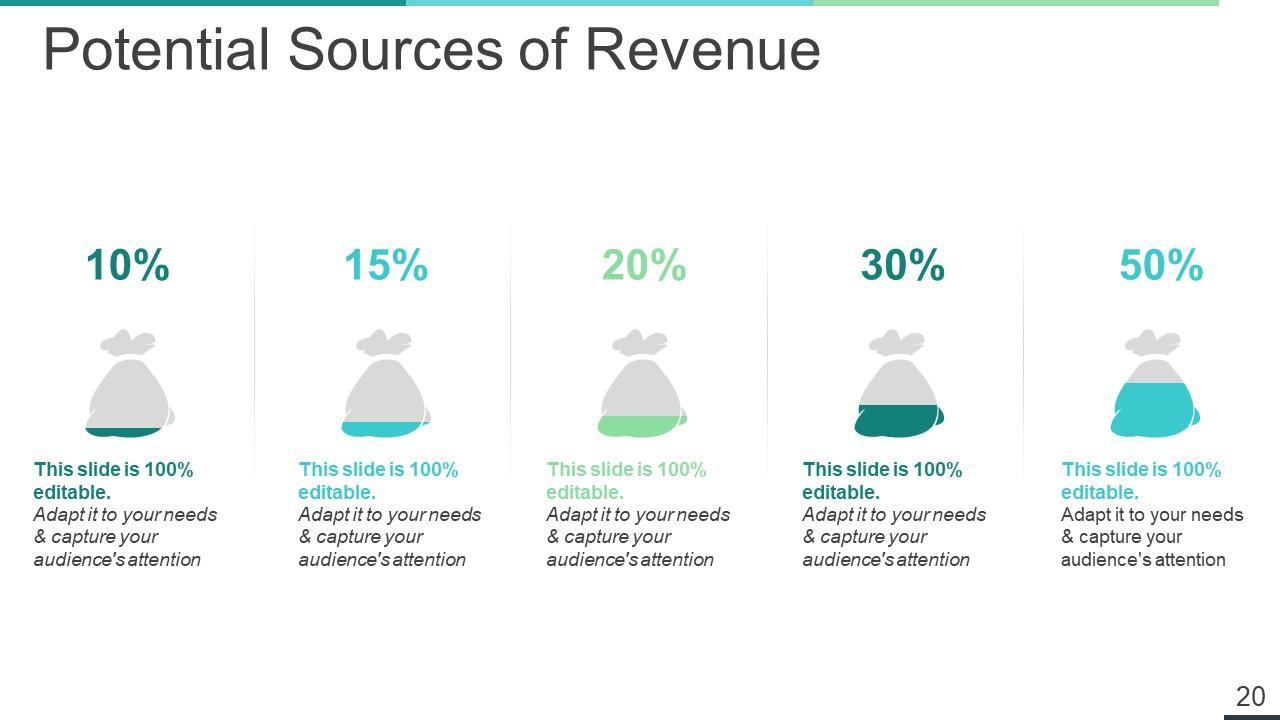
Slide 20: This slide showcases Potential Sources of Revenue.
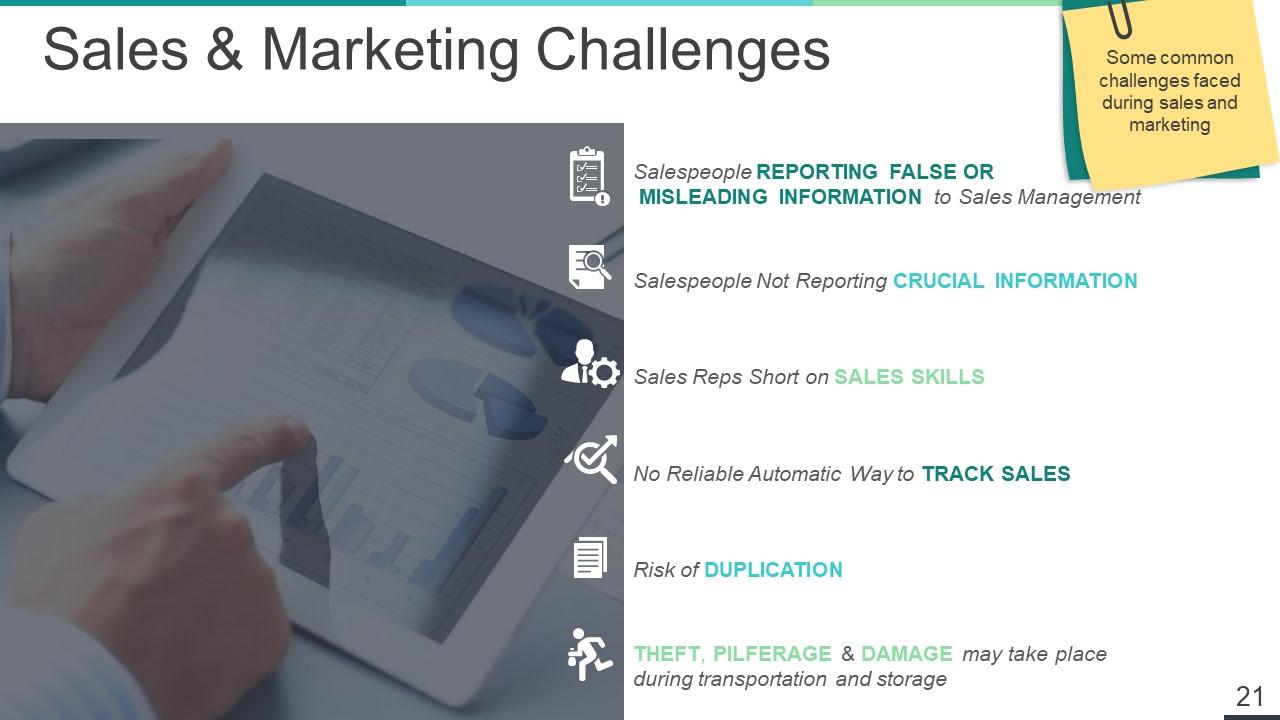
Slide 21: This slide presents Sales & Marketing Challenges. Some common challenges faced during sales and marketing
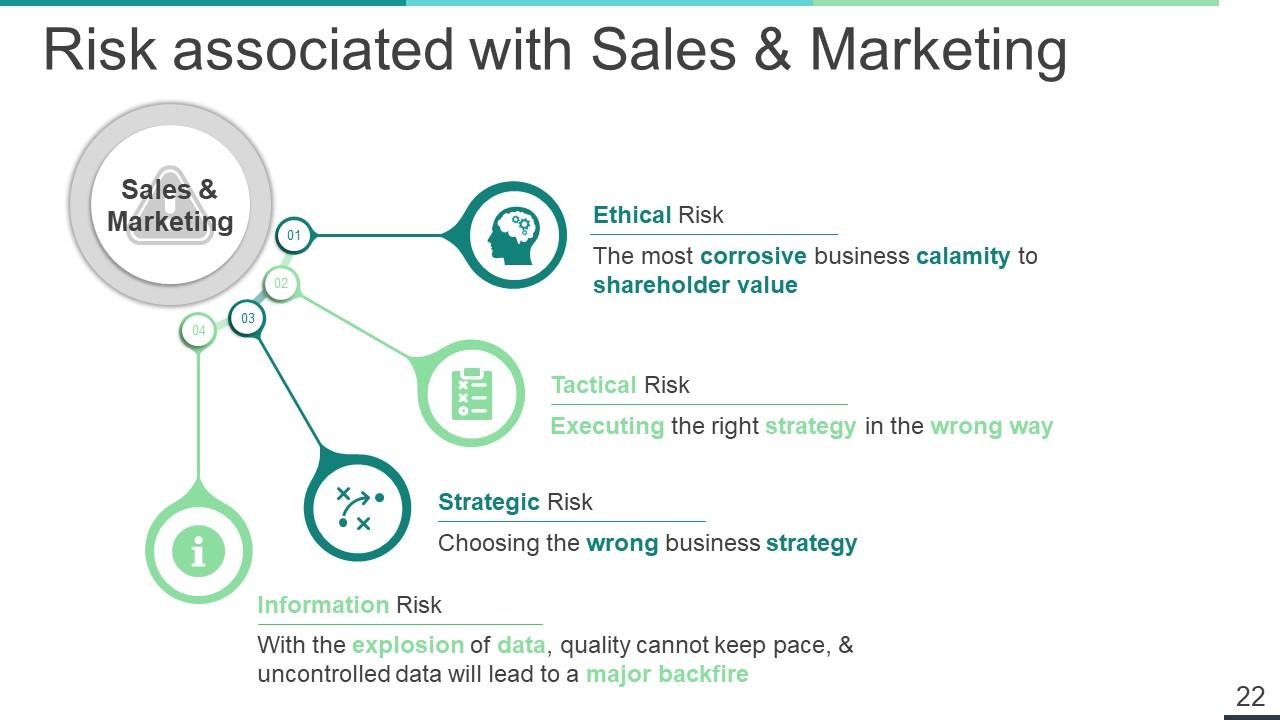
Slide 22: This slide shows Risk associated with Sales & Marketing with these of the factors- Sales & Marketing, Ethical Risk, Tactical Risk, Strategic Risk, Information Risk.
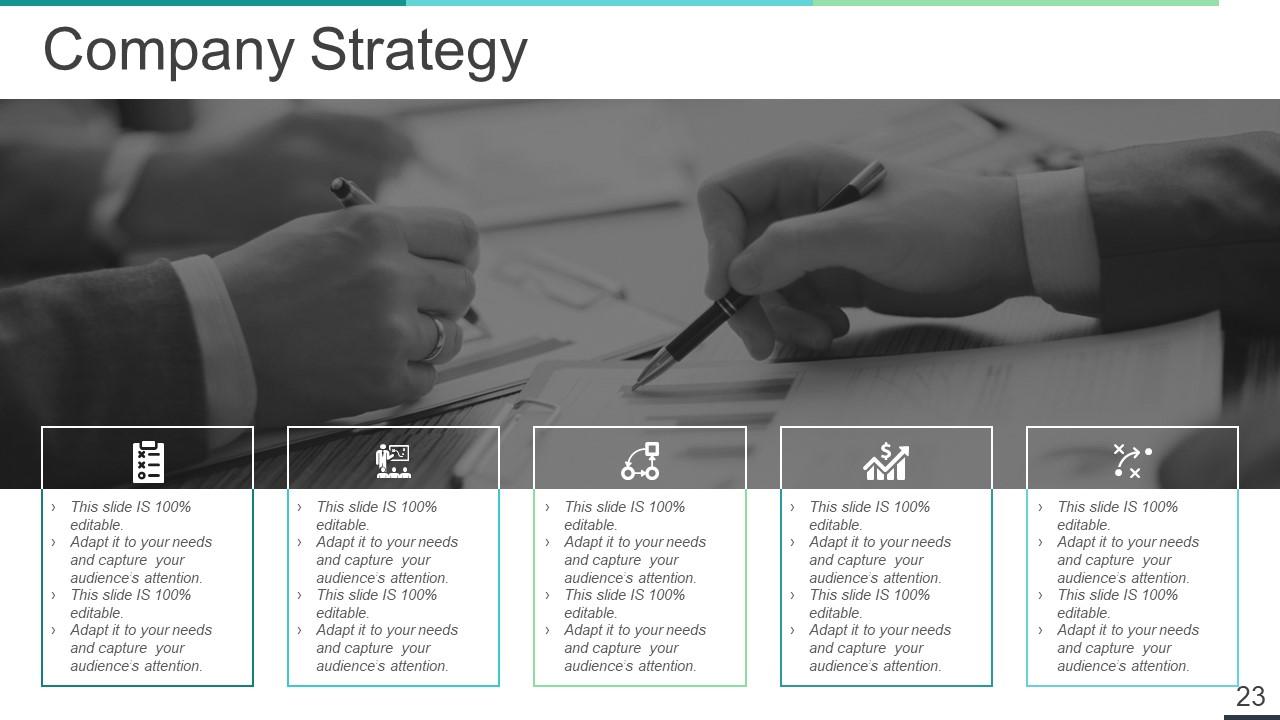
Slide 23: This slide presents Company Strategy.
Slide 24: This slide showcases Product Roadmap - Product Launch Deliverables.
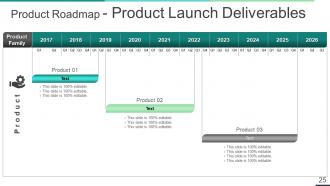
Slide 25: This slide shows Product Roadmap - Product Launch Deliverables.
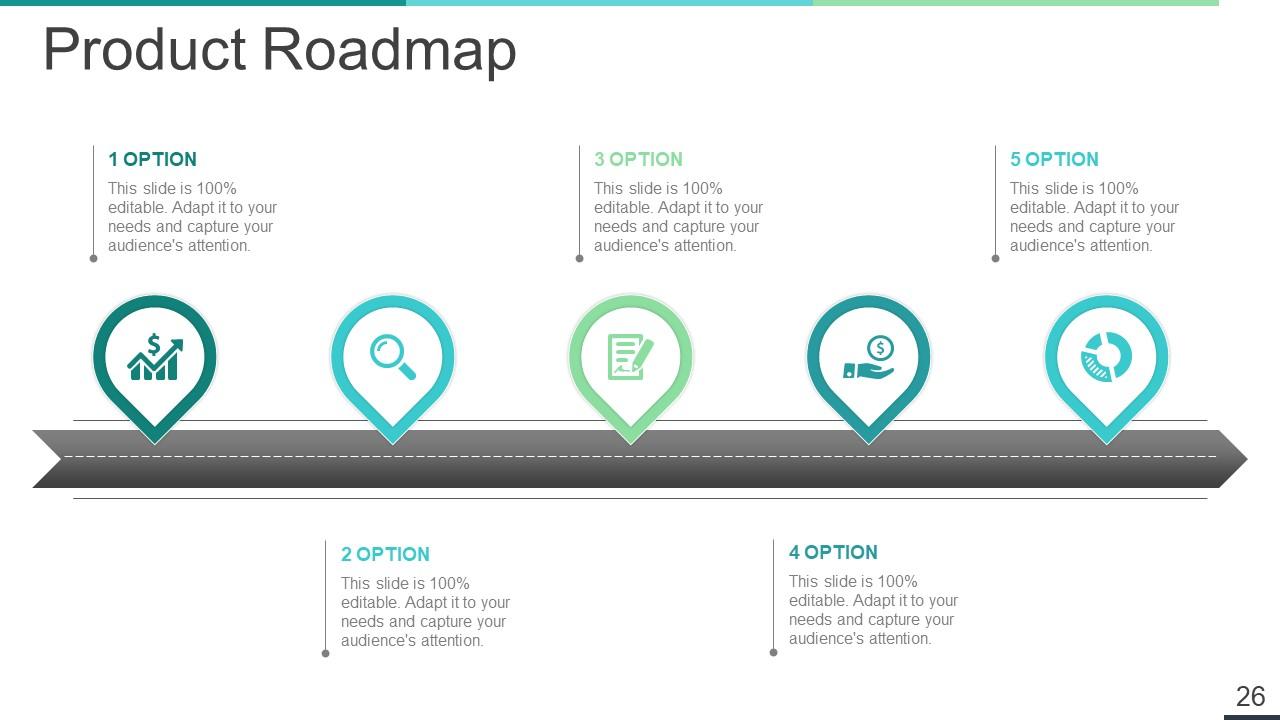
Slide 26: This slide presents Product Roadmap.
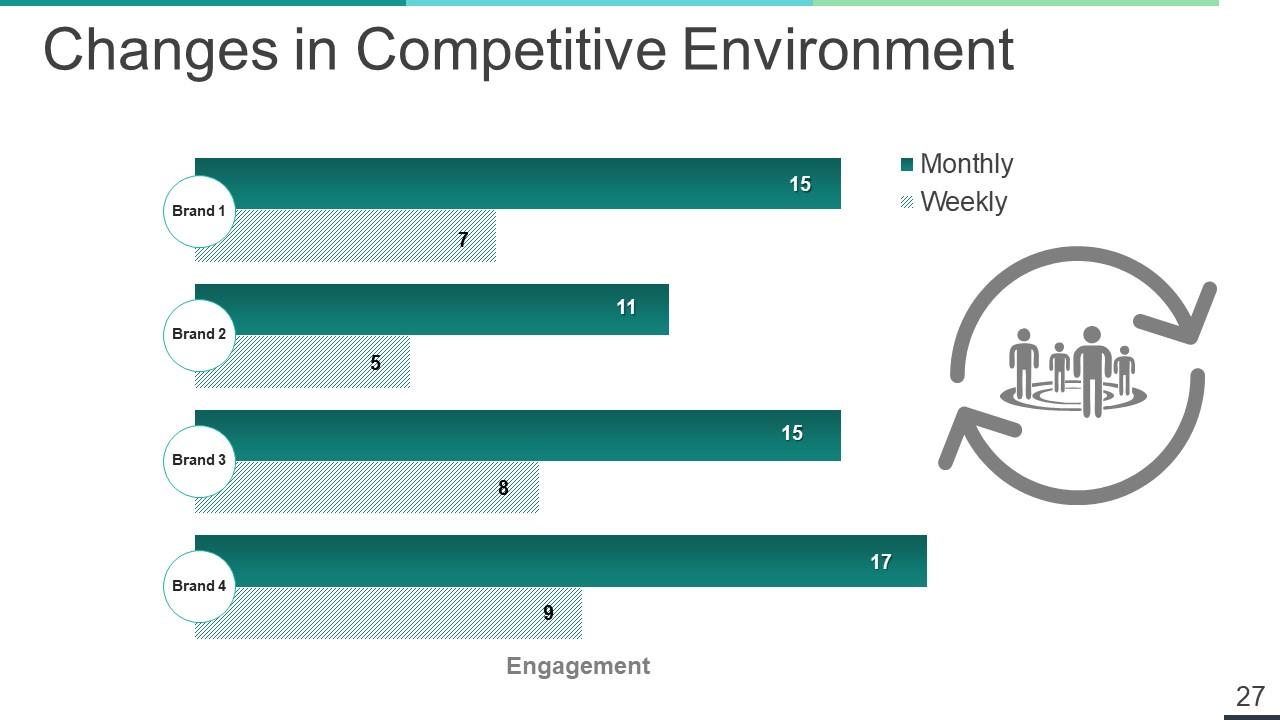
Slide 27: This slide presents Changes in Competitive Environment.
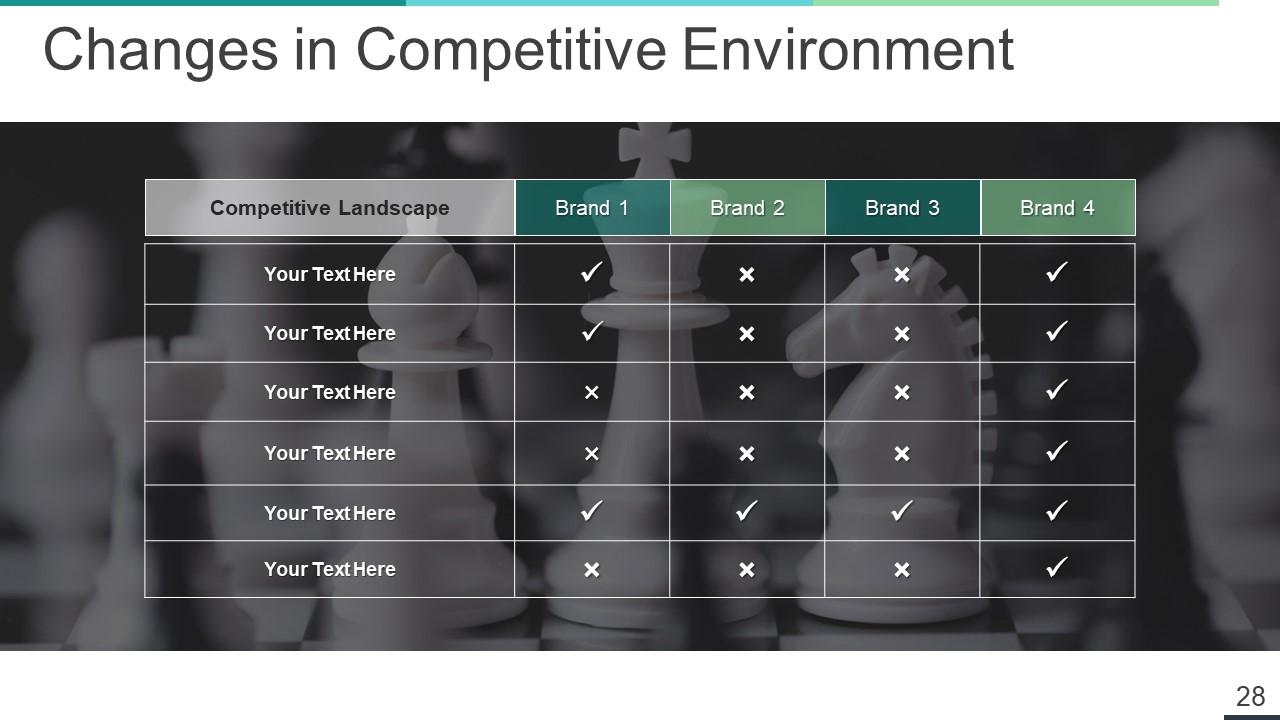
Slide 28: This slide shows Changes in Competitive Environment.
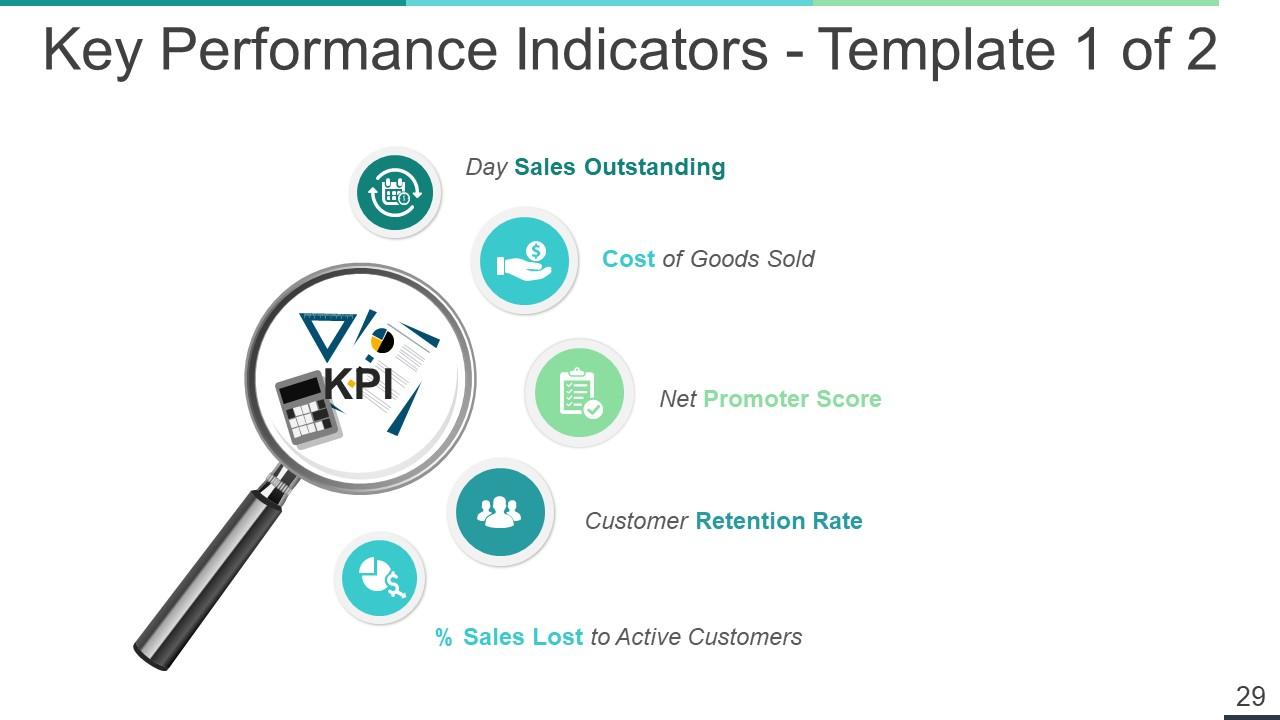
Slide 29: This slide presents Key Performance Indicators - Template 1 of 2 with these of the important factors- Net Promoter Score, Customer Retention Rate, % Sales Lost to Active Customers, Day Sales Outstanding, Cost of Goods Sold, KPI.
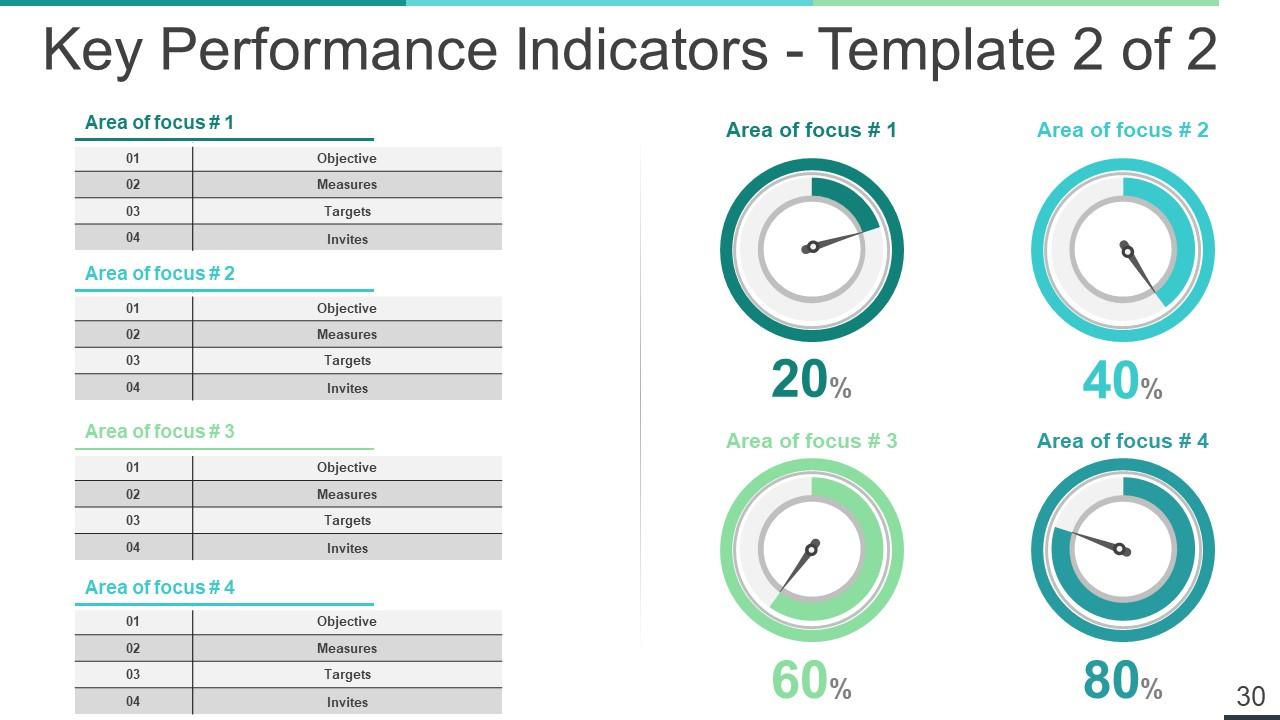
Slide 30: This slide presents Key Performance Indicators - Template 2 of 2.
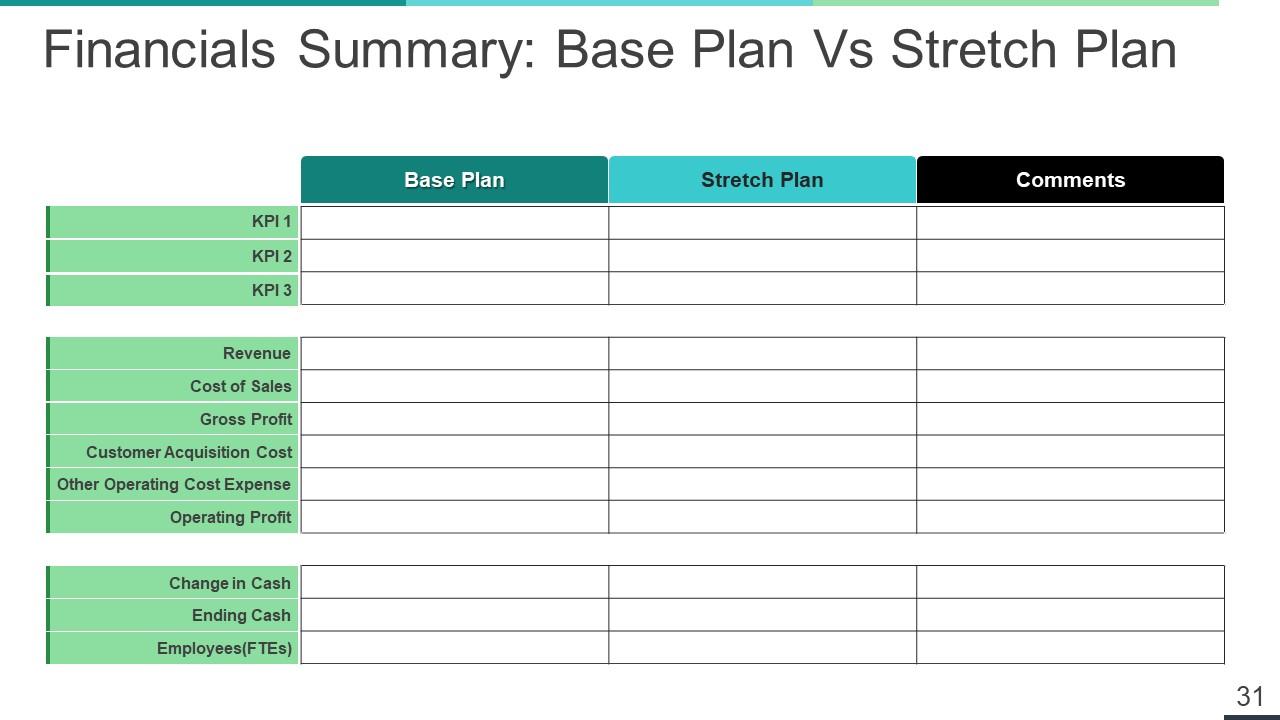
Slide 31: This slide showcases Financials Summary: Base Plan Vs Stretch Plan table.
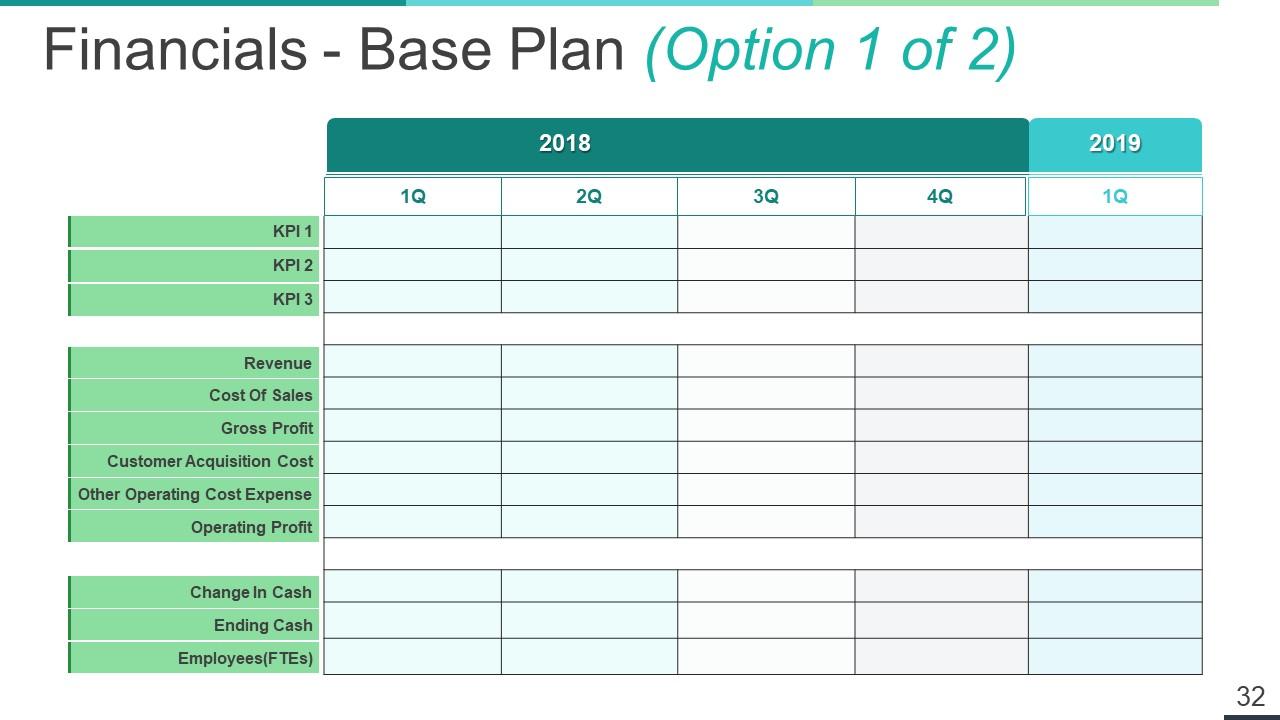
Slide 32: This slide shows Financials - Base Plan (Option 1 of 2).
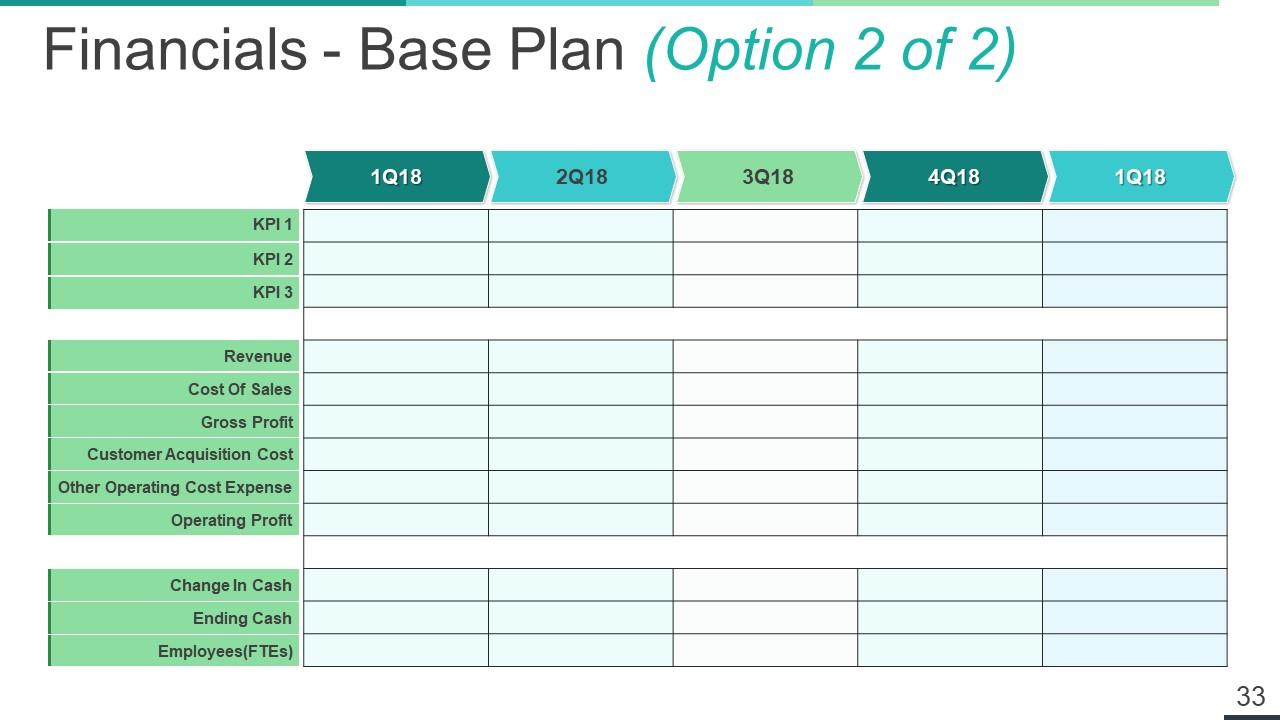
Slide 33: This slide presents Financials - Base Plan (Option 2 of 2).
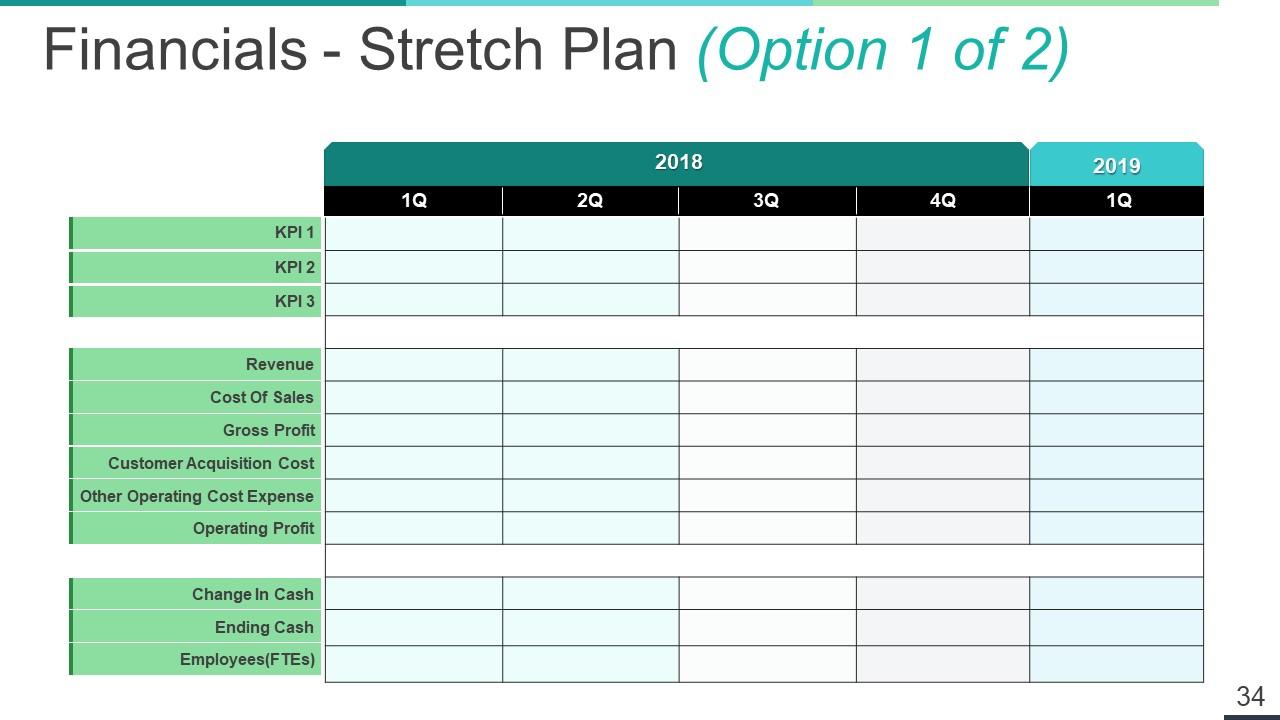
Slide 34: This slide shows Financials - Stretch Plan (Option 1 of 2) table.
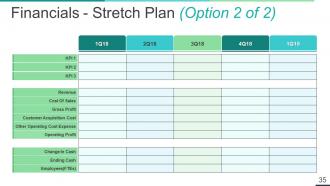
Slide 35: This slide presents Financials - Stretch Plan (Option 2 of 2) with these of the following characteristics- Revenue, Cost Of Sales, Gross Profit, Customer Acquisition Cost, Operating Profit, Change In Cash, Ending Cash, Employees(FTEs), Other Operating Cost Expense.
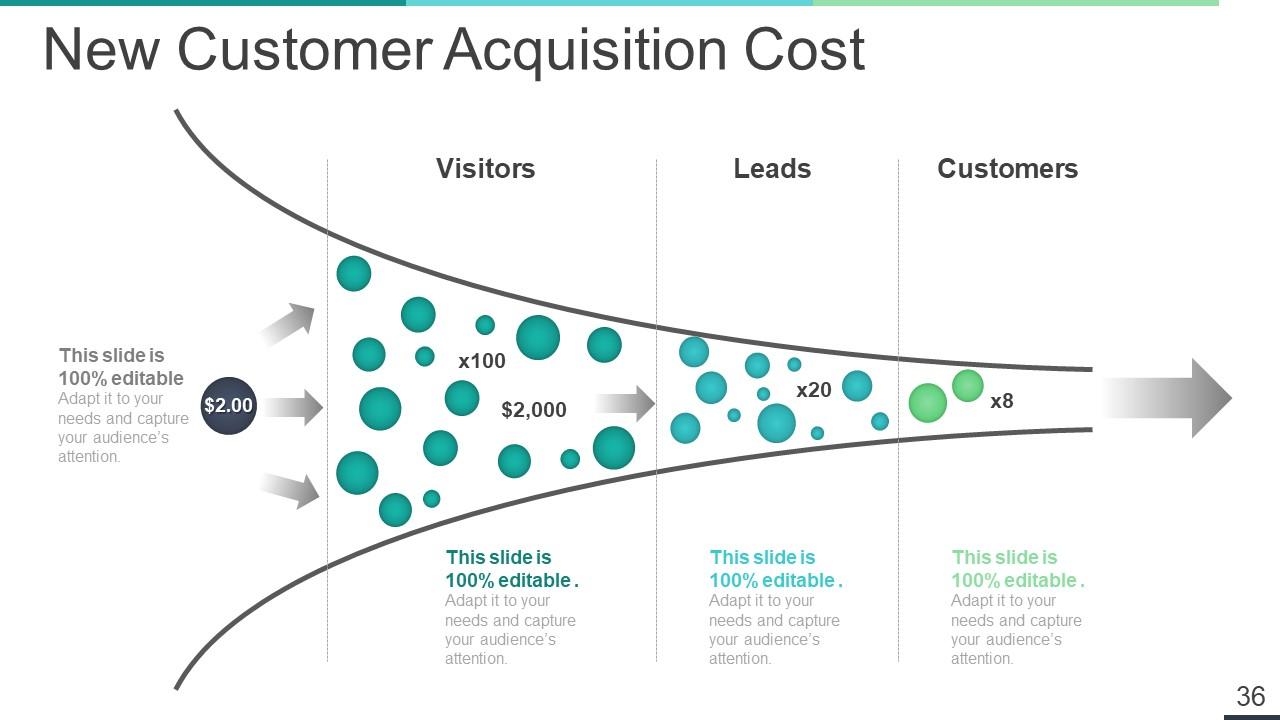
Slide 36: This slide presents New Customer Acquisition Cost with these of the three fatcors- Visitors, Leads, Customers.
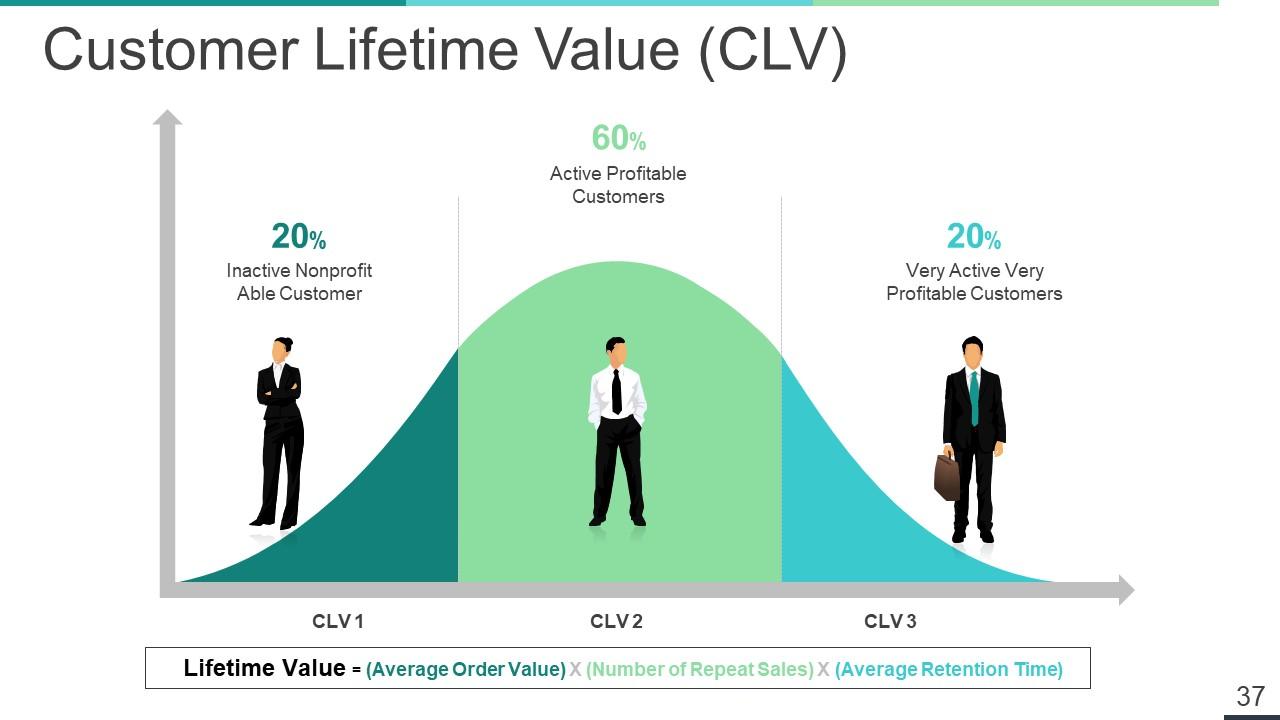
Slide 37: This slide showcases Customer Lifetime Value (CLV).
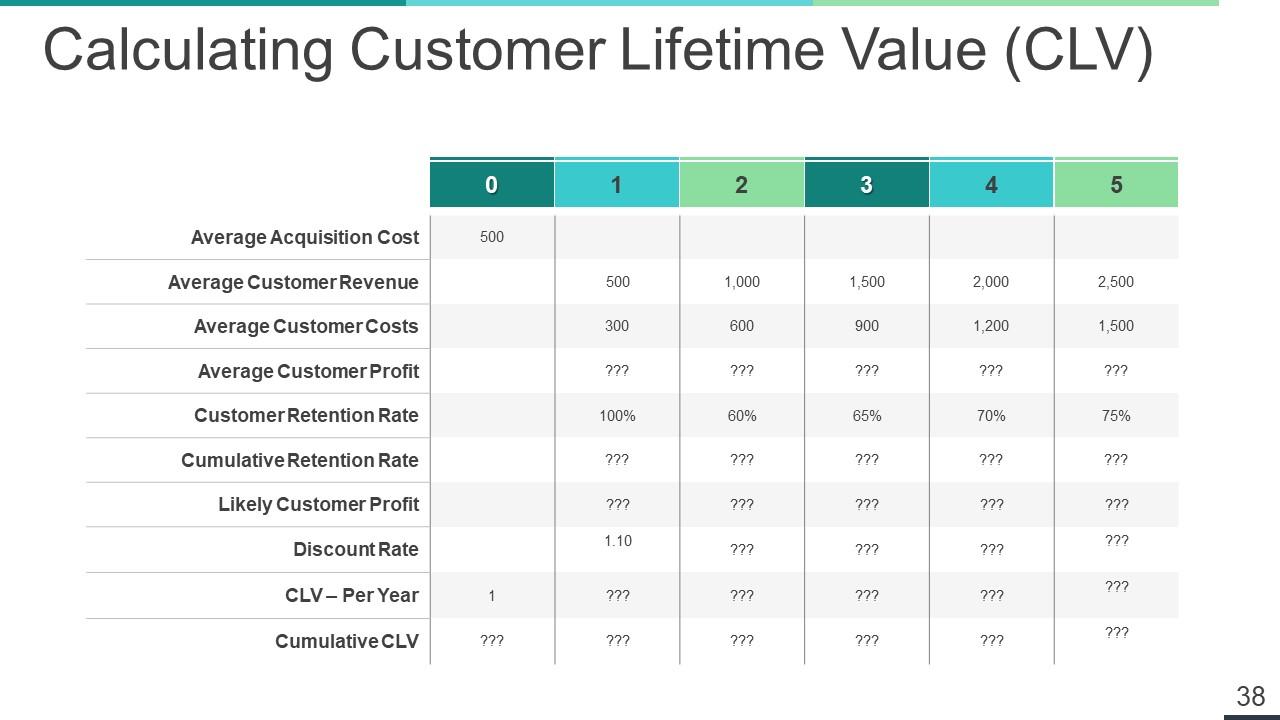
Slide 38: This slide presents Calculating Customer Lifetime Value (CLV) table.
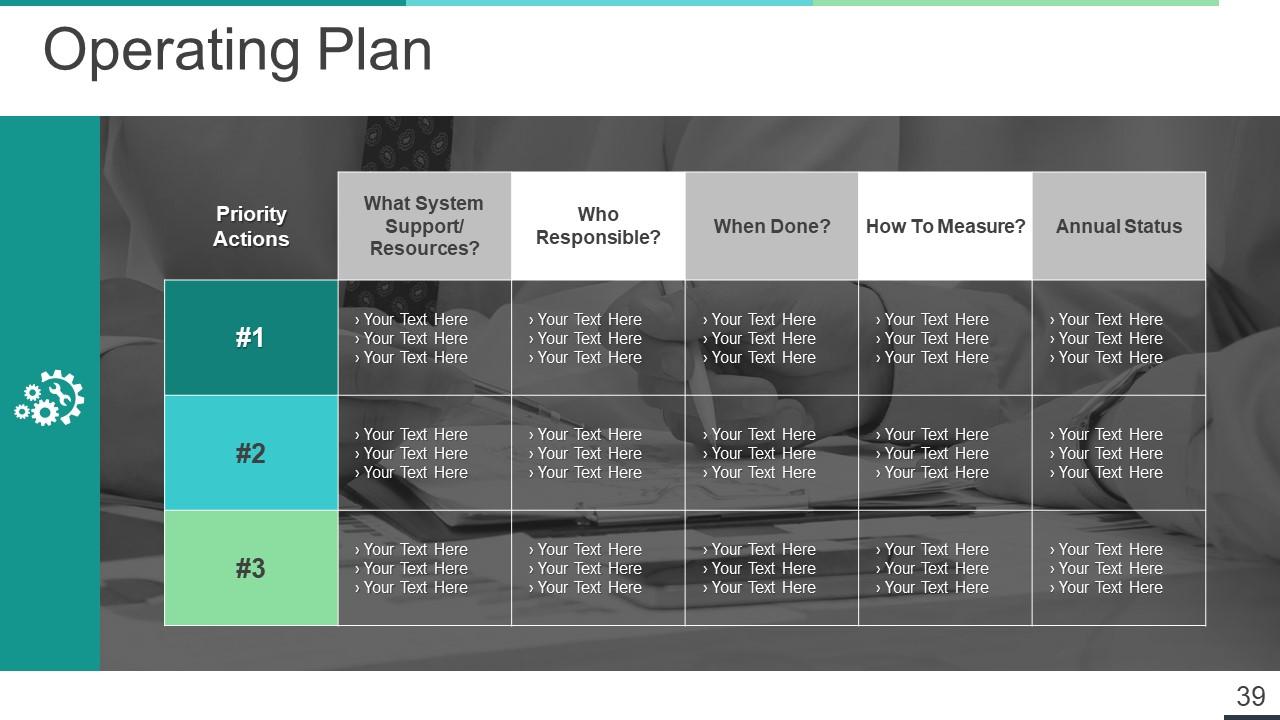
Slide 39: This slide shows Operating Plan table. You can add the data and use it.
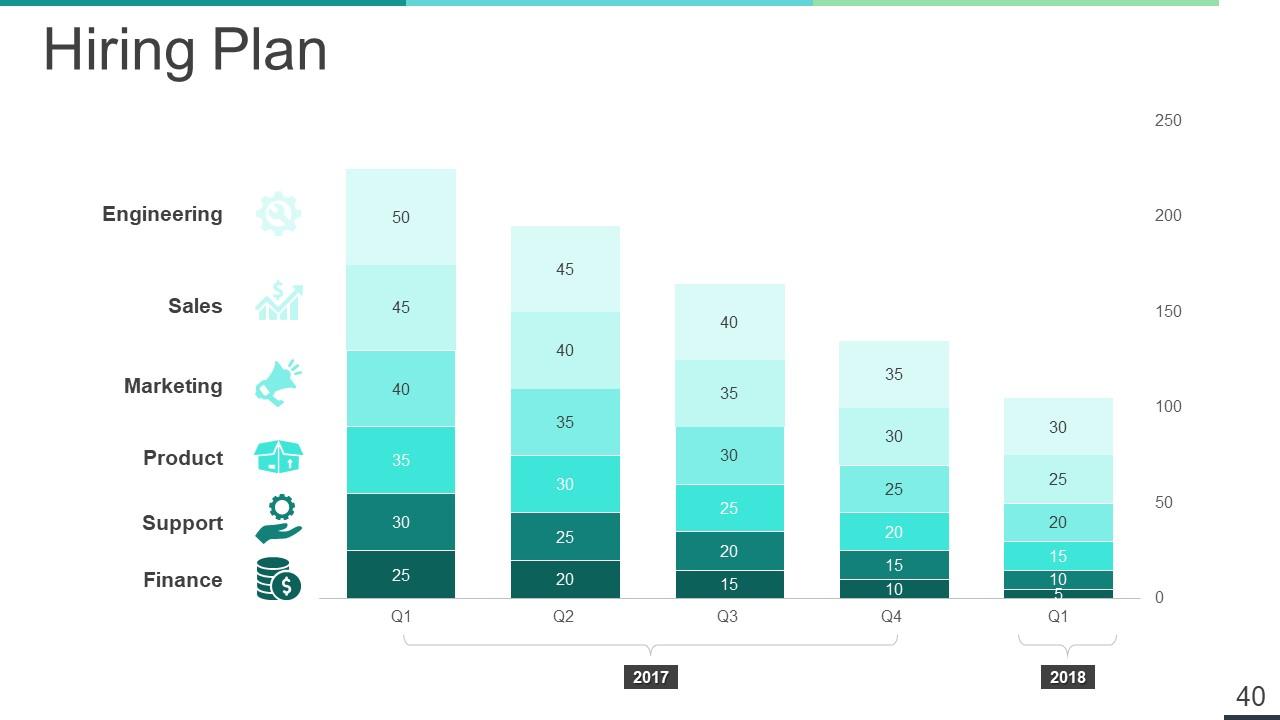
Slide 40: This slide showcases Hiring Plan with these of the few of the Engineering, Sales, Marketing, Product, Support, Finance.
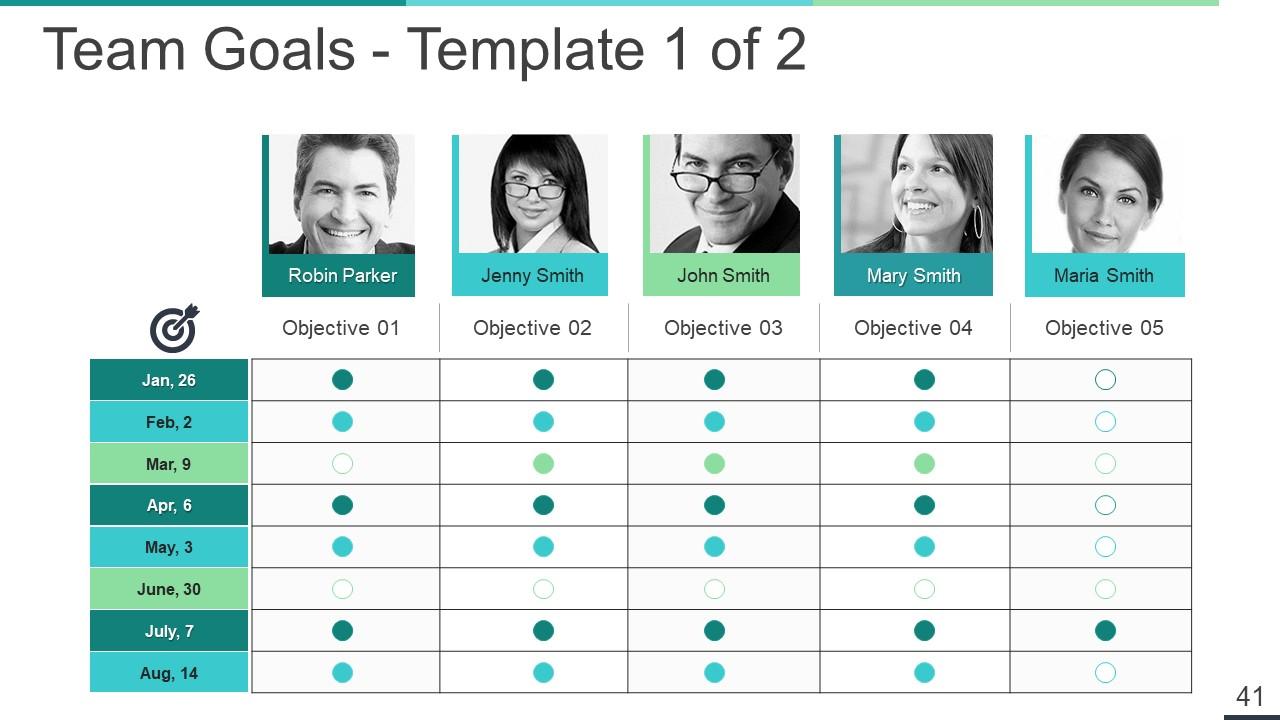
Slide 41: Thi slide presents Team Goals - Template 1 of 2.
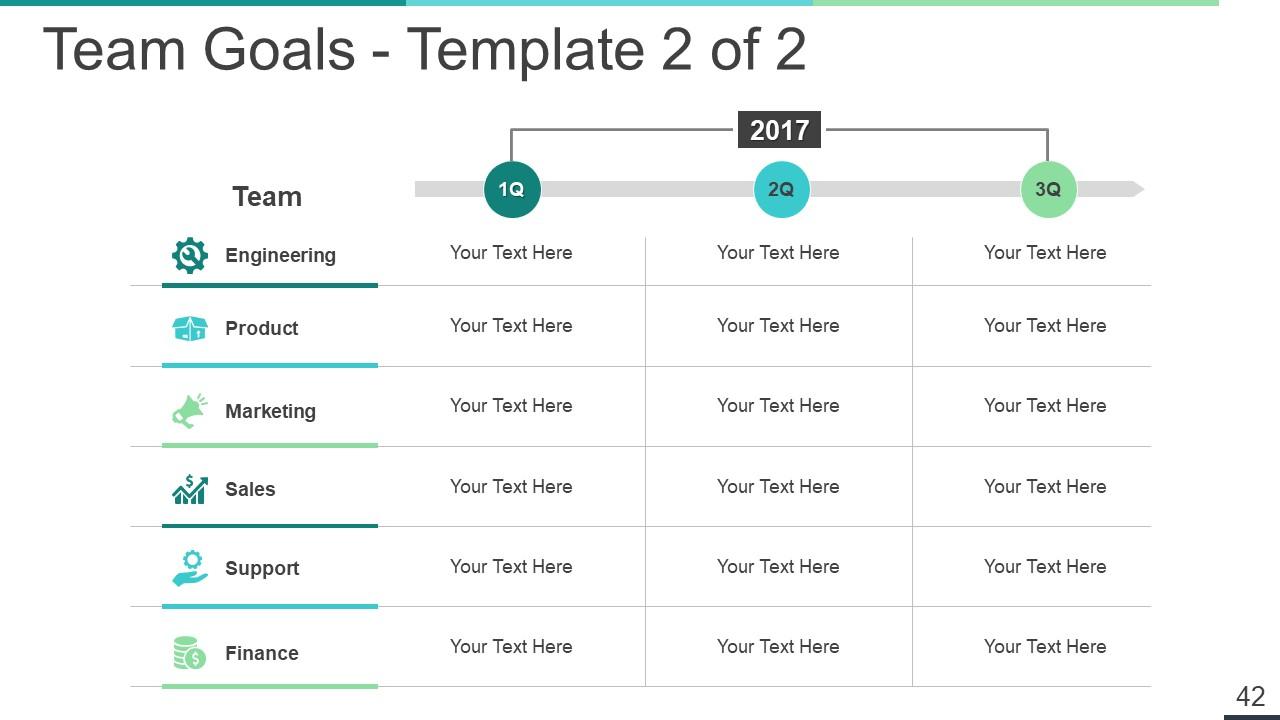
Slide 42: This slide presents Team Goals - Template 2 of 2 these parameters- Marketing, Engineering, Sales, Product, Support, Finance.
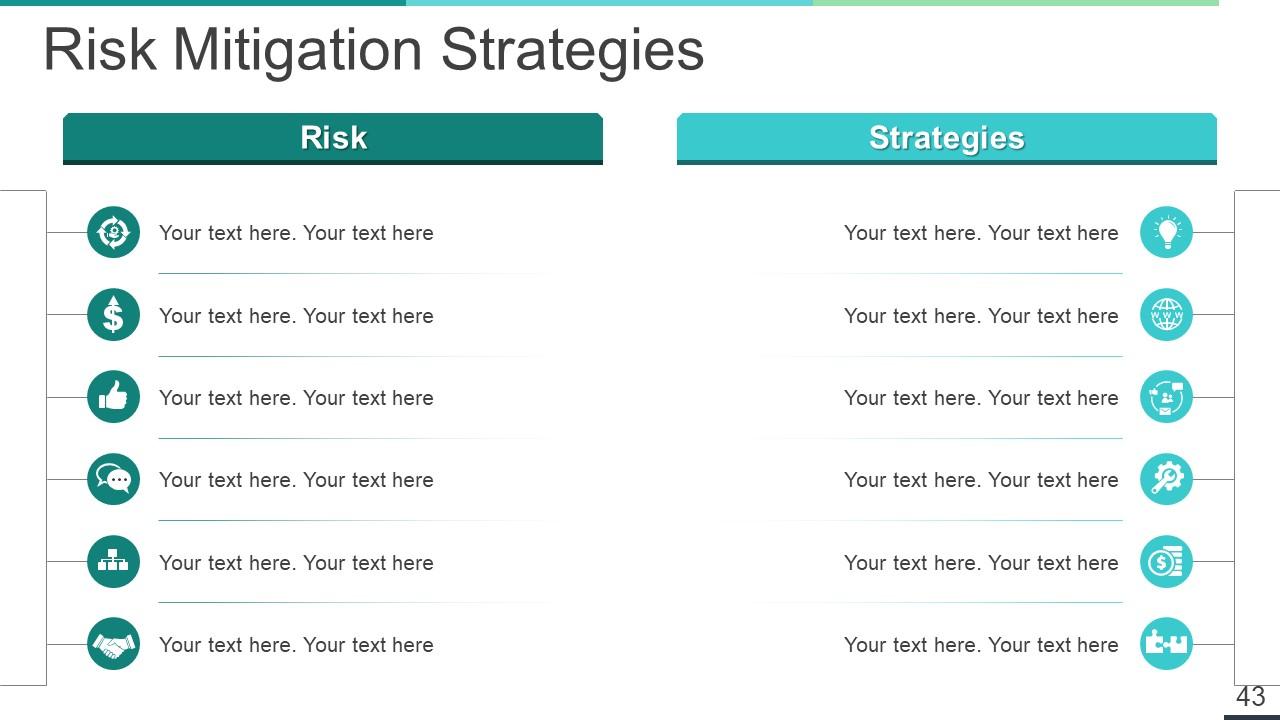
Slide 43: This slide showcases Risk Mitigation Strategies in which you can add the Risk, Strategies.
Slide 44: This slide presents Business Operational Risk Management Icons Set.
Slide 45: This slide is titled Additional Slides to move forward.
Slide 46: This slide represents Our Mission. State your mission, goals etc.
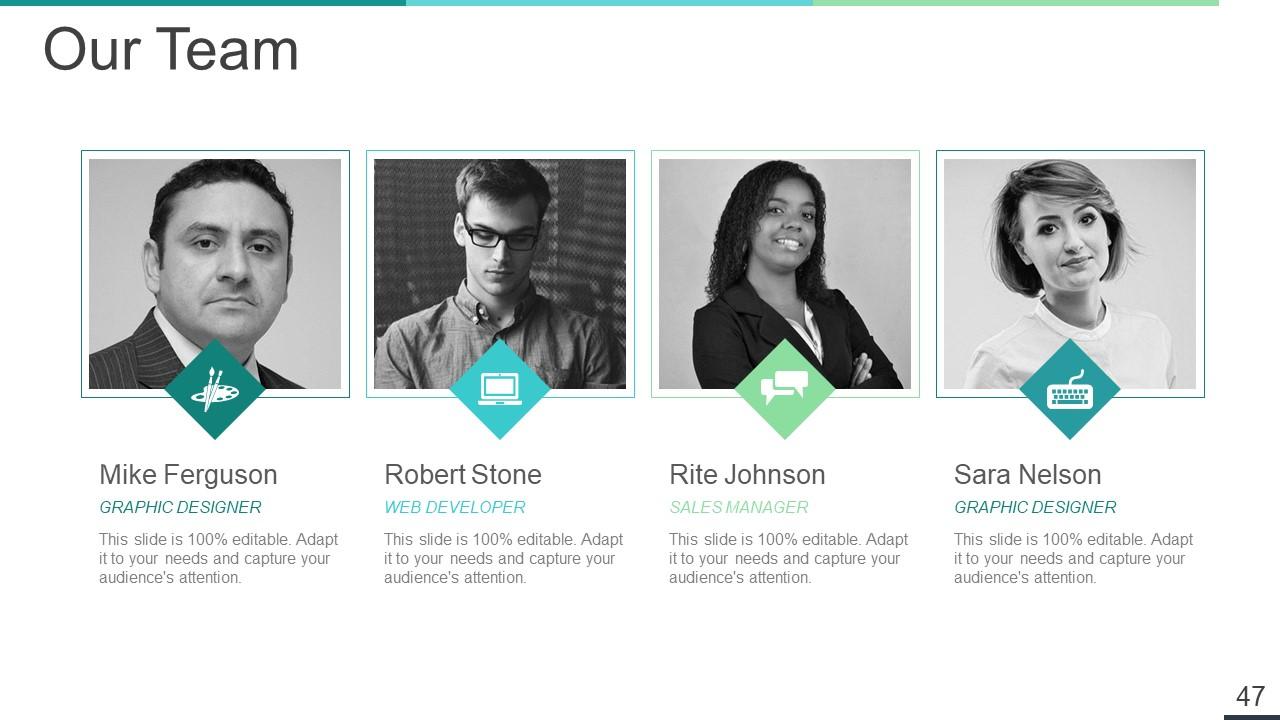
Slide 47: This is Our team slide with names and designation.
Slide 48: This is an About us slide to state company specifications etc.
Slide 49: This is an Our Goal slide. State your important goals here.
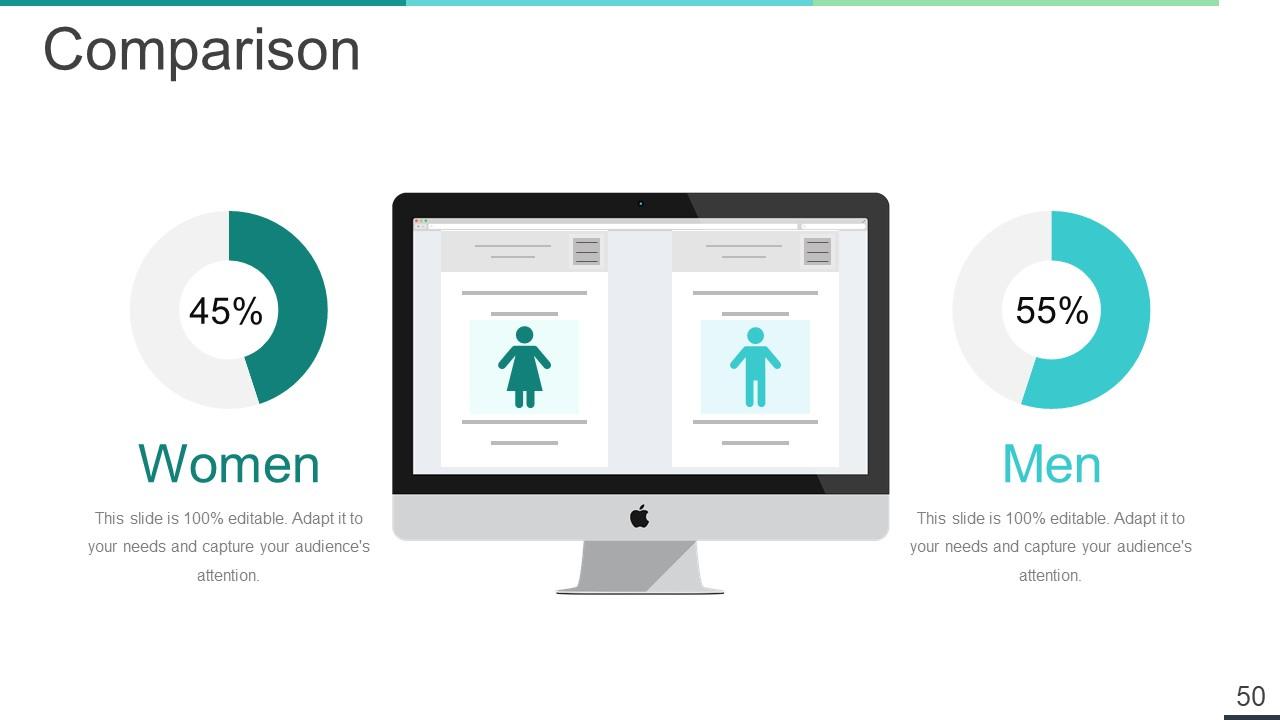
Slide 50: This slide shows Comparison of Positive Factors v/s Negative Factors with thumbs up and thumb down imagery
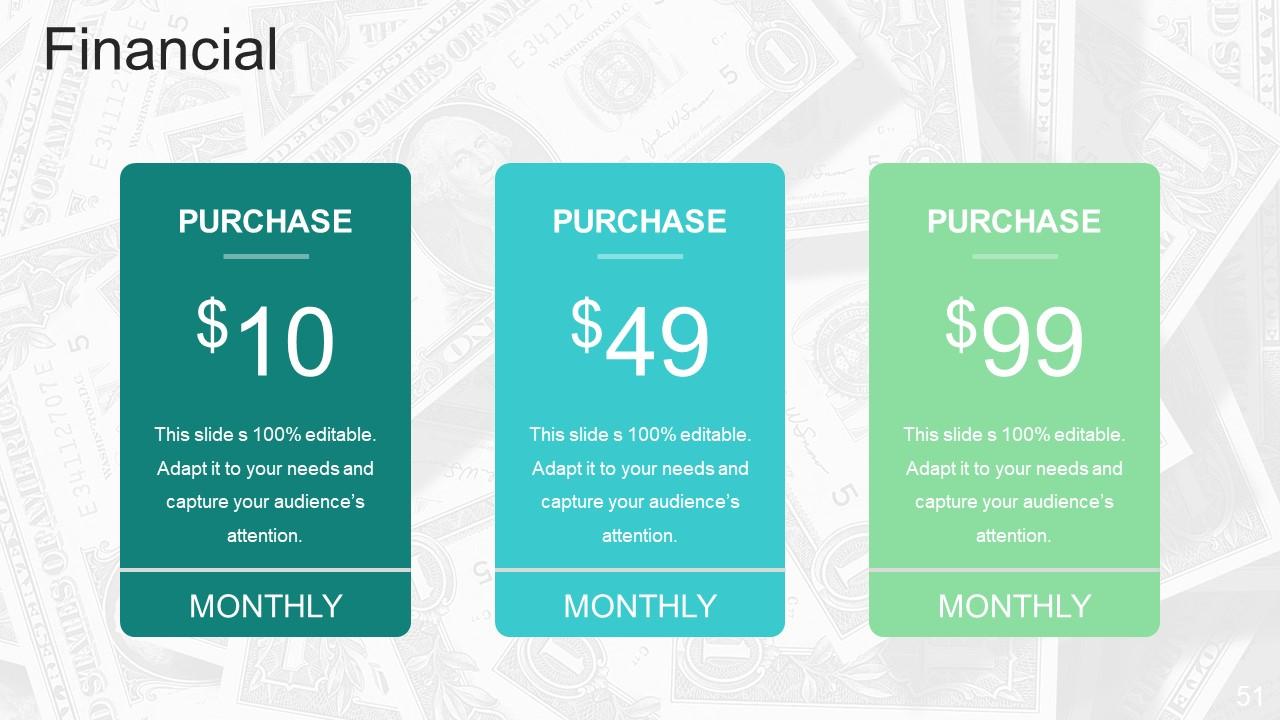
Slide 51: This is a Financial Score slide to show financial aspects here.
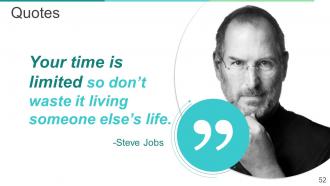
Slide 52: This is a Quotes slide to convey message, beliefs etc.
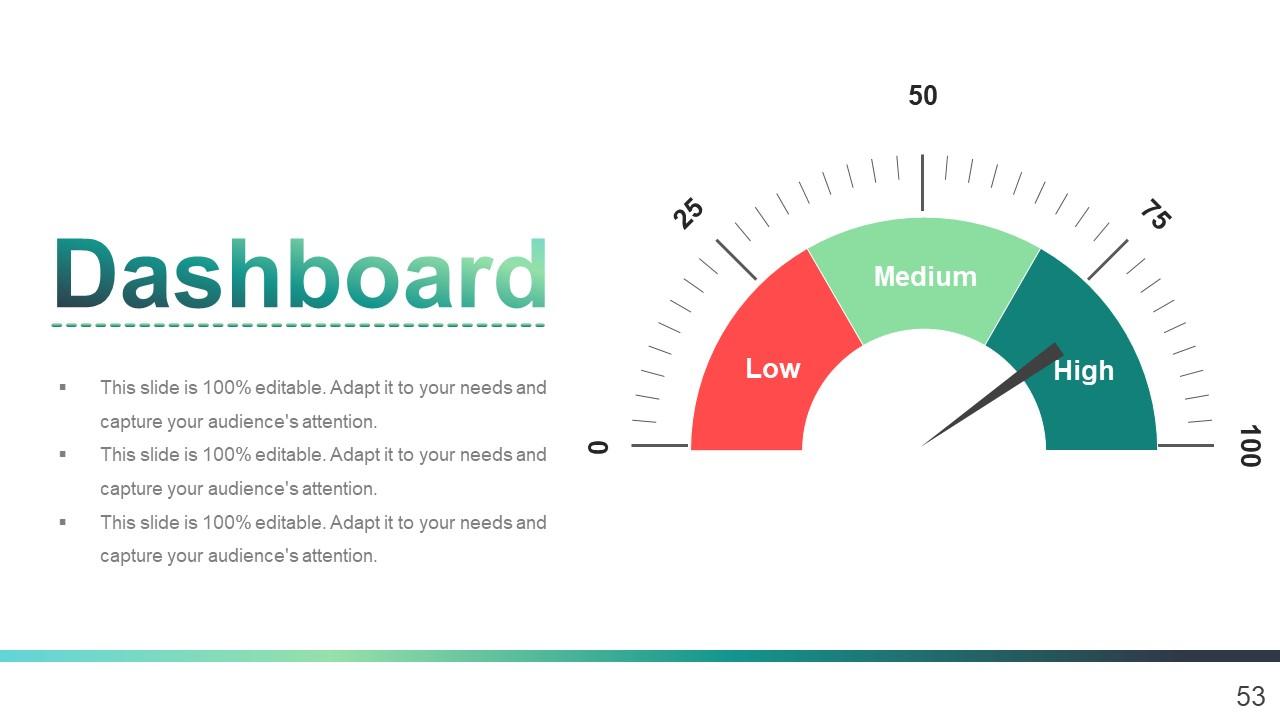
Slide 53: This is a Dashboard slide to show- Strategic System, Success, Goal Process, Sales Review, Communication Study.
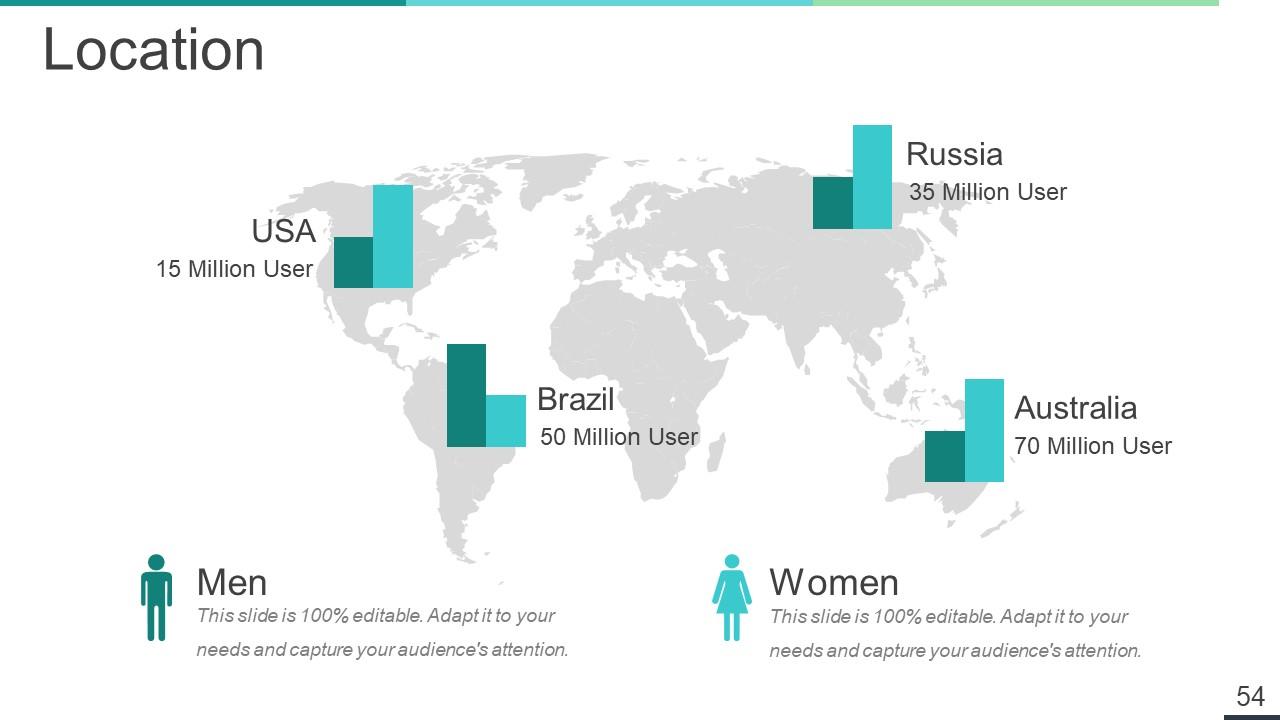
Slide 54: This is a Location slide to show global growth, presence etc. on world map.
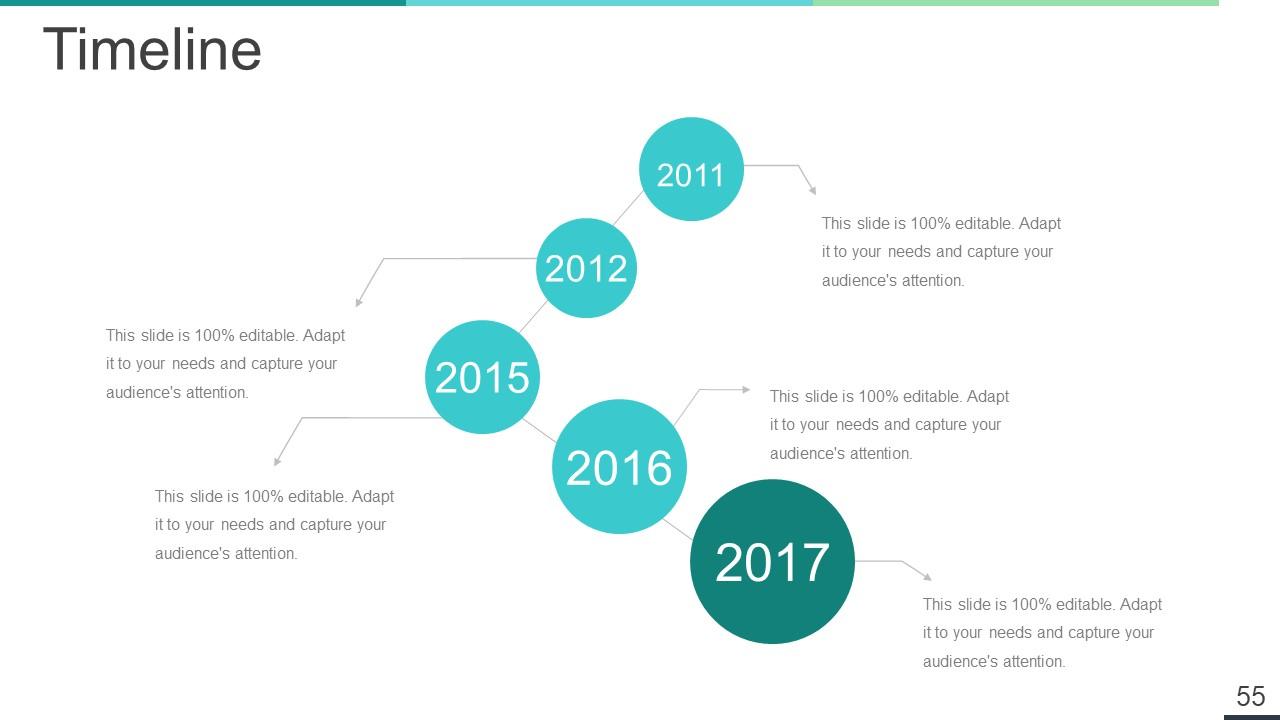
Slide 55: This is a Timelines slide to show- Plan, Budget, Schedule, Review.
Slide 56: This slide shows an image with text boxes titled Business Person with Post It notes.
Slide 57: This slide presents a Newspaper image with text boxes to flash company news, position etc.
Slide 58: This is a Puzzle image slide to show information, specification etc.
Slide 59: This slide displays Our Target with a background image.
Slide 60: This is a Circular image slide to show information, specifications etc.
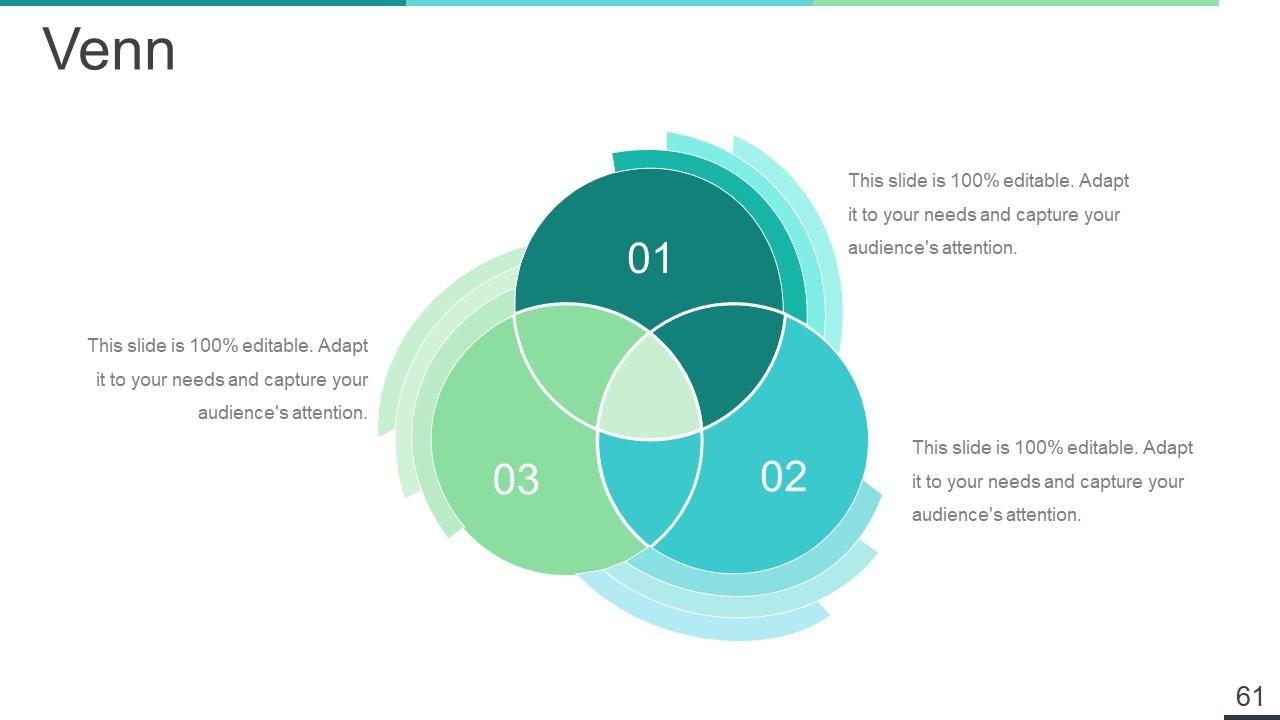
Slide 61: This is a Venn diagram image slide to show information, specifications etc.
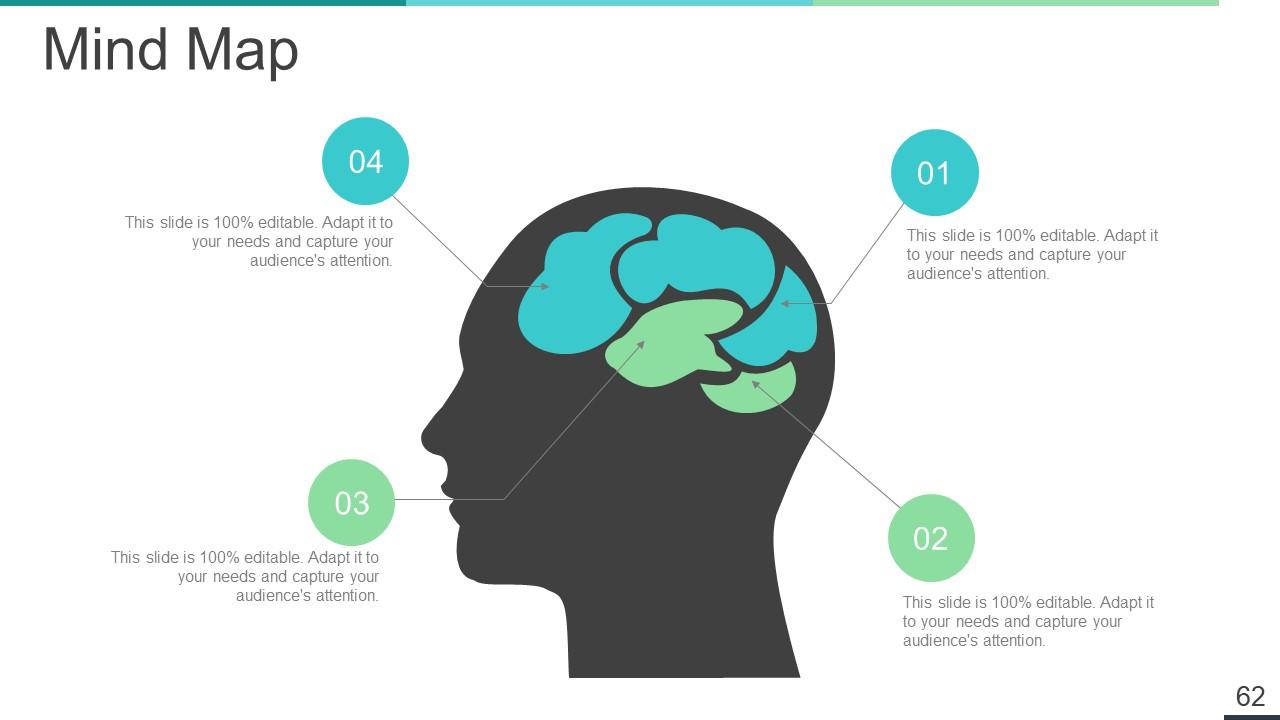
Slide 62: This slide shows a Mind map for representing entities.
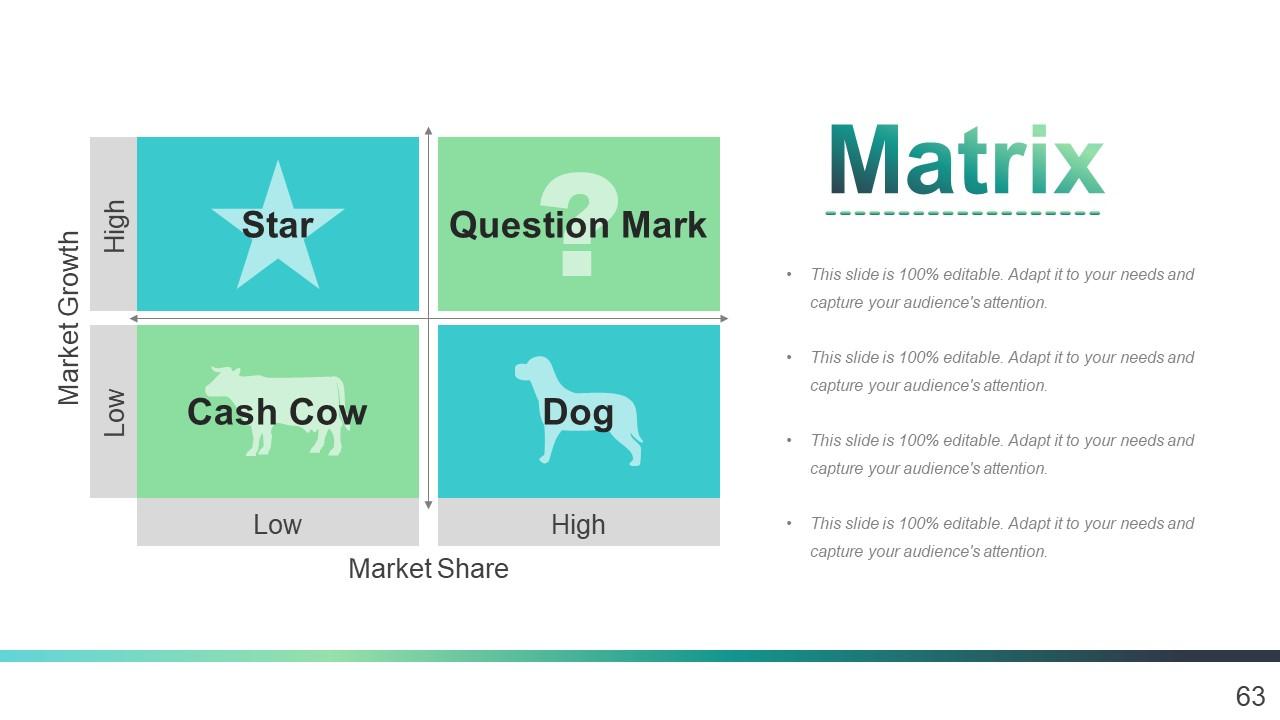
Slide 63: This slide shows a Matrix in terms of High and Low.
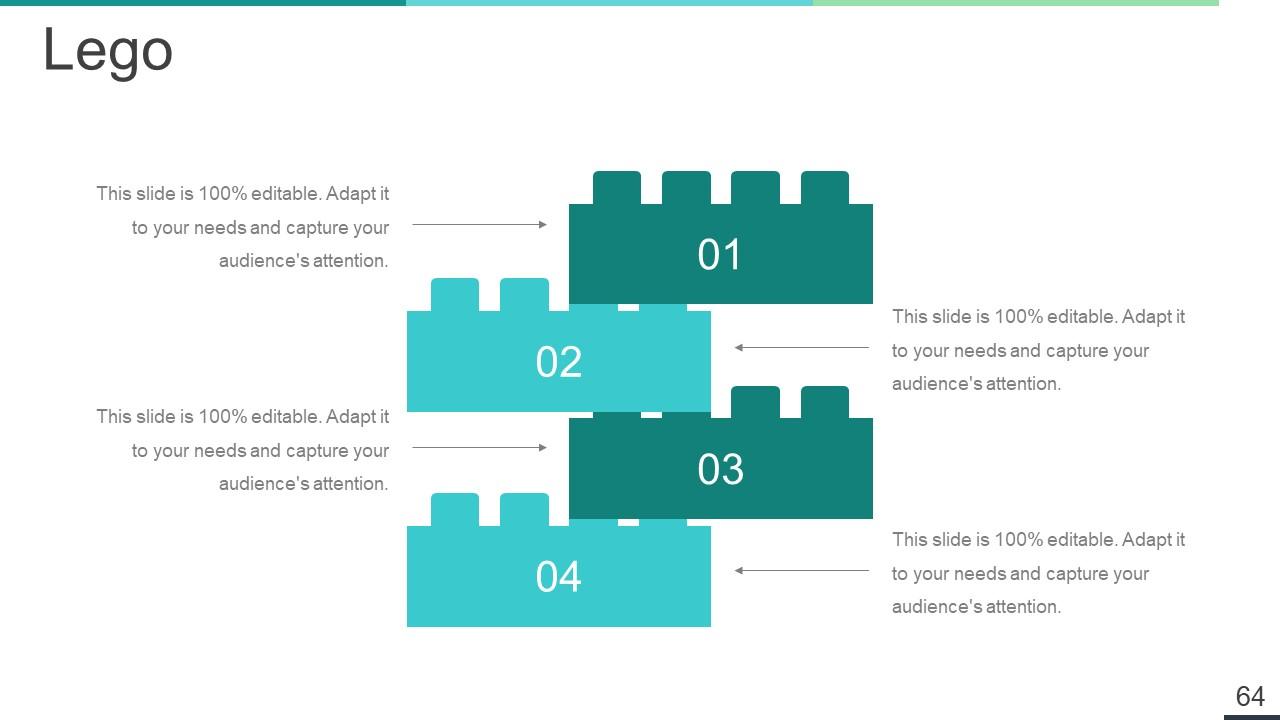
Slide 64: This is a LEGO slide with text boxes to show information
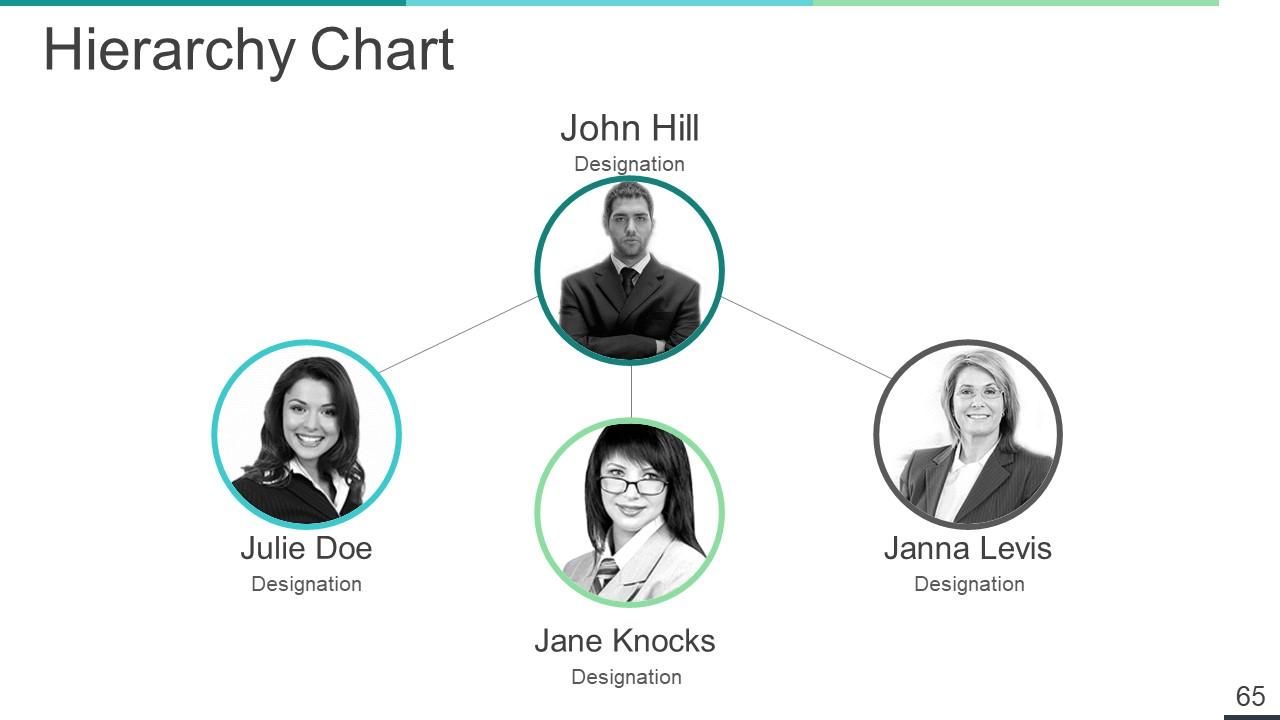
Slide 65: This is a Hierarchy slide showing- Supply Chain Manager, Supply Chain Council, Sourcing, Supplier Quality Engineer, Procurement, Logistics & Management, Supplier Management, Student, Contract Management
Slide 66: This is a Magnifying glass image slide to show information, scoping aspects etc.
Slide 67: This is a Silhouettes slide to show people specific information etc.
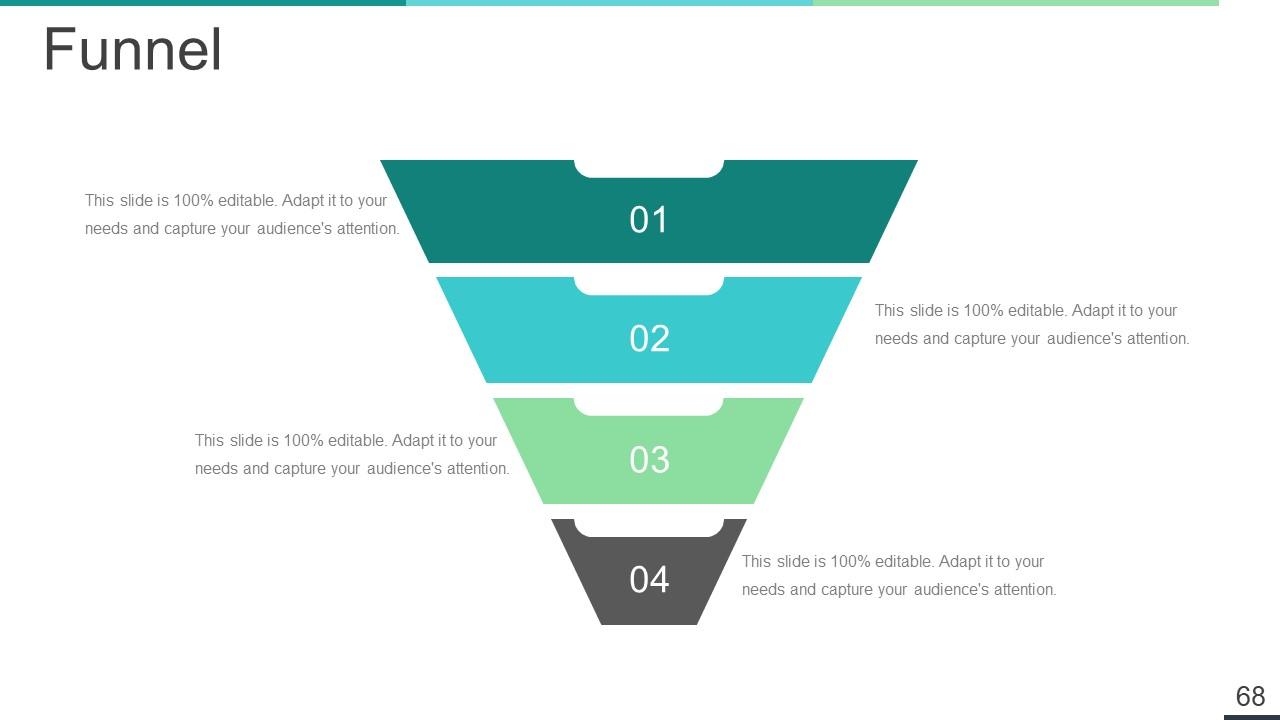
Slide 68: This slide showcases a Funnel with text boxes. State information, process in funnel form here.
Slide 69: This slide displays the title Charts & Graphs
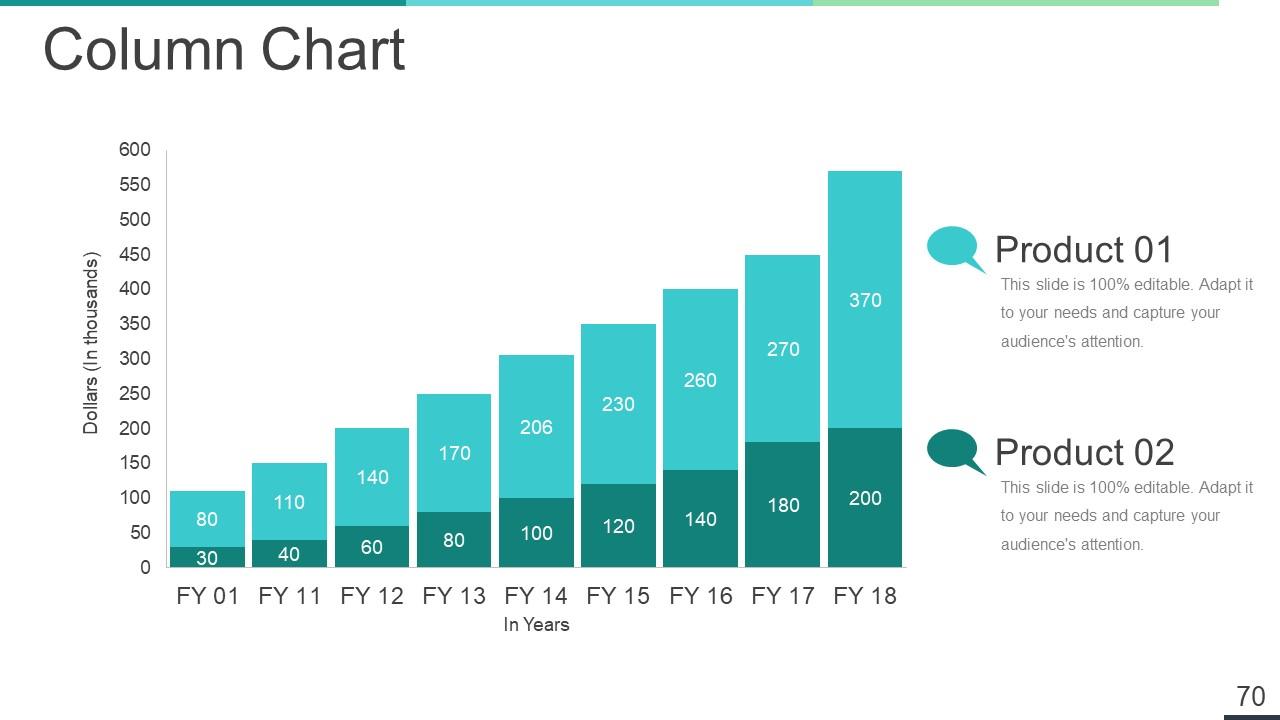
Slide 70: This is a Column Chart slide for product/entity comparison.
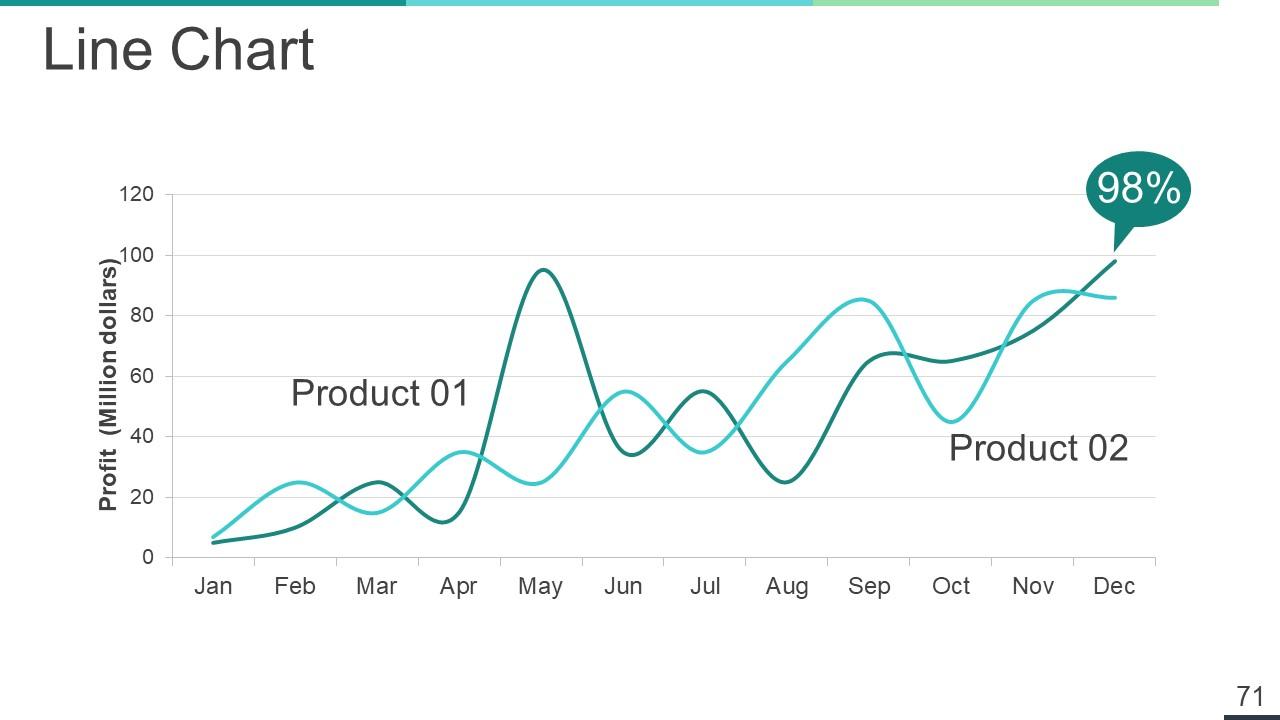
Slide 71: This is a Line Chart slide for product/entity comparison.
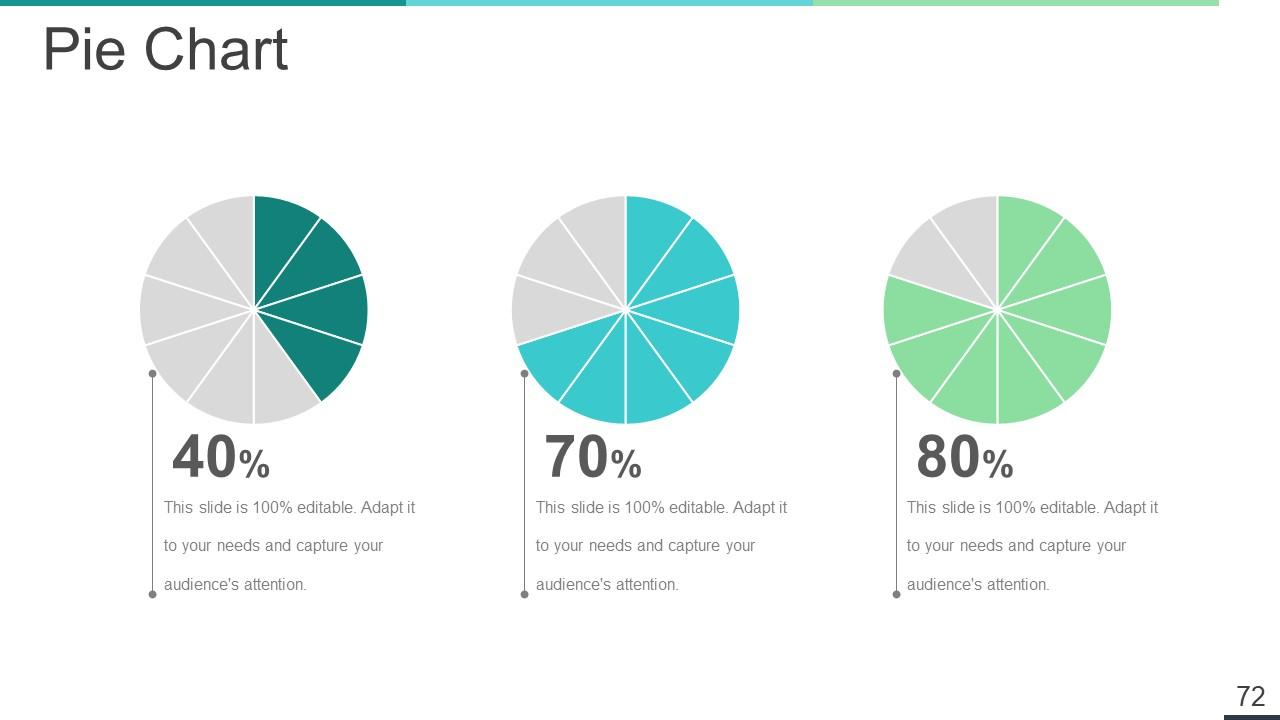
Slide 72: This slide showcases Pie Chart.
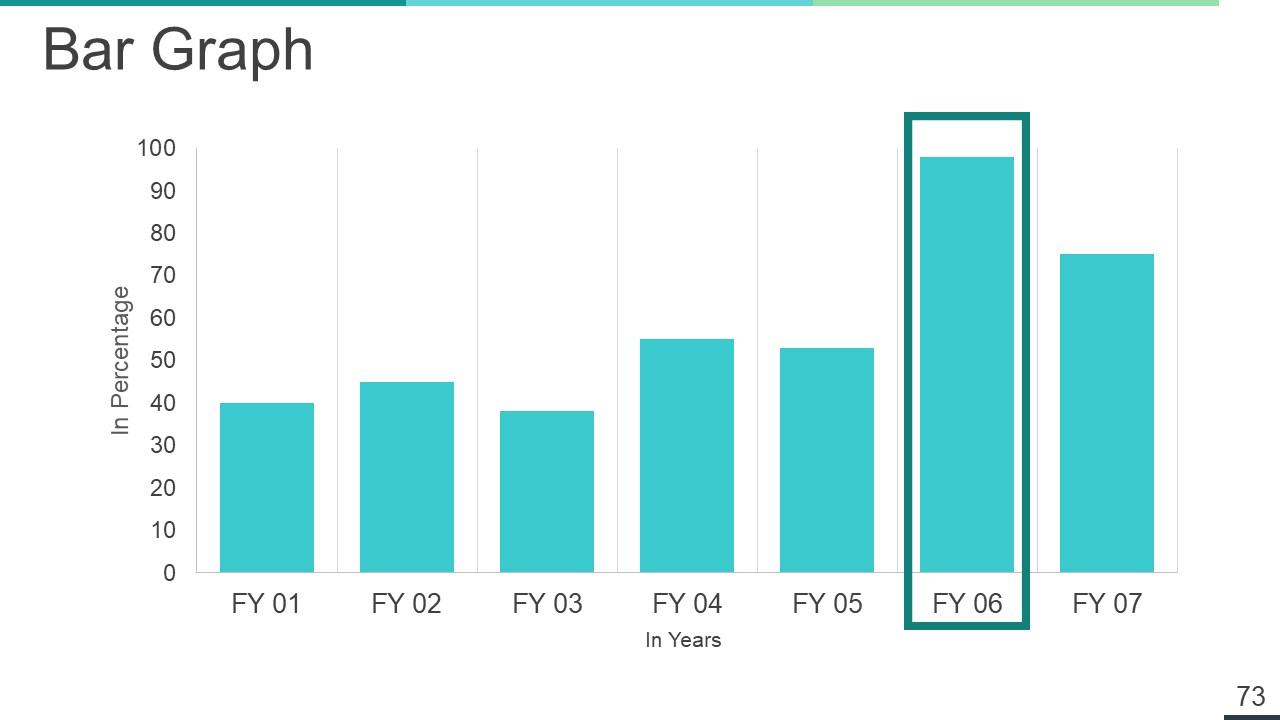
Slide 73: This is a Bar Graph image slide to show product comparison, growth etc.
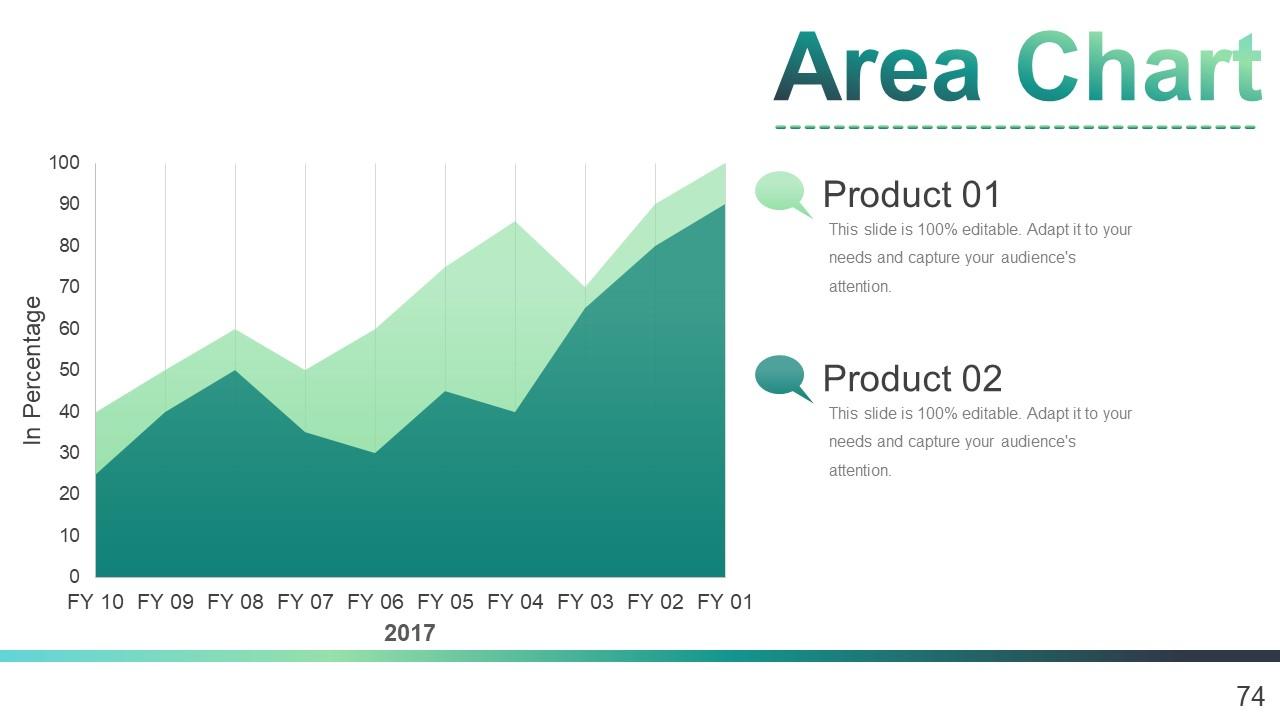
Slide 74: This is an Area Chart slide for product/entity comparison.
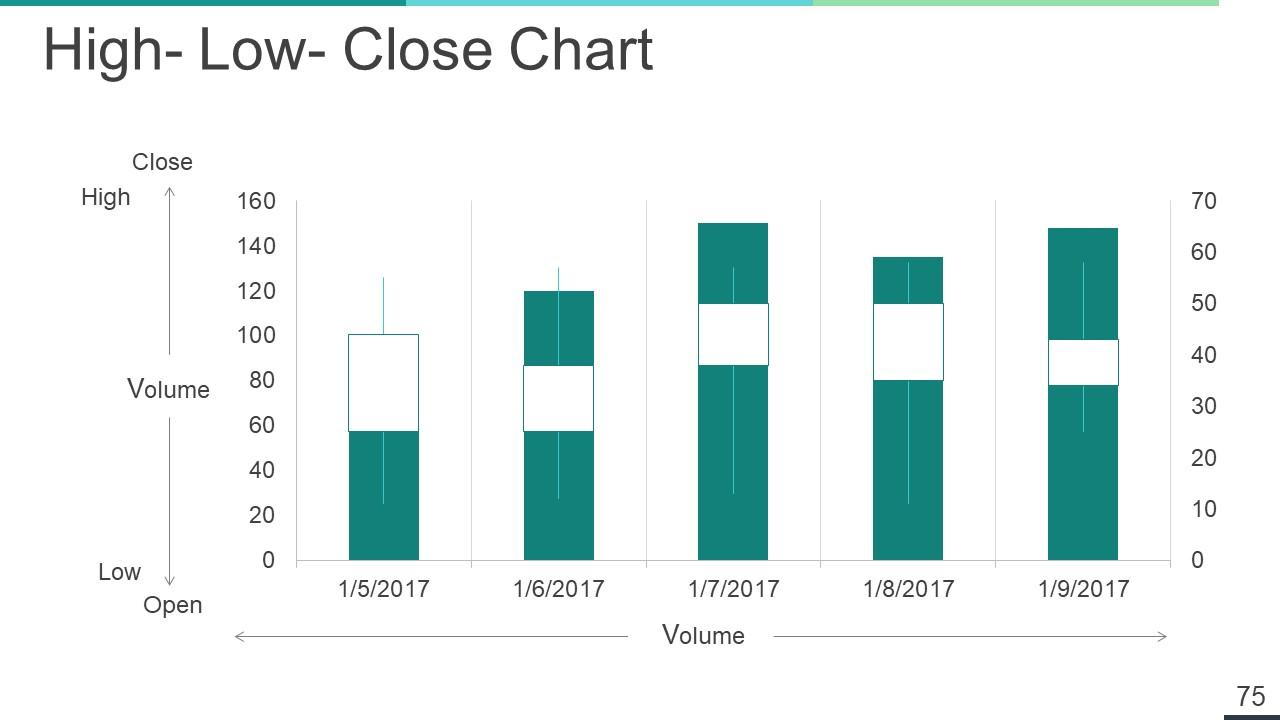
Slide 75: This slide showcases High- Low- Close Chart.
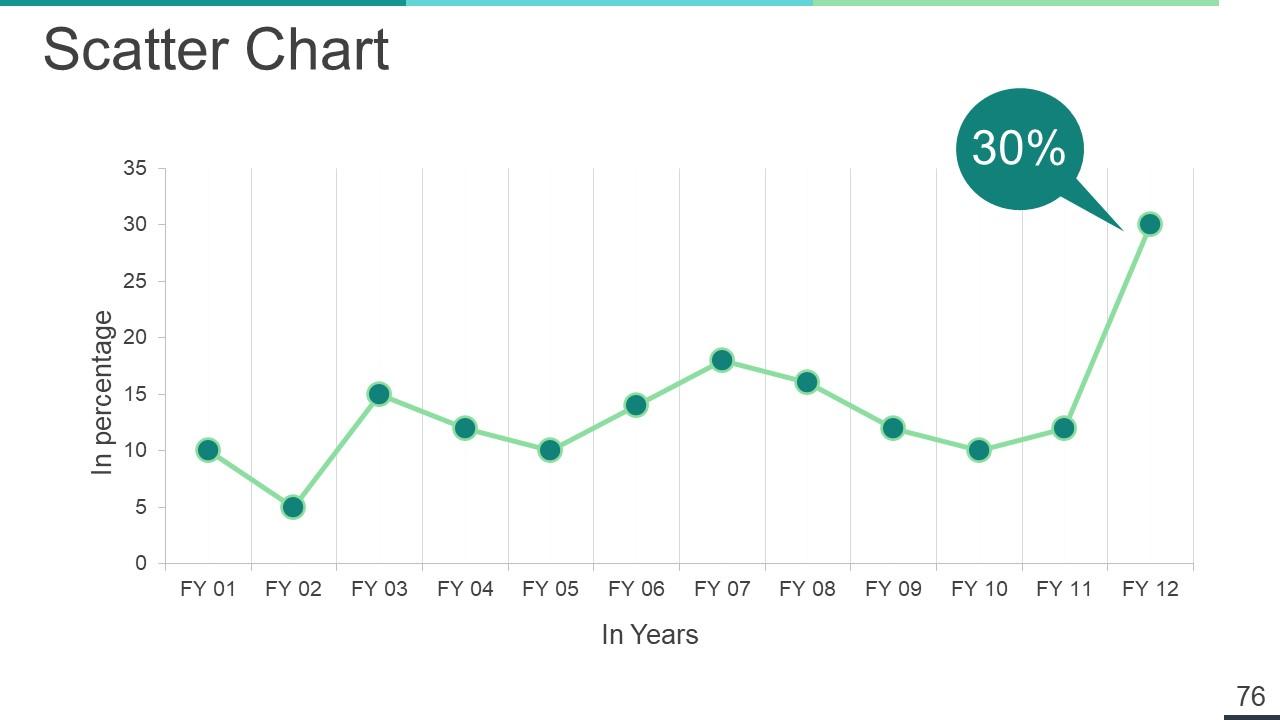
Slide 76: This slide shows Competitive Analysis with Scatter Chart/Radar Chart to compare.
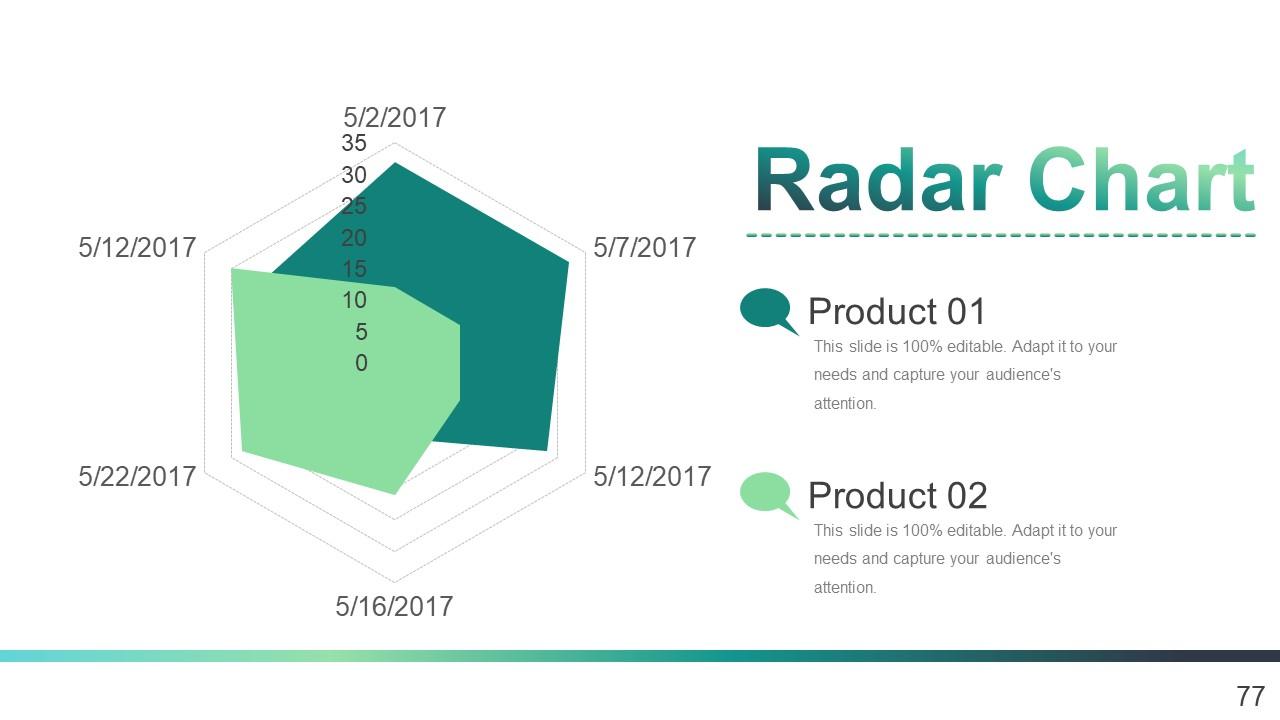
Slide 77: This is a Radar Chart slide for product/entity comparison.
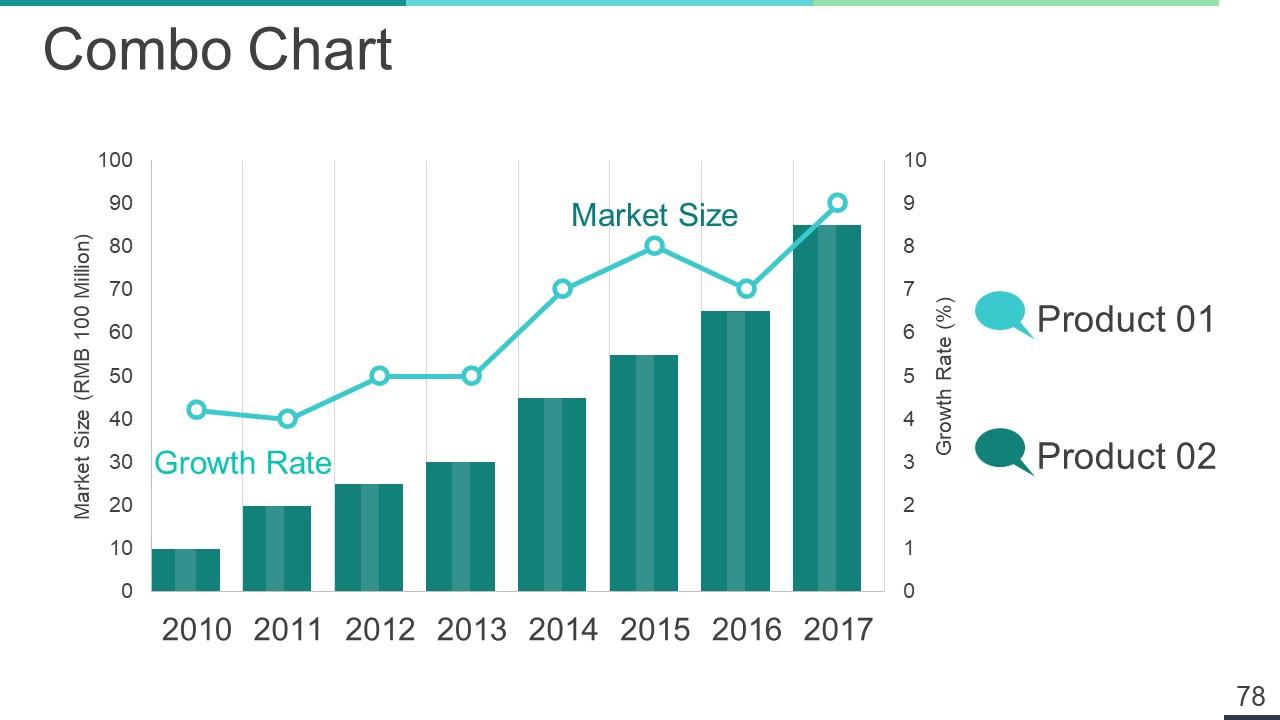
Slide 78: This slide showcases Combo Chart.
Slide 79: This is a Thank You slide with Address# street number, city, state, Contact Numbers, Email Address.
Slide 80: This is a Thank You slide.
Business Operational Risk Management Powerpoint Presentation Slides with all 80 slides:
Customize our Business Operational Risk Management Powerpoint Presentation Slides as you desire. They allow you to fashion every detail.
-
Illustrative design with editable content. Exceptional value for money. Highly pleased with the product.
-
Best Representation of topics, really appreciable.


