Statistical Graph Highlighting Financial Motivators Of An Enterprise
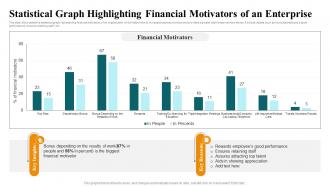
This slide showcases the statistical graph representing financial motivators of an organization which helps them to increase business revenue and provides a greater staff empowerment sense. It include details such as rewards employees good performance, ensures retaining staff, etc.
You must be logged in to download this presentation.
 Impress your
 audience
Editable
of Time
PowerPoint presentation slides
This slide showcases the statistical graph representing financial motivators of an organization which helps them to increase business revenue and provides a greater staff empowerment sense. It include details such as rewards employees good performance, ensures retaining staff, etc. Introducing our Statistical Graph Highlighting Financial Motivators Of An Enterprise set of slides. The topics discussed in these slides are Financial Motivators, Key Insights, Key Reasons.This is an immediately available PowerPoint presentation that can be conveniently customized. Download it and convince your audience.
People who downloaded this PowerPoint presentation also viewed the following :
Statistical Graph Highlighting Financial Motivators Of An Enterprise with all 11 slides:
Use our Statistical Graph Highlighting Financial Motivators Of An Enterprise to effectively help you save your valuable time. They are readymade to fit into any presentation structure.
-
Nothing beats the well-formatted and professionally designed templates offered. Kudos to SlideTeam for their amazing collection of PPT slides.
-
The way SlideTeam professionals work is exceptional. Thanks for being so helpful!


