Comparison percentage f202 ppt powerpoint presentation pictures gallery
Honour the judgement with our Comparison Percentage F202 Ppt Powerpoint Presentation Pictures Gallery. Give due credit to ethical analysis.
You must be logged in to download this presentation.
 Impress your
 audience
Editable
of Time
PowerPoint presentation slides
Presenting this set of slides with name Comparison Percentage F202 Ppt Powerpoint Presentation Pictures Gallery. This is a three stage process. The stages in this process are Compare, Marketing, Business, Management, Planning. This is a completely editable PowerPoint presentation and is available for immediate download. Download now and impress your audience.
People who downloaded this PowerPoint presentation also viewed the following :
Content of this Powerpoint Presentation
Description:
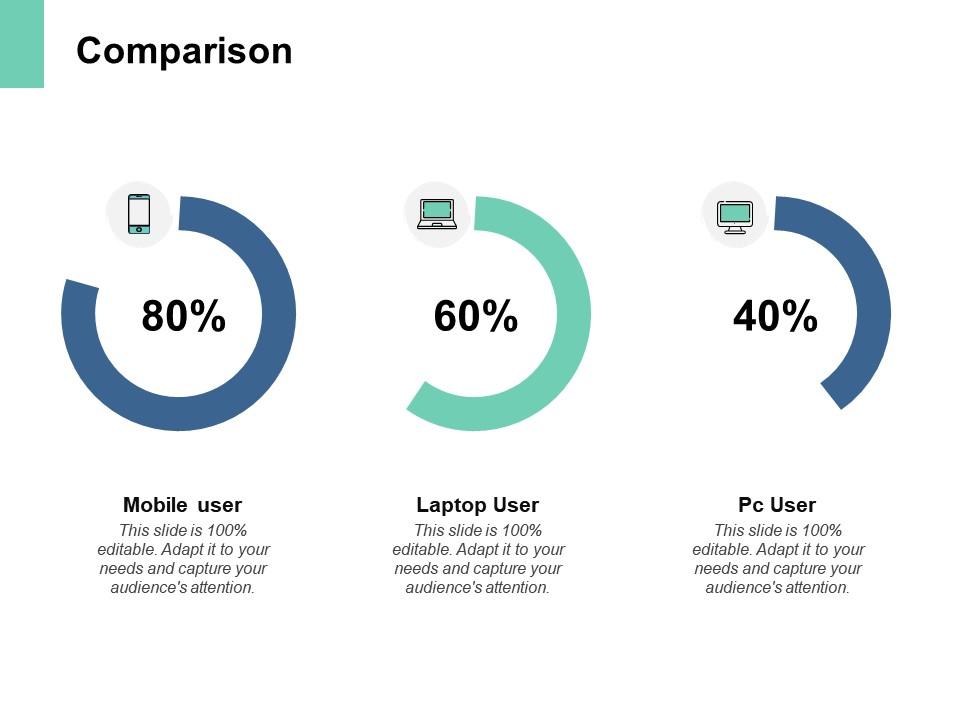
This image appears to be a PowerPoint slide labeled "Comparison" that visually compares percentages associated with different types of users: mobile, laptop, and PC. At the top, we see a title "Comparison," which indicates the slide's focus on comparing different metrics or categories. Each category has a respective icon - a smartphone for "Mobile user," a laptop for "Laptop User," and a desktop computer for "PC User."
Below each icon is a circular progress bar indicating a percentage: 80% for mobile users, 60% for laptop users, and 40% for PC users. These percentages presumably represent a share of a certain metric or user behavior relevant to the topic being discussed.
Use Cases:
This type of slide can find applications across multiple industries where comparisons of user data are relevant:
1. Telecommunications:
Use: Comparing device usage among customers
Presenter: Marketing Manager
Audience: Marketing Team
2. E-commerce:
Use: Presenting preferred shopping devices of site visitors
Presenter: E-commerce Analyst
Audience: Sales and Marketing Department
3. Digital Marketing:
Use: Showcasing traffic sources for online campaigns
Presenter: Digital Marketing Specialist
Audience: Clients or Internal Marketing Team
4. Information Technology:
Use: Illustrating the distribution of devices in an IT infrastructure
Presenter: IT Manager
Audience: Executive Management
5. Market Research:
Use: Demonstrating consumer device preference trends
Presenter: Market Research Analyst
Audience: Product Development Team
6. Education Technology:
Use: Presenting the devices students use to access learning materials
Presenter: Educational Researcher
Audience: Educational Publishers
7. Financial Services:
Use: Analyzing digital banking access trends
Presenter: Data Analyst
Audience: Bank Executives
Comparison percentage f202 ppt powerpoint presentation pictures gallery with all 5 slides:
Give due credit to ethical analysis with our Comparison Percentage F202 Ppt Powerpoint Presentation Pictures Gallery. Be able to honour the judgement.
No Reviews


