Ppts baseline performance measurement diagram powerpoint slides
Do the tango with our Ppts Baseline Performance Measurement Diagram Powerpoint Slides. Your moves will enthrall the audience.
Do the tango with our Ppts Baseline Performance Measurement Diagram Powerpoint Slides. Your moves will enthrall the audience.
- Google Slides is a new FREE Presentation software from Google.
- All our content is 100% compatible with Google Slides.
- Just download our designs, and upload them to Google Slides and they will work automatically.
- Amaze your audience with SlideTeam and Google Slides.
-
Want Changes to This PPT Slide? Check out our Presentation Design Services
- WideScreen Aspect ratio is becoming a very popular format. When you download this product, the downloaded ZIP will contain this product in both standard and widescreen format.
-

- Some older products that we have may only be in standard format, but they can easily be converted to widescreen.
- To do this, please open the SlideTeam product in Powerpoint, and go to
- Design ( On the top bar) -> Page Setup -> and select "On-screen Show (16:9)” in the drop down for "Slides Sized for".
- The slide or theme will change to widescreen, and all graphics will adjust automatically. You can similarly convert our content to any other desired screen aspect ratio.
Compatible With Google Slides

Get This In WideScreen
You must be logged in to download this presentation.
PowerPoint presentation slides
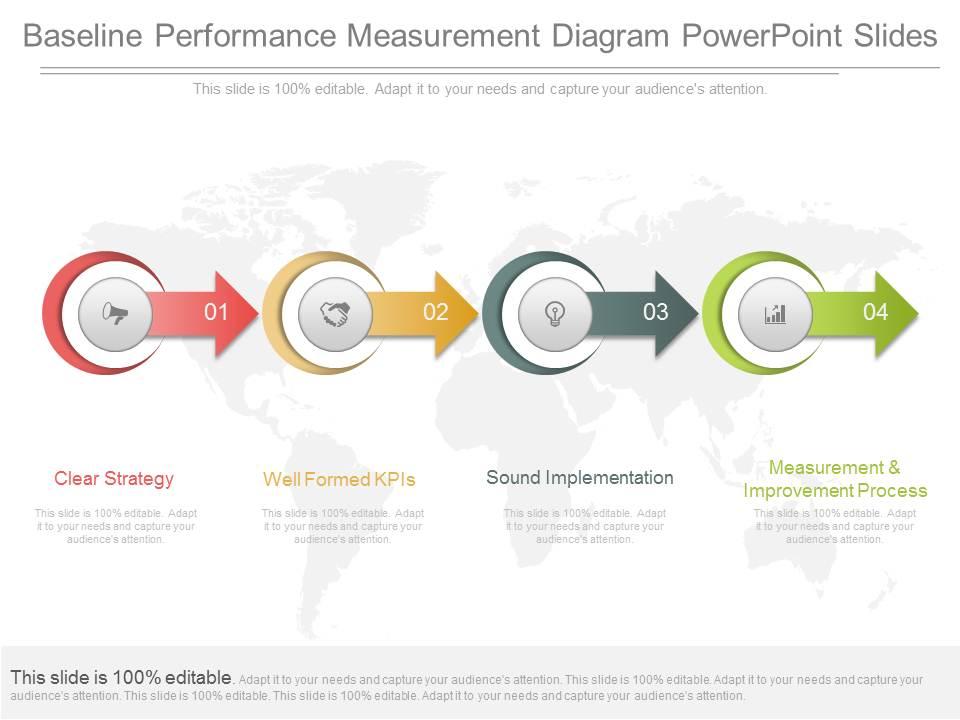
Presenting ppts baseline performance measurement diagram powerpoint slides. This is a baseline performance measurement diagram powerpoint slides. This is a four stage process. The stages in this process are clear strategy, well formed kpis, sound implementation, measurement and improvement process.
People who downloaded this PowerPoint presentation also viewed the following :
Content of this Powerpoint Presentation
Description:
This image depicts a PowerPoint slide titled ""Baseline Performance Measurement Diagram PowerPoint Slides,"" which is designed to present a structured approach to performance measurement and management. The slide is divided into four parts, each representing a step in the performance measurement process.
1. Clear Strategy:
The first step emphasizes the importance of having a clear strategy. It's symbolized by a red circle with an icon resembling a target or goal. Establishing a clear strategy is vital for guiding the direction of an organization and setting the stage for subsequent actions.
2. Well Formed KPIs:
The second step pertains to defining well-formed Key Performance Indicators (KPIs), as indicated by the yellow circle with a gear icon. KPIs are critical for measuring the effectiveness of the deployed strategy. They need to be well-defined to accurately reflect success criteria.
3. Sound Implementation:
The third step, denoted by a green circle with a light bulb icon, refers to the sound implementation of the strategy and KPIs. Effective execution is crucial for achieving desired outcomes and it's where strategies and KPIs are put into action.
4. Measurement & Improvement Process:
The final step is the ongoing measurement and improvement process, which is represented by a blue circle with a chart icon. This step is about continuously monitoring performance against KPIs and strategizing improvements to enhance outcomes.
Use Cases:
Now, let's discuss the seven specific industries where these slides can be effectively utilized:
1. Consulting:
Use: Ideal for presenting performance strategies
Presenter: Consultants can guide client organizations
Audience: Executives and managers
2. Healthcare:
Use: Used to track patient care metrics
Presenter: Healthcare administrators present
Audience: Medical staff and board members
3. Retail:
Use: To analyze sales and customer service performance
Presenter: Store managers or retail analysts present
Audience: Sales teams and store executives
4. Manufacturing:
Use: Monitor production and quality control
Presenter: Operations managers or line supervisors use it
Audience: Plant workers and corporate leadership
5. Education:
Use: Track student achievement and institutional goals
Presenter: Admissions officers or department heads present
Audience: Educators and administrative staff
6. Software Development:
Use: Review project milestones and coding standards
Presenter: Project managers or team leads utilize it
Audience: Development teams and stakeholders
7. Banking and Finance:
Use: Assess financial performance and service delivery
Presenter: CFOs or financial analysts to present
Audience: Investors and board of directors
Ppts baseline performance measurement diagram powerpoint slides with all 7 slides:
Earn kudos with our Ppts Baseline Performance Measurement Diagram Powerpoint Slides. They will strenghten the force of your logic.
-
Designs have enough space to add content.
-
Great designs, Easily Editable.


