Graphique linéaire de graphique à barres d'analyse numérique
Protégez-vous contre la tromperie avec notre graphique linéaire graphique à barres d'analyse numérique Ils permettent d'accéder à l'intégralité des faits.
Protégez-vous contre la tromperie avec notre graphique linéaire graphique à barres d'analyse numérique Ils permettent ..
- Google Slides is a new FREE Presentation software from Google.
- All our content is 100% compatible with Google Slides.
- Just download our designs, and upload them to Google Slides and they will work automatically.
- Amaze your audience with SlideTeam and Google Slides.
-
Want Changes to This PPT Slide? Check out our Presentation Design Services
- WideScreen Aspect ratio is becoming a very popular format. When you download this product, the downloaded ZIP will contain this product in both standard and widescreen format.
-

- Some older products that we have may only be in standard format, but they can easily be converted to widescreen.
- To do this, please open the SlideTeam product in Powerpoint, and go to
- Design ( On the top bar) -> Page Setup -> and select "On-screen Show (16:9)” in the drop down for "Slides Sized for".
- The slide or theme will change to widescreen, and all graphics will adjust automatically. You can similarly convert our content to any other desired screen aspect ratio.
Compatible With Google Slides

Get This In WideScreen
You must be logged in to download this presentation.
Caractéristiques de ces diapositives de présentation PowerPoint:
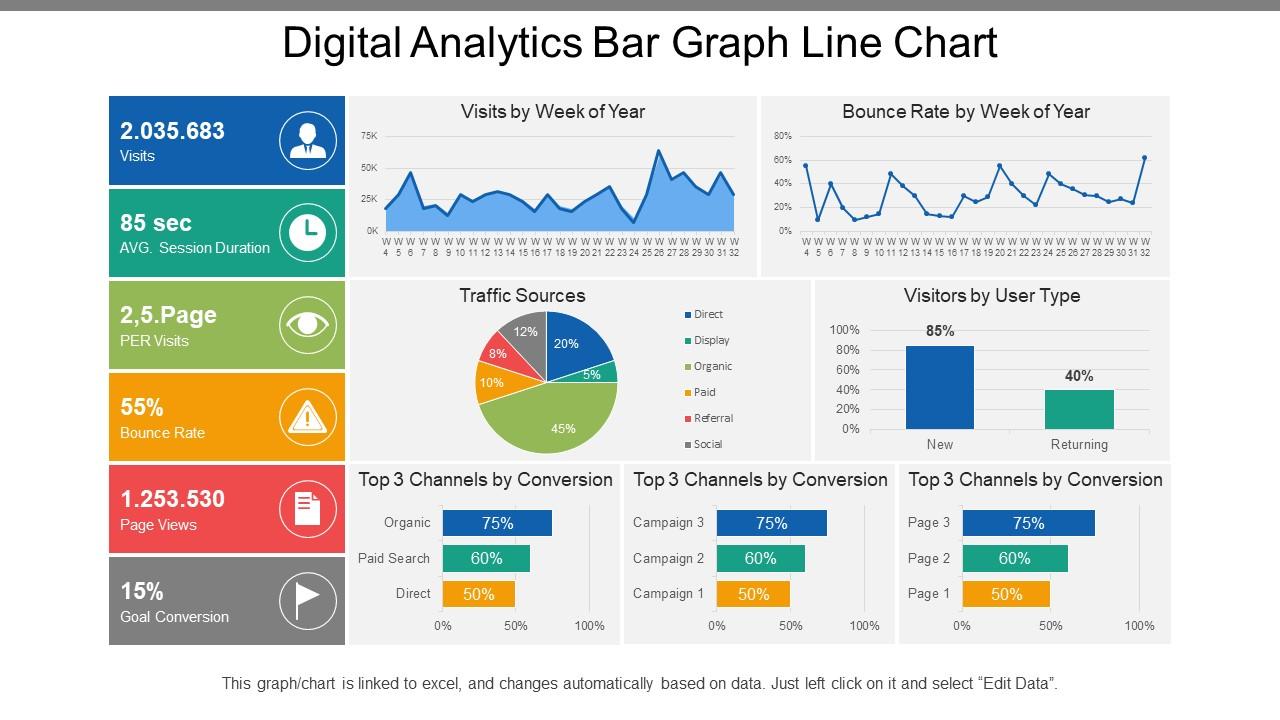
Présentation de cet ensemble de diapositives avec un nom - Graphique à barres Digital Analytics. Il s'agit d'un processus en cinq étapes. Les étapes de ce processus sont l'analyse numérique, le tableau de bord numérique, les Kpis numériques.
People who downloaded this PowerPoint presentation also viewed the following :
Graphique à barres Digital Analytics avec les 6 diapositives :
Passez une soirée charmante avec notre graphique linéaire à barres Digital Analytics. Ils créent un air d'enchantement.
-
Easy to edit slides with easy to understand instructions.
-
It saves your time and decrease your efforts in half.


