- Sub Categories
-
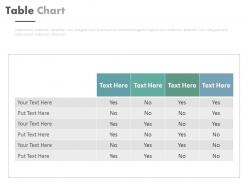 Four staged table chart for decision representation powerpoint slides
Presenting four staged table chart for decision representation powerpoint slides. This Power Point template diagram slide has been crafted with graphic of four staged table chart. This PPT diagram slide contains the concept of decision ability representation. Use this PPT slide for finance and business related presentations.
-
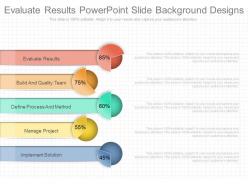 Evaluate results powerpoint slide background designs
Presenting evaluate results powerpoint slide background designs. This is a evaluate results powerpoint slide background designs. This is a five stage process. The stages in this process are evaluate results, build and quality team, define process and method, manage project, implement solution.
-
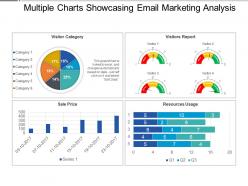 Multiple charts showcasing email marketing analysis presentation slides
Introducing multiple charts showcasing email marketing analysis PPT slide. This is exclusively codified PPT design scheme which is quite suitable for business managers, marketing experts etc. This PPT graphic can be acclimating with divergent softwares and Google Slides. This Presentation template can be customizable in to other file formats like PDF or JPG. Offers an alterable designs, forms, colors, contents etc. Also provides an option to add company name or emblem with this PPT template.
-
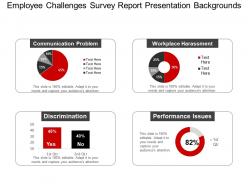 Employee challenges survey report presentation backgrounds
Presenting employee challenges survey report presentation backgrounds. This is a employee challenges survey report presentation backgrounds. This is a four stage process. The stages in this process are survey, forecasting, statistics.
-
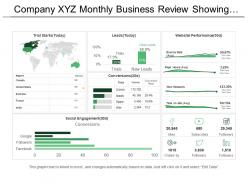 Company xyz monthly business review showing marketing performance dashboard
Presenting this set of slides with name - Company Xyz Monthly Business Review Showing Marketing Performance Dashboard. This is a five stage process. The stages in this process are Monthly Business Review, Monthly Business Report, Monthly Company Review.
-
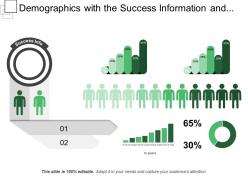 Demographics with the success information and statistics
Presenting this set of slides with name - Demographics With The Success Information And Statistics. This is a two stage process. The stages in this process are Population, Demographics, People Growth.
-
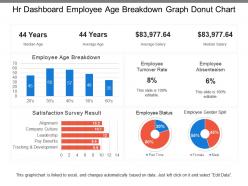 Hr dashboard employee age breakdown graph donut chart
Presenting this set of slides with name - Hr Dashboard Employee Age Breakdown Graph Donut Chart. This is a four stage process. The stages in this process are Hr Dashboard, Human Resource Dashboard, Hr Kpi.
-
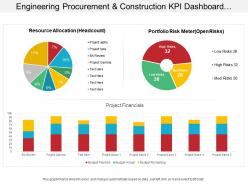 Engineering procurement and construction kpi dashboard having project financials and resource allocation
Presenting this set of slides with name - Engineering Procurement And Construction Kpi Dashboard Having Project Financials And Resource Allocation. This is a three stage process. The stages in this process are Engineering, Procurement And Construction, Construction Management, Engineering, Purchasing And Construction .
-
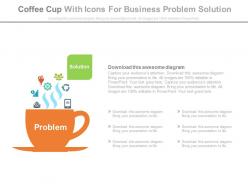 Coffee cup with icons for business problem solutions powerpoint slides
Presenting coffee cup with icons for business problem solutions powerpoint slides. This Power Point template diagram slide has been crafted with graphic of coffee cup and icons diagram. This PPT diagram contains the concept of business problem solutions representation. Use this PPT diagram for business and finance related presentations.
-
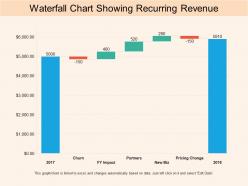 Waterfall chart showing recurring revenue
Presenting this set of slides with name - Waterfall Chart Showing Recurring Revenue. This is a seven stage process. The stages in this process are Agile, Waterfall, Scrum, Sprint.
-
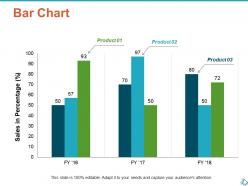 Bar chart finance ppt show infographic template
Presenting this set of slides with name - Bar Chart Finance Ppt Show Infographic Template. This is a three stage process. The stages in this process are Finance, Analysis, Business, Investment, Marketing.
-
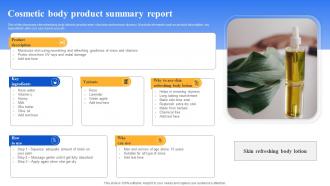 Cosmetic Body Product Summary Report
This slide showcase skin refreshing body lotion to provide even skin tone and remove dryness. It include elements such as product description, key ingredients, who ca n use, how to use etc. Introducing our premium set of slides with Cosmetic Body Product Summary Report Ellicudate the five stages and present information using this PPT slide. This is a completely adaptable PowerPoint template design that can be used to interpret topics like Key Ingredients, Product Description, Variants So download instantly and tailor it with your information.
-
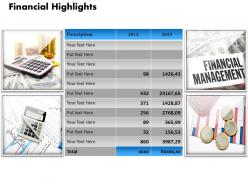 0314 design for financial presentation
We are proud to present our 0314 design for financial presentation. Our Design For Financial Presentation are aesthetically designed to attract attention. We guarantee that they will grab all the eyeballs you need.
-
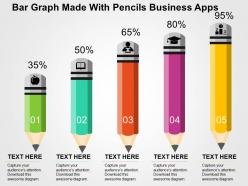 Bar graph made with pencils business apps flat powerpoint design
This PowerPoint presentation can be used to represent a company's business and data related presentations in a simple and approachable way. The elements used in this PPT slide are 100% editable by means of color, shape, and orientation. These PPT slides are compatible with Google slides and can be edited in any PowerPoint software.
-
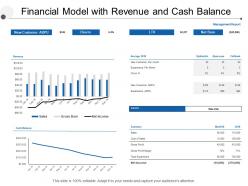 Financial model with revenue and cash balance
Presenting this set of slides with name - Financial Model With Revenue And Cash Balance. This is a four stage process. The stages in this process are Financial Analysis, Income Statement, Balance Sheet.
-
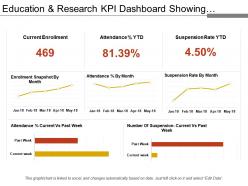 Education and research kpi dashboard showing attendance and suspension rate
Presenting education and research KPI dashboard showing attendance and suspension rate PPT slide. The suspension rate KPI dashboard PPT slide designed by the professional team of SlideTeam. The attendance rate report slide is 100% editable in PowerPoint. The attendance and detention KPI dashboard PowerPoint slide is compatible with Google Slide so a user can share this attendance rate dashboard slide with others. A user can make changes in the font size, font type, color as well as dimensions of the college acceptance rate dashboard PPT template as per the requirement. You may edit the value in the reporting tool KPI dashboard presentation template as the slide gets linked with the Excel sheet.
-
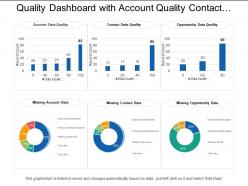 Quality dashboard snapshot with account quality contact data missing account data
Presenting this set of slides with name - Quality Dashboard Snapshot With Account Quality Contact Data Missing Account Data. This is a six stage process. The stages in this process are Quality Dashboard, Quality Kpi, Quality Metircs.
-
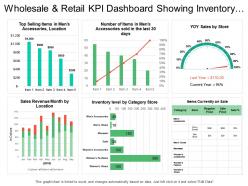 Wholesale and retail kpi dashboard showing inventory level by category sales revenue month
Presenting the retail business slide for PowerPoint. This presentation template is 100% modifiable in PowerPoint and is designed by professionals. You can edit the objects in the slide like font size and font color very easily. This presentation slide is fully compatible with Google Slide and can be saved in JPG or PDF file format without any fuss. Click on the download button to download this template in no time.
-
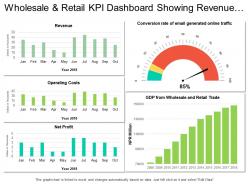 Wholesale and retail kpi dashboard showing revenue operating costs net profit
Presenting the KPI dashboard presentation template. This PowerPoint slide is fully editable in PowerPoint and is professionally designed. The user can bring changes to edit the objects in the slide like font size and font color without going through any hassle. This presentation slide is 100% compatible with Google Slide and can be saved in JPG or PDF file format without any fuss. Fast download this at the click of the button.
-
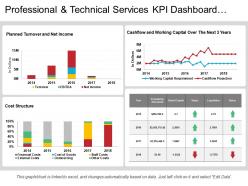 Professional and technical services kpi dashboard showing cost structure
Presenting this set of slides with name - Professional And Technical Services Kpi Dashboard Showing Cost Structure. This is a four stage process. The stages in this process are Professional And Technical Services, Services Management, Technical Management.
-
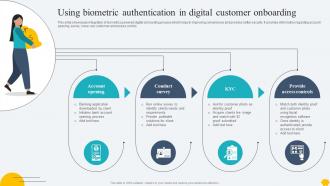 Digitalising Customer Onboarding Using Biometric Authentication In Digital Customer
This slide showcases integration of biometrics powered digital onboarding process which helps in improving convenience and provides better security. It provides information regarding account opening, survey, know your customer and access control. Introducing Digitalising Customer Onboarding Using Biometric Authentication In Digital Customer to increase your presentation threshold. Encompassed with Four stages, this template is a great option to educate and entice your audience. Dispence information on Using Biometric, Digital Customer using this template. Grab it now to reap its full benefits.
-
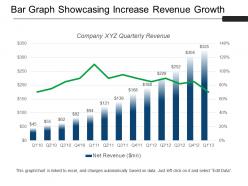 Bar graph showcasing increase revenue growth sample of ppt
Presenting the bar graph showcasing increase revenue growth sample of PPT. This PowerPoint theme is fully supported by Google Slides. Simple data input with linked Excel chart, just right click to input values. The picture quality of these slides does not change even when you project them on a large screen. Quick downloading speed and formats can be easily changed to other applications like JPEG and PDF. This template is suitable for marketing, salespersons, business managers, and entrepreneurs.
-
 Accounts receivable management icons
Presenting accounts receivable management icons. This is a accounts receivable management icons. This is a three stage process. The stages in this process are accounts receivable management, payment claim, invoices.
-
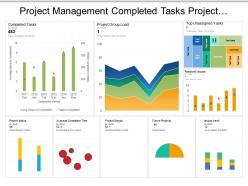 Project management completed tasks project group load dashboard
Preference to present design in standard and widescreen display view. PowerPoint design is goes well with Google slides. Fine quality Presentation template comes with editing options as color, text and font can be edited at any stage. Present the PPT slide by addition of business logo. Fast download and simple transform into JPEG and PDF document. Presentation design is downloadable with different nodes and stages. PowerPoint diagram comes with high resolution pixels.
-
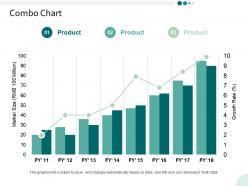 Combo chart finance ppt powerpoint presentation infographic template structure
Presenting this set of slides with name - Combo Chart Finance Ppt Powerpoint Presentation Infographic Template Structure. This is a three stages process. The stages in this process are Finance, Marketing, Management, Investment, Analysis.
-
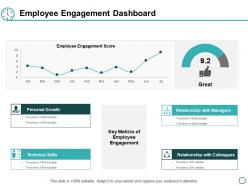 Employee engagement dashboard ppt powerpoint presentation layouts ideas
Presenting this set of slides with name - Employee Engagement Dashboard Ppt Powerpoint Presentation Layouts Ideas. This is a five stages process. The stages in this process are Personal Growth, Technical Skills, Relationship With Colleagues, Business, Management.
-
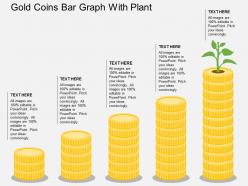 Gold coins bar graph with plant flat powerpoint design
We are proud to present our gold coins bar graph with plant flat powerpoint design. Graphic of gold coins and bar graph with plant has been used to craft this power point template diagram. This PPT diagram contains the concept of result analysis. Use this PPT diagram for business and marketing target related presentations.
-
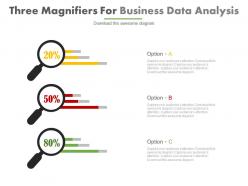 Three magnifiers for business data analysis powerpoint slides
Presenting three magnifiers for business data analysis powerpoint slides. This Power Point template diagram has been crafted with graphic of three magnifiers diagram. This PPT diagram contains the concept of business data analysis. Use this PPT diagram for business and finance related presentations.
-
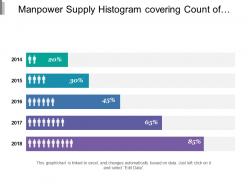 Manpower supply histogram covering count of hiring of year over year in percent
Presenting this set of slides with name - Manpower Supply Histogram Covering Count Of Hiring Of Year Over Year In Percent. This is a five stage process. The stages in this process are Manpower Supply, Manpower Service, Manpower Recruitment.
-
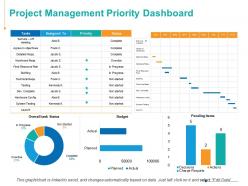 Project management priority dashboard marketing ppt powerpoint presentation inspiration outline
Presenting this set of slides with name - Project Management Priority Dashboard Marketing Ppt Powerpoint Presentation Inspiration Outline. This is a five stage process. The stages in this process are Staffing, Priority, Budget, Planned, Actual.
-
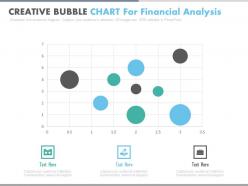 Creative bubble chart for financial analysis powerpoint slides
Presenting creative bubble chart for financial analysis powerpoint slides. This is a creative bubble chart for financial analysis powerpoint slides. This is a three stage process. The stages in this process are financials.
-
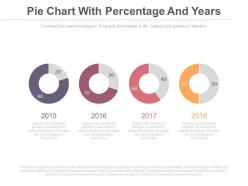 Four pie charts with percentage and years powerpoint slides
Presenting four pie charts with percentage and years powerpoint slides. This is a four pie charts with percentage and years powerpoint slides. This is a four stage process. The stages in this process are financials.
-
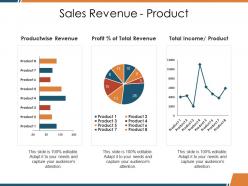 Sales revenue product ppt picture
Presenting this set of slides with name - Sales Revenue Product Ppt Picture. This is a three stage process. The stages in this process are Productwise Revenue, Total Revenue, Total Income, Business, Marketing.
-
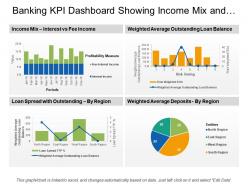 Banking kpi dashboard showing income mix and loan spread
Presenting this set of slides with name - Banking Kpi Dashboard Showing Income Mix And Loan Spread. This is a four stage process. The stages in this process are Banking, Finance, Money.
-
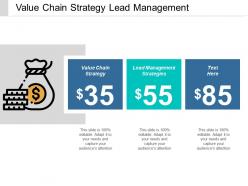 Value chain strategy lead management strategies collaborative strategy cpb
This is an editable three stages graphic that deals with topics like Value Chain Strategy, Lead Management Strategies, Collaborative Strategy to help convey your message better graphically. This product is a premium product available for immediate download, and is 100 percent editable in Powerpoint. Download this now and use it in your presentations to impress your audience.
-
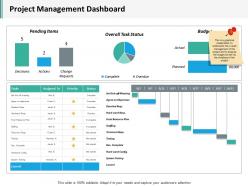 Project management dashboard snapshot ppt inspiration ideas
Presenting this set of slides with name - Project Management Dashboard Snapshot Ppt Inspiration Ideas. This is a three stage process. The stages in this process are Business, Management, Strategy, Analysis, Marketing.
-
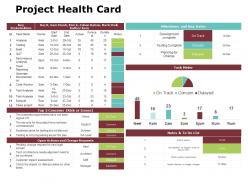 Project health card slide2 ppt powerpoint presentation gallery slides
Presenting this set of slides with name - Project Health Card Slide2 Ppt Powerpoint Presentation Gallery Slides. This is a two stage process. The stages in this process are Business, Management, Strategy, Analysis, Marketing.
-
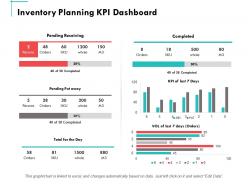 Inventory planning kpi dashboard ppt powerpoint presentation summary graphics
Presenting this set of slides with name - Inventory Planning Kpi Dashboard Ppt Powerpoint Presentation Summary Graphics. This is a four stages process. The stages in this process are Finance, Marketing, Management, Investment, Analysis.
-
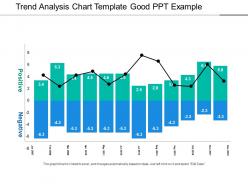 Trend analysis chart template good ppt example
Presenting Trend Analysis Chart Template Good Ppt Example. This PPT presentation is thoroughly researched by the experts and the slide consists of appropriate content that can be modified. It is fully customizable. You can add or delete the content as per your need. Not just this, you can also make the required changes in the texts and shapes. Download this professionally designed PPT, add your content and present it with confidence.
-
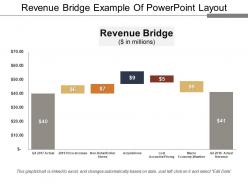 Revenue bridge example of powerpoint layout
Presenting this set of slides with name - Revenue Bridge Example Of Powerpoint Layout. This is a five stage process. The stages in this process are Revenue Bridge, Income Bridge, Earnings Bridge.
-
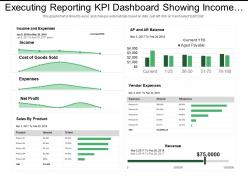 Executing reporting kpi dashboard snapshot showing income sales by product vendor expenses
Presenting this set of slides with name - Executing Reporting Kpi Dashboard Snapshot Showing Income Sales By Product Vendor Expenses. This is a four stage process. The stages in this process are Executive Reporting, Executive Analysis, Executive Performance.
-
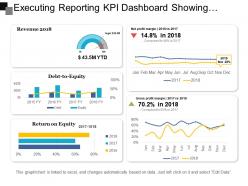 Executing reporting kpi dashboard showing revenue net profit margin debt to equity
Presenting this set of slides with name - Executing Reporting Kpi Dashboard Showing Revenue Net Profit Margin Debt To Equity. This is a five stage process. The stages in this process are Executive Reporting, Executive Analysis, Executive Performance.
-
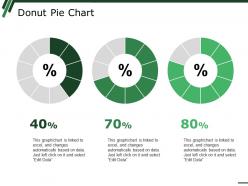 Donut pie chart ppt summary background images
Presenting Donut Pie Chart PPT Summary Background Images PPT slide. The donut design template designed by the professional team of SlideTeam to present the numerical data. The fully editable donut pie chart PowerPoint slide is compatible with Google Slide. You can modify the font size, font type, color, and shape of the donut design as the pie chart template can help a user in processing the data. You can insert the text related to the sales distribution of your organization. Numerous customized icons available at SlideTeam website, you can download and insert icons in your presentation.
-
 Our market share ppt show
Presenting this set of slides with name - Our Market Share Ppt Show. This is a four stage process. The stages in this process are Wages, Depreciation, Rent And Utilities, Marketing.
-
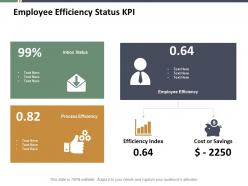 Employee efficiency status kpi ppt summary infographics
Presenting this set of slides with name - Employee Efficiency Status Kpi Ppt Summary Infographics. This is a four stage process. The stages in this process are Business, Management, Marketing.
-
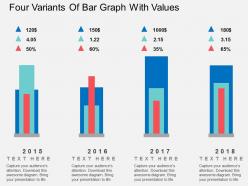 Four variants of bar graph with values flat powerpoint design
We are proud to present our four variants of bar graph with values flat powerpoint design. Graphic of four variants of bar graph with values has been used to craft this power point template diagram. This PPT diagram contains the concept of result analysis. Use this PPT diagram for business and marketing result related presentations.
-
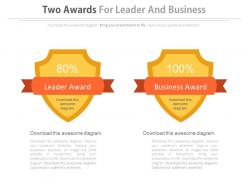 Two awards for leader and business powerpoint slides
Presenting two awards for leader and business powerpoint slides. This Power Point template slide has been crafted with graphic of two awards. This PPT slide contains the concept of success milestones representation. Use this PPT slide for business and finance related presentations.
-
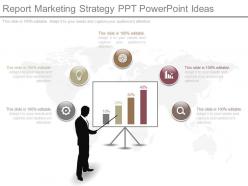 Ppt report marketing strategy ppt powerpoint ideas
Time saving PowerPoint template on part of designing and formatting. Professionally proficient PPT presentation layout. Easily editable colors, text, fonts, shapes, icons and orientation. Impressive picture quality provides high resolution output. Zero issue of pixilation when projected on wide screen. Hassle free inclusion and exclusion of company name, logo and trademark. Compatible with multiple software and formats. Marketers, strategists, business planners, students and teachers make vivid use of this slide design in their presentations.
-
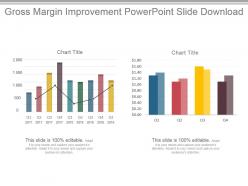 Gross margin improvement powerpoint slide download
Presenting gross margin improvement powerpoint slide download. Presenting gross margin improvement powerpoint slide download. Presenting gross margin improvement powerpoint slide download. This is a gross margin improvement powerpoint slide download. This is two stage process. The stages in this process are chart title, gross margin, improvement, business, success.
-
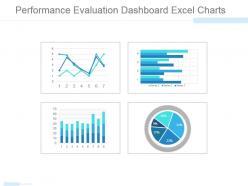 Performance evaluation dashboard excel charts powerpoint topics
Presenting performance evaluation dashboard excel charts powerpoint topics. This is a performance evaluation dashboard excel charts powerpoint topics. This is a four stage process. The stages in this process are graph, finance, dashboard, pie, business.
-
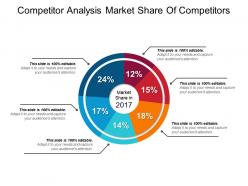 Competitor analysis market share of competitors ppt inspiration
Presenting competitor analysis market share of competitors PPT inspiration PPT slide. This presentation slide is widely applicable by a team of managers and business analyst who foresee the business in light of prosperity, by students and others. PPT has impressive picture quality with high resolution. 100 percent editable slide design. There is freedom to execute the changes in color, font, text and more as per one’s personal choice. Ease of personalization with your company name and logo. PPT is compatible with a wide variety of format options. PPT is harmonious with a set of software options, available both online and offline.
-
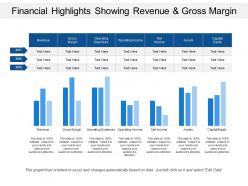 Financial highlights showing revenue and gross margin
Presenting this set of slides with name - Financial Highlights Showing Revenue And Gross Margin. This is a seven stage process. The stages in this process are Highlights, High Point, High Spot.
-
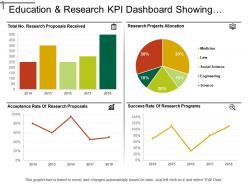 Education and research kpi dashboard showing research project allocation
Presenting education and research KPI dashboard showing research project allocation PPT slide. The project reporting design presentation template designed by professional team of SlideTeam. The research project PPT slide is fully customizable in PowerPoint. The project allocation dashboard PowerPoint slide is also compatible with Google Slide so a user can share this slide with others. A user can make changes in the font size, font type, color as well as dimensions of the allocated project report detail slide as per the requirement. You may edit the value in the education KPI dashboard PowerPoint template as the slide gets linked with the Excel sheet.
-
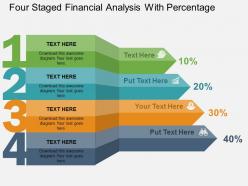 Four staged financial analysis with percentage flat powerpoint design
We are proud to present our four staged financial analysis with percentage flat powerpoint design. Four staged colored numeric banner graphic has been used to design this power point template diagram. This PPT diagram contains the concept of financial analysis and percentage representation. Use this PPT diagram for business and finance related presentations.
-
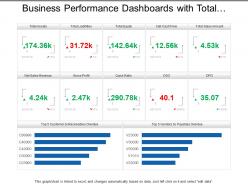 Business performance dashboards with total assets gross profit and cash flow
Presenting, business performance dashboards with total assets gross profit and cash flow PPT deck. Adjustable color, text, and font as per the need. Engaging and easy to comprehend infographic format. Even download and can be converted into JPG and PDF format. The advantage of the addition of logo and trademarks for personalization. Adaptable to widescreen view without the problem of pixelation. Exposition illustration well-matched with google slides. Related designs available with different nodes and stages. Possible in 4:3 and full-screen version 16:9
-
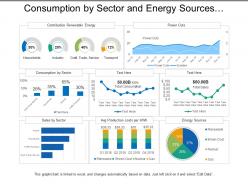 Consumption by sector and energy sources utilities dashboard
Presenting this set of slides with name - Consumption By Sector And Energy Sources Utilities Dashboard. This is a three stage process. The stages in this process are Utilities, Use, Advantage.
-
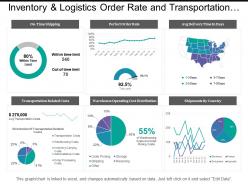 Inventory and logistics order rate and transportation costs dashboards
Presenting this set of slides with name - Inventory And Logistics Order Rate And Transportation Costs Dashboards. This is a three stage process. The stages in this process are Inventory And Logistics, Inventory Management, Warehousing And Inventory Management.
-
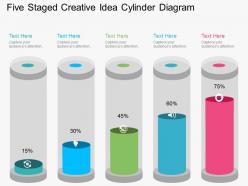 Fg five staged creative idea cylinder diagram flat powerpoint design
Presenting fg five staged creative idea cylinder diagram flat powerpoint design. Five staged cylinder diagram has been used to craft this power point template diagram. This PPT diagram contains the concept of creative business generation. Use this PPT diagram for business and marketing related presentations.
-
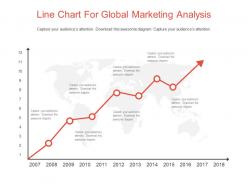 Line chart for global marketing analysis powerpoint slides
Presenting line chart for global marketing analysis powerpoint slides. This Power Point template slide has been crafted with graphic of line chart. This PPT slide contains the concept of global marketing analysis representation. Use this PPT slide for business and marketing related presentations.
-
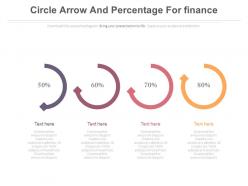 Four circle arrows and percentage for finance powerpoint slides
Presenting four circle arrows and percentage for finance powerpoint slides. This is a four circle arrows and percentage for finance powerpoint slides. This is a four stage process. The stages in this process are financials.


