-
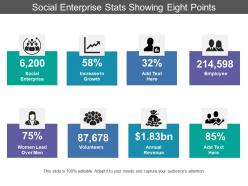 Social enterprise stats showing eight points
Presenting this set of slides with name - Social Enterprise Stats Showing Eight Points. This is a eight stage process. The stages in this process are Stats, Statistics, Data.
-
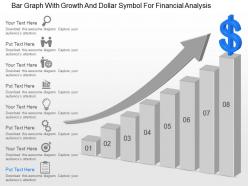 Bar graph with growth and dollar symbol for financial analysis ppt template slide
Visually appealing PPT presentation slides. Possess the ability to easily grab the attention of the audience without putting much efforts. Creates a strong connection between the audience and the presentation. User-friendly PowerPoint backgrounds. Enables easy understanding and memorising of the contents displayed on these templates. Can be viewed on wide screens without the images and icons being pixelating.
-
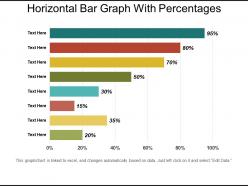 Horizontal bar graph with percentages
Presenting Horizontal Bar Graph With Percentages PowerPoint slide. This PowerPoint slide is completely editable so you can modify, font type, font color, shape and image according to your requirements. This Google Slides compatible PPT is available in 4:3 and 16:9 aspect ratios. Easy to download PPT layout and can be saved in different formats like JPG, PDF, and PNG.
-
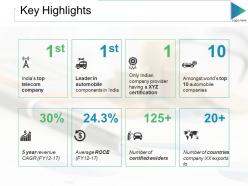 Key highlights ppt slides microsoft
Presenting this set of slides with name - Key Highlights Ppt Slides Microsoft. This is a eight stage process. The stages in this process are Leader In Automobile, Business, Marketing, Finance.
-
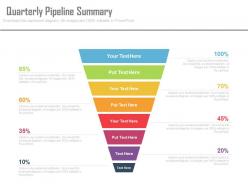 New quarterly pipeline summary powerpoint slides
New quarterly pipeline summary PPT Slide. Proper balance of colors, shapes and stages in relation to presentation topic. High resolution and fine quality PowerPoint slides. Easy and quick downloading. Compatible with multiple software options available both online and offline. Widely used by business owners, strategists, marketers, investors, financial executives, professors and students. Guidance for executing the changes has been provided for assistance. Modify and personalize the presentation by including the company name and logo.
-
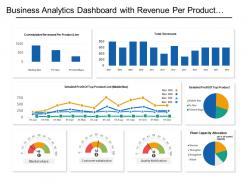 Business analytics dashboard snapshot with revenue per product line and detailed profit
This is a eight stage process. The stages in this process are Business Analytics, BA, Organizations Data.
-
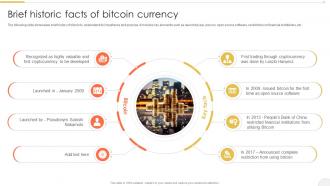 Brief Historic Facts Comprehensive Bitcoin Guide To Boost Cryptocurrency BCT SS
The following slide showcases brief history of bitcoin to understand its importance and purpose. It includes key elements such as launched year, person, open source software, restrictions on financial institutions, etc.Introducing Brief Historic Facts Comprehensive Bitcoin Guide To Boost Cryptocurrency BCT SS to increase your presentation threshold. Encompassed with eight stages, this template is a great option to educate and entice your audience. Dispence information on Financial Institutions, Bitcoin, Source Software, using this template. Grab it now to reap its full benefits.
-
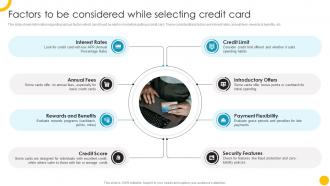 Factors To Be Considered Guide To Use And Manage Credit Cards Effectively Fin SS
This slide shows information regarding various factors which can should be kept in mind while getting a credit card. These considerations factors are interest rates, annual fees, rewards and benefits, etc. Introducing Factors To Be Considered Guide To Use And Manage Credit Cards Effectively Fin SS to increase your presentation threshold. Encompassed with eight stages, this template is a great option to educate and entice your audience. Dispence information on Interest Rates, Credit Limit, Introductory Offers, using this template. Grab it now to reap its full benefits.
-
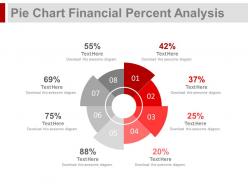 Eight staged pie chart financial percentage analysis powerpoint slides
Good combination of icons and text using a circular diagram. Compatible with number of software options. Colors and text can be easily changed as the PPT slide is completely editable. Personalize the presentation with individual company name and logo. Available in both Standard and Widescreen slide size. Easy and quick downloading process. Flexible option for conversion in PDF or JPG formats. Completely adaptable with Google slides. Useful for finance professionals, accounts team, education firms etc.
-
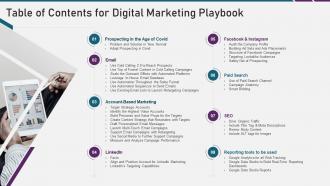 Table of contents for digital marketing playbook
Introducing Table Of Contents For Digital Marketing Playbook to increase your presentation threshold. Encompassed with eight stages, this template is a great option to educate and entice your audience. Dispence information on Prospecting Age Covid, Account-Based Marketing, SEO, Paid Search, Facebook And Instagram, using this template. Grab it now to reap its full benefits.
-
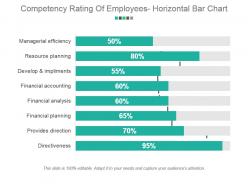 Competency rating of employees horizontal bar chart sample ppt presentation
Presenting competency rating of employees horizontal bar chart sample ppt presentation. This is a competency rating of employees horizontal bar chart sample ppt presentation. This is a eight stage process. The stages in this process are managerial efficiency, resource planning, develop and implements, financial accounting, financial analysis, financial planning, provides direction, directiveness.
-
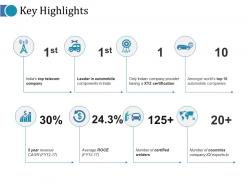 Key highlights ppt model graphics template
Presenting this set of slides with name - Key Highlights Ppt Model Graphics Template. This is a eight stage process. The stages in this process are Number Of Certified Welders, Finance, Icons, Strategy.
-
 Government and public works kpi dashboard showing criminal records
Presenting this set of slides with name - Government And Public Works Kpi Dashboard Showing Criminal Records. This is a eight stage process. The stages in this process are Government And Public Works, Government And Public Tasks.
-
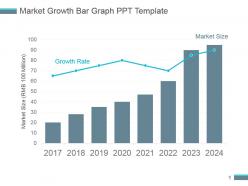 Market growth bar graph ppt template
Presenting market growth bar graph ppt template. This is a market growth bar graph ppt template. This is a eight stage process. The stages in this process are market size, growth rate.
-
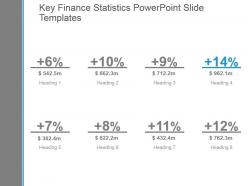 Key finance statistics powerpoint slide templates
Presenting key finance statistics powerpoint slide templates. This is a key finance statistics powerpoint slide templates. This is a eight stage process. The stages in this process are business, success, strategy, management, marketing, process.
-
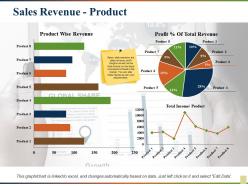 Sales revenue product revenue new customers gross profit
Presenting this set of slides with name - Sales Revenue Product Revenue New Customers Gross Profit. This is a eight stage process. The stages in this process are Product Wise Revenue, Profit Percentage Of Total Revenue, Total Income, Product.
-
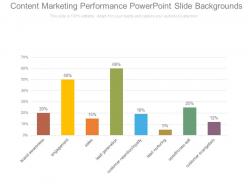 Content marketing performance powerpoint slide backgrounds
Presenting content marketing performance powerpoint slide backgrounds. This is a content marketing performance powerpoint slide backgrounds. This is a eight stage process. The stages in this process are brand awareness, engagement, sales, lead generation, customer retention loyalty, lead nurturing, upsell cross sell, customer evangelism.
-
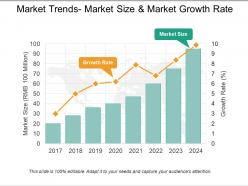 Market trends market size and market growth rate ppt infographics
Presenting market trends market size and market growth rate ppt infographics. This is a market trends market size and market growth rate ppt infographics. This is a eight stage process. The stages in this process are growth rate, market size.
-
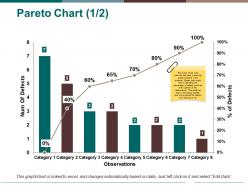 Pareto chart ppt pictures example introduction
Presenting Pareto chart PPT pictures example introduction PPT slide. The Pareto chart picture PowerPoint slide designed professionally by the team of SlideTeam and it is useful for illustrating the count of defects. The Pareto chart introduction template is the data driven template and can edit the count as the Pareto style slide gets linked with the Excel sheet. The graphical Pareto chart picture PPT slide is customizable in PowerPoint and compatible with Google Slide. A presenter can make changes in the visual Pareto chart picture template such as font size, font type, color and dimensions of the charts.
-
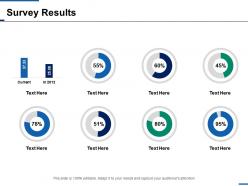 Survey results finance ppt inspiration background designs
Presenting this set of slides with name - Survey Results Finance Ppt Inspiration Background Designs. This is a eight stage process. The stages in this process are Finance, Analysis, Business, Investment, Marketing.
-
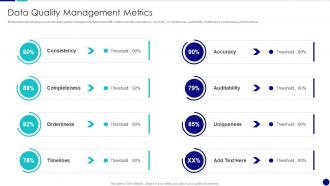 Data Quality Management Metrics QCP Templates Set 2 Ppt Pictures
Mentioned slide displays customer data quality management dashboard with metrics namely consistency, accuracy, completeness, auditability, orderliness, uniqueness and timeliness. Increase audience engagement and knowledge by dispensing information using Data Quality Management Metrics QCP Templates Set 2 Ppt Pictures. This template helps you present information on eight stages. You can also present information on Consistency, Completeness, Orderliness, Timelines, Accuracy using this PPT design. This layout is completely editable so personaize it now to meet your audiences expectations.
-
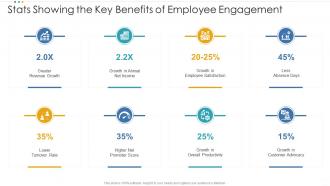 Stats showing the key benefits of employee engagement
Introducing our premium set of slides with Stats Showing The Key Benefits Of Employee Engagement. Ellicudate the eight stages and present information using this PPT slide. This is a completely adaptable PowerPoint template design that can be used to interpret topics like Greater Revenue Growth, Growth In Annual Net Income, Lower Turnover Rate. So download instantly and tailor it with your information.
-
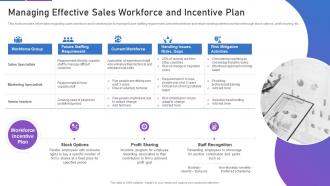 Sales playbook template managing effective sales workforce and incentive plan
This slide provides information regarding sales workforce and incentive plan to manage future staffing requirement, present workforce and retain existing talented workforce through stock options, profit sharing, etc. Increase audience engagement and knowledge by dispensing information using Sales Playbook Template Managing Effective Sales Workforce And Incentive Plan. This template helps you present information on eight stages. You can also present information on Workforce Group, Future Staffing Requirement, Current Workforce, Handling Issues, Risks, Gaps, Risk Mitigation Activities, Stock Options, Profit Sharing, Staff Recognition using this PPT design. This layout is completely editable so personaize it now to meet your audiences expectations.
-
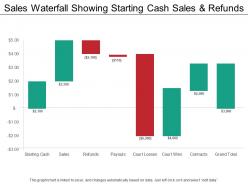 Sales waterfall showing starting cash sales and refunds
Presenting this set of slides with name - Sales Waterfall Showing Starting Cash Sales And Refunds. This is a eight stage process. The stages in this process are Sales Waterfall, Waterfall Chart.
-
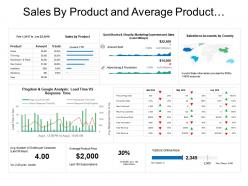 Sales by product and average product price e commerce dashboard
Presenting this set of slides with name - Sales By Product And Average Product Price E Commerce Dashboard. This is a eight stage process. The stages in this process are Mercantilism, Commercialism, Ecommerce.
-
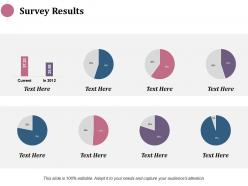 Survey results finance ppt infographics design inspiration
Presenting this set of slides with name - Survey Results Finance Ppt Infographics Design Inspiration. This is a eight stage process. The stages in this process are Finance, Analysis, Business, Investment, Marketing.
-
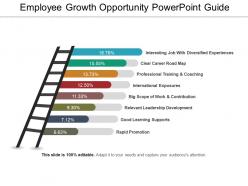 Employee growth opportunity powerpoint guide
Presenting Employee Growth Opportunity PowerPoint Guide. This template is entirely customizable as per your needs. Get this slide and make changes in its colors, font type, and font size. Increase or decrease the number of points as per the requirements and save this in JPG, PDF, JPEG formats. It is completely compatible with the Google Slides. Get this slide with high-resolution graphics in standard screen and widescreen.
-
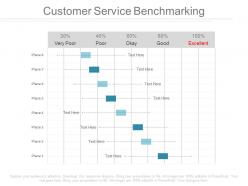 Customer service benchmarking ppt slides
Presenting customer service benchmarking ppt slides. This is a customer service benchmarking ppt slides. This is a eight stage process. The stages in this process are business, strategy, management.
-
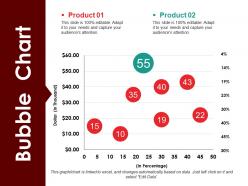 Bubble chart powerpoint ideas
Presenting this set of slides with name - Bubble Chart Powerpoint Ideas. This is a eight stage process. The stages in this process are Business, Marketing, Strategy, Finance, Success.
-
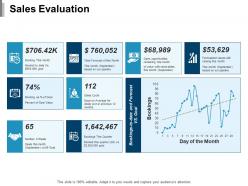 Sales evaluation ppt model infographic template
This is a eight stage process. The stages in this process are Product, Percentage, Marketing, Business.
-
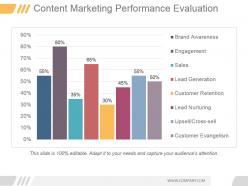 Content marketing performance evaluation ppt sample
Presenting content marketing performance evaluation ppt sample. This is a content marketing performance evaluation ppt sample. This is a eight stage process. The stages in this process are brand awareness, engagement, sales, lead generation, customer retention, lead nurturing, upsell cross sell, customer evangelism.
-
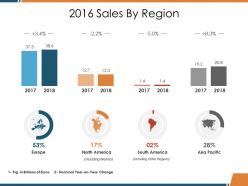 Sales by region ppt design ideas
Presenting this set of slides with name - Sales By Region Ppt Design Ideas. This is a eight stage process. The stages in this process are Europe, North America, South America, Asia Pacific, Business.
-
 Inventory and logistics dashboard ppt powerpoint presentation example 2015
Presenting this set of slides with name - Inventory And Logistics Dashboard Ppt Powerpoint Presentation Example 2015. This is a eight stage process. The stages in this process are Finance, Analysis, Business, Investment, Marketing.
-
 Business plan management summary powerpoint guide
Presenting business plan management summary powerpoint guide. This is a business plan management summary powerpoint guide. This is a eight stage process. The stages in this process are market revenue, average price per unit industrial cameras, average price per unit frame grabbers, market size for last year of study period, base year market growth rate, compound annual growth rate, degree of technical change, market concentration.
-
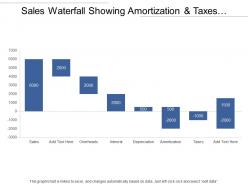 Sales waterfall showing amortization and taxes with negative values
Presenting this set of slides with name - Sales Waterfall Showing Amortization And Taxes With Negative Values. This is a eight stage process. The stages in this process are Sales Waterfall, Waterfall Chart.
-
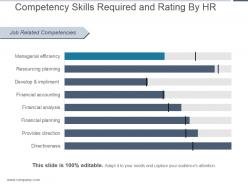 Competency skills required and rating by hr ppt example 2017
Presenting competency skills required and rating by hr ppt example 2017. This is a competency skills required and rating by hr ppt example 2017. This is a eight stage process. The stages in this process are job related competencies, managerial efficiency, resourcing planning, develop and implement, financial accounting, financial analysis, financial planning, provides direction, directiveness.
-
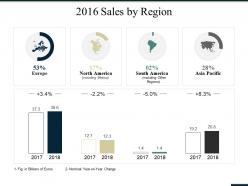 Sales by region ppt summary icons
Presenting this set of slides with name - Sales By Region Ppt Summary Icons. This is a eight stage process. The stages in this process are Europe, North America, South America, Asia Pacific, Business.
-
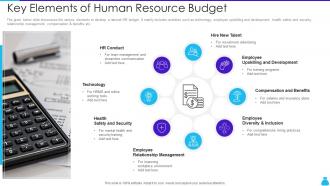 Key Elements Of Human Resource Budget
The given below slide showcases the various elements to develop a rational HR budget. It mainly includes activities such as technology, employee upskilling and development, health safety and security, relationship management, compensation and benefits etc. Introducing our premium set of slides with Key Elements Of Human Resource Budget. Elucidate the eight stages and present information using this PPT slide. This is a completely adaptable PowerPoint template design that can be used to interpret topics like Employee Relationship Management, Employee Upskilling And Development, Technology. So download instantly and tailor it with your information.
-
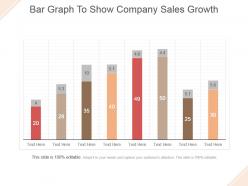 Bar graph to show company sales growth powerpoint slide themes
Presenting bar graph to show company sales growth powerpoint slide themes. This is a bar graph to show company sales growth powerpoint slide themes. This is a eight stage process. The stages in this process are business, marketing, bar graph, growth, management.
-
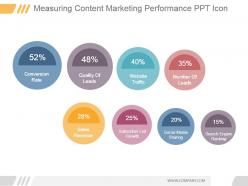 Measuring content marketing performance ppt icon
Presenting measuring content marketing performance ppt icon. This is a measuring content marketing performance ppt icon. This is a eight stage process. The stages in this process are conversion rate, quality of leads, website traffic, number of leads, sales revenue, subscriber list growth, social media sharing, search engine ranking.
-
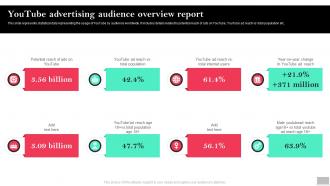 Youtube Advertising Audience Overview Report Social Media Advertising To Enhance Brand Awareness
This slide represents statistical data representing the usage of YouTube by audience worldwide. It includes details related to potential reach of ads on YouTube, YouTube ad reach vs total population etc. Introducing Youtube Advertising Audience Overview Report Social Media Advertising To Enhance Brand Awareness to increase your presentation threshold. Encompassed with eight stages, this template is a great option to educate and entice your audience. Dispence information on Youtube Advertising, Audience Overview Report, using this template. Grab it now to reap its full benefits.
-
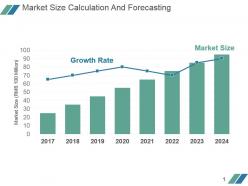 Market size calculation and forecasting powerpoint slide design ideas
Presenting market size calculation and forecasting powerpoint slide design ideas. This is a market size calculation and forecasting powerpoint slide design ideas. This is a eight stage process. The stages in this process are market size rmb, growth rate, market size.
-
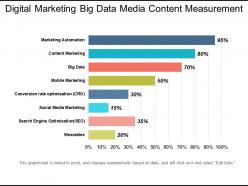 Digital marketing big data media content measurement
Presenting Digital Marketing Big Data Media Content Measurement PowerPoint slide. This easy to download PPT theme can be easily opened and saved in various formats like JPG, PDF, and PNG. You can alter the font size, font type, font color, and shape used according to your needs as this PPT layout is 100% customizable. This PowerPoint template is Google Slides compatible and is easily accessible.
-
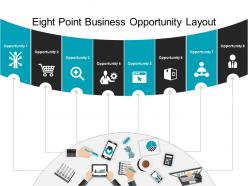 Eight point business opportunity layout powerpoint shapes
Presenting Eight Point Business Opportunity Layout PowerPoint Shapes. This PPT template is completely compatible with the Google Slides and can be transformed into various formats. This slide can be viewed on standard screen i.e. 4:3 and on widescreen 16:9. Change the colors, the font type and the font size of this slide as per your presentation theme. You are free to make changes in the template to match it to the presentation theme.
-
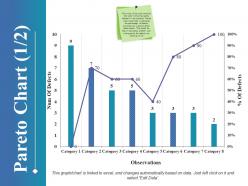 Pareto chart ppt styles graphics example
Presenting Pareto chart PPT styles graphics example PPT slide. The Pareto graph style PowerPoint slide designed by the professional team of SlideTeam is useful for illustrating the count of detects. The Pareto chart graphic style template is the data driven template and you can edit the value as the slide gets linked with the Excel data sheet. The graphical Pareto chart style slide is customizable in PowerPoint as well as compatible with Google Slide so a user can share it with others. A presenter can modify the visual Pareto chart template such as font size, font type, color and dimensions of graphs to make the concepts easier for the viewers.
-
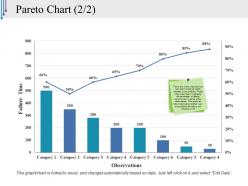 Pareto chart ppt styles graphics pictures
Presenting Pareto chart PPT styles graphics pictures PPT slide. The graphical Pareto chart PowerPoint slide designed professionally by the team of SlideTeam is useful for plotting the data in declining order. The Pareto chart graphic template is the data driven template and the user can edit the value as the slide gets linked with the Excel data sheet. The graphical Pareto chart slide is customizable in PowerPoint along with that this template is compatible with Google Slide so a user can share it with others via the internet. You can modify the visual Pareto chart template such as font size, font type, color and dimensions of icons to make the concepts easier for the viewers.
-
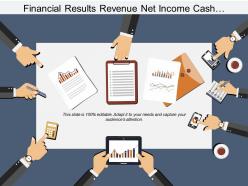 Financial results revenue net income cash flow hands
Presenting this set of slides with name - Financial Results Revenue Net Income Cash Flow Hands. This is a eight stage process. The stages in this process are Financial Results, Financial Report, Accounting Results.
-
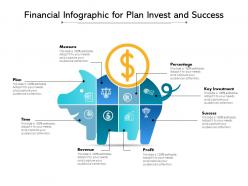 Financial infographic for plan invest and success
Presenting this set of slides with name Financial Infographic For Plan Invest And Success. This is a eight stage process. The stages in this process are Measure, Plan, Time, Revenue, Profit, Success, Key Investment, Percentage. This is a completely editable PowerPoint presentation and is available for immediate download. Download now and impress your audience.
-
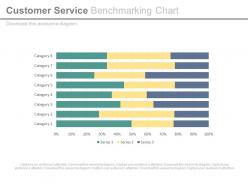 Customer service benchmarking chart ppt slides
Presenting customer service benchmarking chart ppt slides. This is a customer service benchmarking chart ppt slides. This is a eight stage process. The stages in this process are finance, marketing, strategy, business.
-
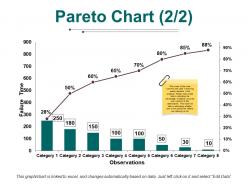 Pareto chart ppt pictures file formats
Presenting Pareto chart PPT pictures file formats PPT slide. The Pareto graph picture style PowerPoint slide designed by the professional team of SlideTeam is useful for illustrating the count of failures. The Pareto chart file style template is the data driven template and you can edit the value as the file style slide gets linked with the Excel sheet. The graphical Pareto chart picture style slide is customizable in PowerPoint as well as compatible with Google Slide. A presenter can modify the visual Pareto chart file format template such as font size, font type, color and dimensions of the charts.
-
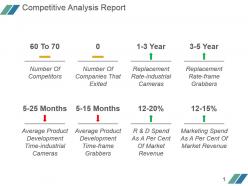 Competitive analysis report powerpoint presentation
Presenting competitive analysis report powerpoint presentation. This is a competitive analysis report powerpoint presentation. This is a eight stage process. The stages in this process are business, marketing, finance, strategy, analysis.
-
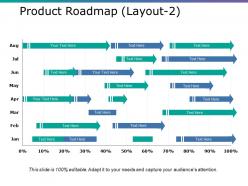 Product roadmap ppt model tips
Presenting this set of slides with name - Product Roadmap Ppt Model Tips. This is a eight stage process. The stages in this process are Percentage, Finance, Business, Arrows, Management.
-
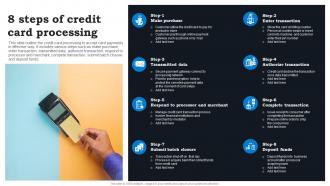 8 Steps Of Credit Card Processing
This slide outline the credit card processing to accept card payments in effective way. It includes various steps such as make purchase, enter transaction, transmitted data, authorize transaction, respond to processor and merchant, compete transaction, submit batch closure and deposit funds. Presenting our set of slides with 8 Steps Of Credit Card Processing. This exhibits information on eight stages of the process. This is an easy to edit and innovatively designed PowerPoint template. So download immediately and highlight information on Make Purchase, Enter Transaction.
-
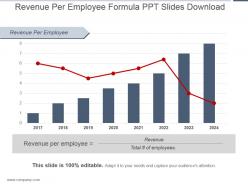 Revenue per employee formula ppt slides download
Presenting revenue per employee formula ppt slides download. This is a revenue per employee formula ppt slides download. This is a eight stage process. The stages in this process are revenue per employee, revenue, total of employees.
-
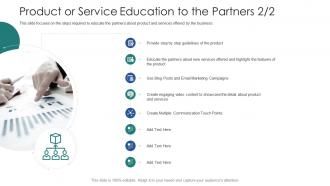 Product or service education to the partners services vendor channel partner training
This slide focuses on the steps required to educate the partners about product and services offered by the business. Introducing Product Or Service Education To The Partners Services Vendor Channel Partner Training to increase your presentation threshold. Encompassed with eight stages, this template is a great option to educate and entice your audience. Dispence information on Services, Email Marketing, Product, Communication, using this template. Grab it now to reap its full benefits.
-
 Business market assessment powerpoint template
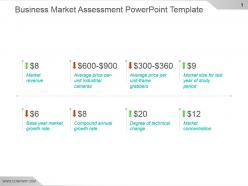
Presenting business market assessment powerpoint template. This is a business market assessment powerpoint template. This is a eight stage process. The stages in this process are market revenue, base year market growth rate, average price per-unit industrial cameras, compound annual growth rate, degree of technical change, average price per unit frame grabbers, market size for last year of study period, market concentration.
-
 Loan categories tenant loan ppt powerpoint presentation model background image
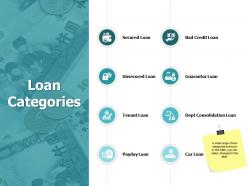
Presenting this set of slides with name Loan Categories Tenant Loan Ppt Powerpoint Presentation Model Background Image. This is a eight stage process. The stages in this process are Loan Categories, Secured Loan, Tenant Loan, Icons, Strategy. This is a completely editable PowerPoint presentation and is available for immediate download. Download now and impress your audience.
-
 Global headcount matrix for company
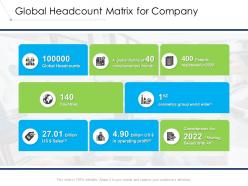
Presenting this set of slides with name Global Headcount Matrix For Company. This is a eight stage process. The stages in this process are Global, Complementary, Cosmetics. This is a completely editable PowerPoint presentation and is available for immediate download. Download now and impress your audience.
-
 Sales performance ytd ppt powerpoint presentation outline summary
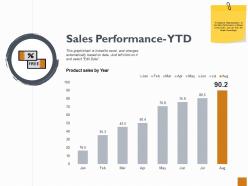
Presenting this set of slides with name - Sales Performance Ytd Ppt Powerpoint Presentation Outline Summary. This is a eight stages process. The stages in this process are Finance, Marketing, Management, Investment, Analysis.
-
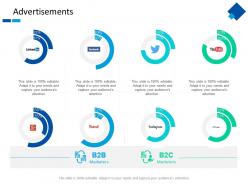 Advertisements finance ppt powerpoint presentation inspiration portrait
Presenting this set of slides with name - Advertisements Finance Ppt Powerpoint Presentation Inspiration Portrait. This is a eight stages process.The stages in this process are Finance, Marketing, Management, Investment, Analysis.
Toggle Nav

Skip to Content

Search
5
Notifications 5
-
 SlideTeam has published a new blog titled "Must-Have Legal Agreement Templates with Examples and Samples".
6 hours ago
-
 SlideTeam has published a new blog titled "Top 10 Flow Map Templates with Examples and Samples".
6 hours ago
-
 SlideTeam has published a new blog titled "Top 5 Definition Slide Templates with Examples and Samples".
6 hours ago
-
 SlideTeam has published a new blog titled "Top Ten 5-Year Roadmap Templates with Samples and Examples".
6 hours ago
-
 SlideTeam has published a new blog titled "Las 10 mejores plantillas de hojas de ruta de capacitación con ejemplos y muestras".
6 hours ago


