

Project management time impact analysis powerpoint presentation slides





Try Before you Buy Download Free Sample Product
 Impress Your
 Audience
 100%
100% Editable
 Save Hours
 of Time


Create a perfect presentation on project management to impress your boss and clients. Considering that this is an exhaustive task, we have come up with a readymade professionally designed project management time impact analysis PowerPoint slides. You can use this presentation deck to lay emphasis on fundamentals of project management phases. Besides this, you can also showcase time analysis results or reasons for potential delay in completing a project using these professional project management templates. This PPT presentation also illustrates detailed procedure of performing a time impact analysis. But that’s not all as we provide you exclusively designed templates on budget report, milestones achieved, risk management report, project health card, project issues report and more. So, what else you are looking for? It’s time to get your next PowerPoint show done quickly. Cover the essentials of project report using creatively designed project management PPT visuals.
People who downloaded this PowerPoint presentation also viewed the following :
Content of this Powerpoint Presentation
Slide 1: This slide intorduces Project Management Time Impact analysis. State Your Company Name and get started.
Slide 2: This is an Agenda slide. State your agendas here.
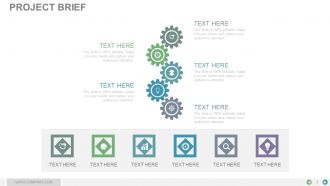
Slide 3: This slide presents a Project brief with respective imagery and text boxes to go with.
Slide 4: This slide presents a Project description with imagery and text boxes to go with.
Slide 5: This slide displays a Project management team matrix to define the team members and roles/responsibilities.
Slide 6: This slide showcases a Project progress summary in terms of months in different text boxes.
Slide 7: This slide displays Project Progress Summary in terms of Iteration and months. The iteration processes show- Scheduling, Absences, Profile Management, Programme Management, Advanced Scheduling, Enrolment, Advanced Scheduling, Enrolment, Notification, Business Analytics, Midterm Presentation.
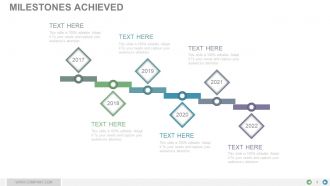
Slide 8: This slide shows Milestones achieved. State important accomplishments here.
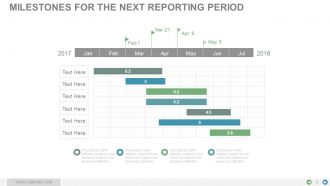
Slide 9: This slide shows Milestones for the next reporting period. State your important milestones here.
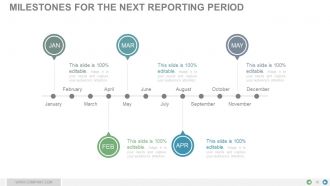
Slide 10: This is another slide on Milestones for the next reporting period in timeline form. State your important milestones here.
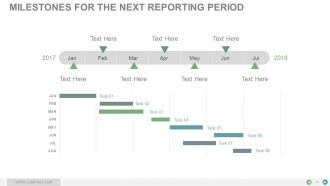
Slide 11: This is another side for Milestones for the next reporting period in Gantt chart form. State your important milestones here.
Slide 12: This slide presents Impact of Milestone/Non achievement.
Slide 13: This slide showcases Project Work plan Project Execution plan.
Slide 14: This slide showcases another variation on Project Work plan Project Execution plan.
Slide 15: This slide displays a Budget report for the Project.
Slide 16: This slide showcases Project Budgeting on Actual v/s Planned.
Slide 17: This slide shows a Risk management report with severity and likelihood factors/parameters.
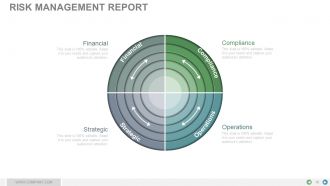
Slide 18: This slide shows a Risk management report with the following factors- Compliance, Operations, Financial, Strategic
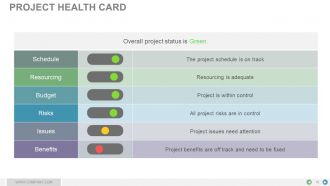
Slide 19: This slide displays a Project Health card to assess the direction and speed of the project.
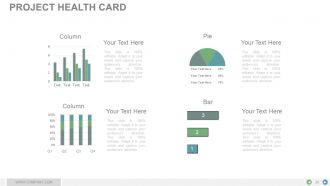
Slide 20: This slide displays a detailed Project Health card in pie charts, column graph with text boxes.
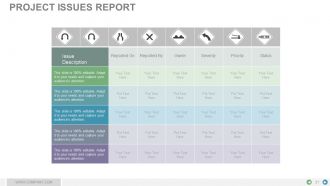
Slide 21: This slide presents a Project Issues report with- Issue Description, Reported On, Reported By, Owner, Severity, Priority, Status.
Slide 22: This slide is titled Additional slides for moving forward. You may change the content as per need.
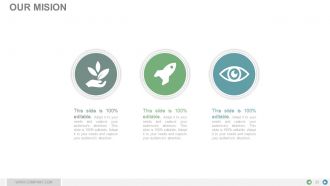
Slide 23: This is Our mission slide with imagery and text boxes to go with.
Slide 24: This is Our team slide with names and designation.
Slide 25: This is an About us slide to state company specifications etc.
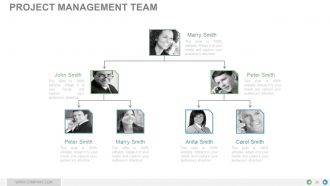
Slide 26: This slide presents a Project Management Team with names and designation.
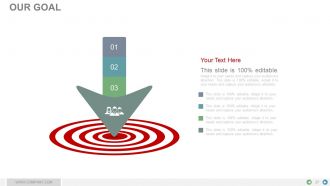
Slide 27: This is an Our Goal slide. State your important goals here.
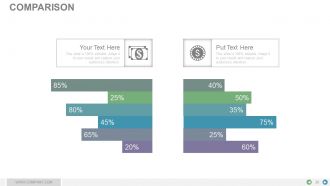
Slide 28: This slide shows Comparison of two entities in butterfly chart form.
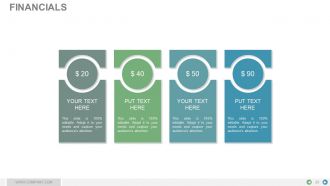
Slide 29: This slide presents Financial scores to display.
Slide 30: This is a Quotes slide to highlight, or state anything specific.
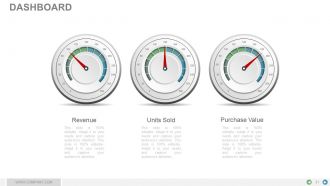
Slide 31: This is a Dashboard slide displaying- Revenue, Purchase Value, Units Sold.
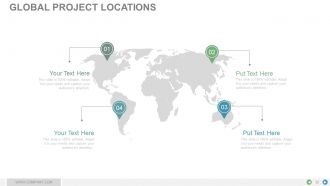
Slide 32: This slide showcases Global Project Locations with a World map and text boxes to make it explicit.
Slide 33: This slide shows Project Events Timeline with icons and text boxes.
Slide 34: This slide displays Critical notes on Challenge, Positive Attitude, Balanced Lifestyle.
Slide 35: This is a Newspaper slide to highlight something or add memorabilia.
Slide 36: This slide presents a PUZZLE slide with the following subheadings- Integrity and Judgment, Critical and Decision Making, Leadership, Agility.
Slide 37: This is a Target slide. State your targets here.
Slide 38: This is a Circular slide to show information, specification etc.
Slide 39: This is a MATRIX slide. Put relevant comparing data here.
Slide 40: This is a LEGO slide with text boxes to show information.
Slide 41: This is a People's silhouettes slide. Use it the way you want to show solutions etc.
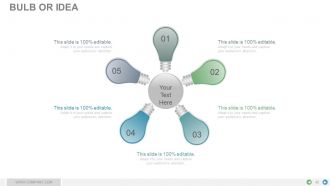
Slide 42: This is a Bulb or Idea slide to state a new idea or highlight specifications/information etc.
Slide 43: This slide shows a Magnifying glass with text boxes.
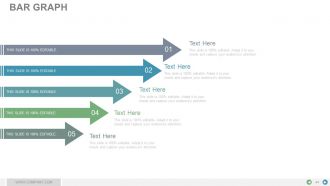
Slide 44: This slide presents a Bar graph in arrow form with text boxes.
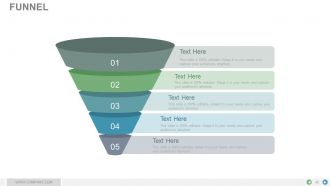
Slide 45: This is a Funnel slide. Showcase the funnel aspect of your team, company, product etc.
Slide 46: This is a Thank You slide with Address# street number, city, state, Contact Number, Email Address.
Project management time impact analysis powerpoint presentation slides with all 46 slides:
Reach your destination with our Project Management Time Impact Analysis Complete Powerpoint Deck With Slides. Your thoughts will trace the right path.
-
Project Management Time Impact Analysis
-
Agenda
-
Project Brief
-
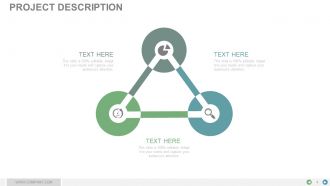
Project Description
-
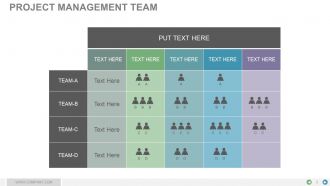
Project Management Team
-
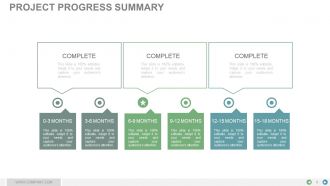
Project Progress Summary
-
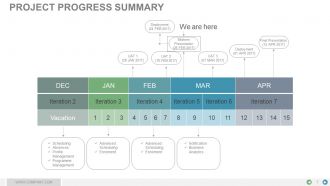
Project Progress Summary
-
Milestones Achieved
-
Milestones for the Next Reporting Period
-
Milestones for the Next Reporting Period
-
Milestones for the Next Reporting Period
-
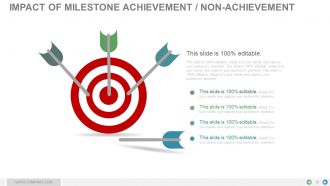
Impact of Milestone Achievement Non Achievement
-

PROJECT WORK PLAN PROJECT EXECUTION PLAN
-
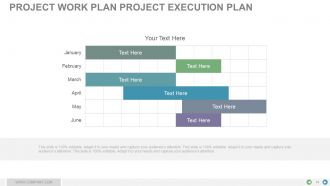
PROJECT WORK PLAN PROJECT EXECUTION PLAN
-

Budget Report
-
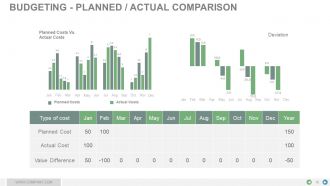
Budgeting Planned Actual Comparison
-
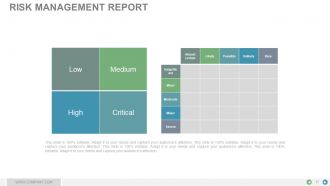
Risk Management Report
-
Risk Management Report
-
Project Health Card
-
Project Health Card
-
Project Issues Report
-
Additional Slides
-
OUR MISSION
-

Our Team
-

About Us
-
Project Management Team
-
OUR GOAL
-
Comparison
-
FINANCIALS
-

QUOTES
-
Dashboard
-
Global Project Locations
-
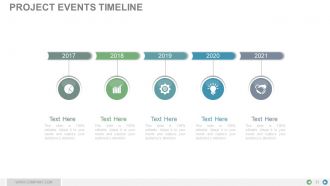
Project Events Timeline
-
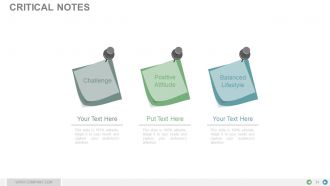
Critical Notes
-

Newspaper
-
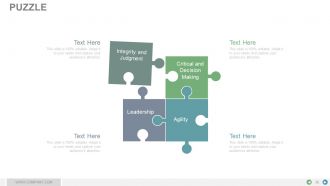
Puzzle
-
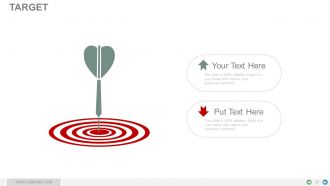
Target
-
Circular
-
Matrix
-
LEGO
-
Silhouettes
-
BULB OR IDEA
-

Magnifying Glass
-
Bar Graph
-
FUNNEL
-
Thank You Slide
FAQs for Project management time impact analysis
Dude, time impact analysis is clutch for proving delays actually screwed up your schedule. Instead of everyone arguing over what happened, you've got hard data showing which tasks got delayed and by how much. Honestly saved my butt in so many client meetings where people were just throwing blame around. You can pinpoint what really caused the delays, figure out the actual costs, and build solid recovery plans. Oh and document this stuff as it happens - I learned that the hard way trying to piece together months of chaos later. Trust me on that one.
Dude, time impact analysis is a lifesaver when everything goes sideways. It shows you exactly how delays mess with your whole schedule - like watching dominoes fall but in project form. You'll see which tasks become bottlenecks and spot new critical paths popping up. Plus it reveals where your buffer time disappears (spoiler: everywhere). I learned this the hard way on my last project. The analysis helps you figure out what delays to stress about most and where to move people around. Honestly, run this before you freak out about missing deadlines.
So there are three main methods you'll run into. As-Planned vs. As-Built is pretty straightforward - just compare your original timeline to what actually went down. Then there's Impacted As-Planned, where you drop delay events into your baseline schedule to see what happens (but heads up, this one gets subjective real quick). Windows Analysis breaks everything into chunks and looks at delays in each period. Courts usually prefer the Windows approach since it's way more objective - honestly, I'd start there if you think disputes might come up later. Way less headache in the long run.
Basically, time impact analysis lets you model "what if" scenarios before stuff hits the fan. Like what happens if your vendor is late or half your team gets reassigned? Super helpful for those stressful stakeholder meetings - you'll have actual data instead of just guessing which delays will screw your delivery date. Honestly saved my butt more times than I can count. The key is running these scenarios early so you can build in realistic buffers and have backup plans ready. Way better than scrambling when things inevitably go sideways.
You absolutely need stakeholders for your TIA - they're like your backup when things get messy. They confirm the delays actually went down and help validate your schedule logic. Without them, someone's gonna tear your analysis apart later. Plus they know the project inside and out, so they can tell you which delays really mattered for the critical path. Honestly, getting them in meetings is always a pain, but it's worth it. Just document everything they tell you and try to get sign-offs. Their support makes your whole case way stronger when push comes to shove.
Dude, outdated project data will totally mess up your time impact analysis. You're basically modeling delays against a baseline that doesn't match what's actually happening. The critical path probably shifted, resources got moved around, and completed work isn't tracked right. Short answer: your float calculations will be wrong and the delay impacts will be garbage. It's honestly like using last year's GPS data - technically you'll get somewhere but good luck with that. I learned this the hard way on my last project. Always update your schedule first or you're just wasting time.
For critical path stuff, Primavera P6 is what the big construction companies swear by - super powerful but expensive and kinda painful to learn. MS Project's probably your best bet if you need something more reasonable. I've actually seen people pull off decent analyses just using Excel with Gantt charts, though you're doing everything manually. Oracle Primavera Cloud and Smartsheet are solid if you want something in between. Real talk though - whatever your team already knows how to use is gonna work better than some fancy tool nobody touches.
So time impact analysis is basically your project's crystal ball - shows exactly how delays mess with your whole timeline. Way better than just throwing random buffer time at problems and hoping for the best. You can model different scenarios (best case, worst case, the realistic one) which honestly makes your predictions way more solid. Stakeholders actually listen when you have real data backing up why things are delayed. Pro tip though - use it early when you see trouble coming, not after you're already screwed. Makes explaining the "why" so much easier.
Honestly, data quality will bite you every time - don't use crappy outdated schedules as your starting point. Scope creep is brutal too. Stakeholders love adding "just one more delay type" halfway through and suddenly you're analyzing everything under the sun. Write down your approach first thing, trust me on this. Someone's gonna question your methods later and you'll want that documentation. Oh, and be realistic about those logic ties - not every task depends on everything else, even though it feels that way sometimes. Most people mess up by assuming connections that aren't actually there.
So basically, direct impacts are the obvious delays - like when your equipment breaks and you're stuck for 3 days. Pretty straightforward. Indirect impacts are trickier though - they're all the downstream mess that happens because of that original problem. I always think of it like knocking over dominoes. First one falls (direct), then everything else starts tumbling after (indirect). Map them out differently since you'll handle them differently too. Direct stuff needs quick fixes, but indirect issues usually mean juggling your whole schedule around. Start with whatever caused the first delay, then follow the chaos through your timeline. Trust me, it gets messy fast if you don't track both.
Run a TIA whenever you hit major scope changes, unexpected delays, or when disputes are starting to bubble up. Weather delays and change orders are big ones too - basically anything that messes with your timeline. I've watched way too many PMs skip this and then scramble later when clients get angry about delays. Also use it when you're weighing different sequencing options or working on recovery schedules. Oh, and if you're thinking about trying some new approach, document that impact first. Anytime you need to show that X caused Y on your schedule, get that TIA done before things get messy.
Okay so time impact analysis basically shows you exactly when delays will screw up your timeline. Like instead of just panicking that you're behind, you'll know "Task B gets pushed 3 days starting Tuesday." That's actually useful info. Then you can move people around before everything falls apart - grab someone from a task that's just waiting on approvals and throw them at the real bottleneck. Honestly it's a lifesaver. Run it whenever you see trouble brewing, then figure out where to shift resources. Way better than just crossing your fingers and hoping.
Qualitative TIA is your gut check approach - you're looking at delays through expert judgment and just describing what happened. Quantitative gets into the actual numbers and math models. Like, qualitative might be "this weather delay obviously pushed us back 3 weeks" while quantitative breaks it down to exactly 22.5 days with data to prove it. Honestly, I've seen people get way too hung up on one or the other. Quick internal stuff? Go qualitative. But if you're dealing with contract disputes or need to cover your ass, you'll want those hard numbers backing you up.
So TIA is basically your safety net when people want to change stuff mid-project. You plug their requests into your schedule and see exactly how it messes with your timeline - no more guessing games. Honestly, it's saved me from so many heated meetings because you've got actual numbers to back up why something will delay everything. Run the analysis for every change request (I learned this the hard way). Then you can actually decide what's worth approving and explain to clients why their "quick addition" will push deadlines. It's like having project ammunition, if that makes sense.
Start with solid baseline documentation - that's your foundation. When modeling the impact, use the exact same logic, calendars, and resource constraints as your original schedule. Document everything meticulously, especially your assumptions about how the delay actually played out versus what you're modeling. Honestly, garbage in garbage out is huge here. Run sensitivity analyses to test different scenarios. Always validate your results against what actually happened on site. Keep your analysis simple enough that non-schedulers can follow your logic - I've seen way too many great analyses get tossed because nobody could understand them.
-
Commendable slides with attractive designs. Extremely pleased with the fact that they are easy to modify. Great work!
-
The Designed Graphic are very professional and classic.