

Quality Assurance Plan And Procedures Set 3 Powerpoint Presentation Slides


Try Before you Buy Download Free Sample Product
 Impress Your
 Audience
Editable
of Time


Quality assurance plan is critical in establishing a successful business that delivers quality products to meet or exceed customer expectations. Organizations invest heavily in training their valuable employees to maintain product quality and increase brand value. Grab our efficiently designed Quality Assurance Plan and Procedures Set 3 template that will benefit the organization that wants to enhance its product quality, brand reputation, and customer satisfaction by using various quality control tools and techniques. Powerful tools and techniques covered in this presentation are affinity diagram, box and whisker plot, cost of quality, customer experience, data collection and analysis tools, decision matrix, Deming cycle, failure mode effect analysis fishbone diagram, ISO 9001, Kano model, QMS, root cause analysis, six sigma tools, TQM and many more. Customize this 100 percent editable template now.
People who downloaded this PowerPoint presentation also viewed the following :
Content of this Powerpoint Presentation
Slide 1: This slide displays title i.e. 'Quality Assurance Plan and Procedures Set 3' and your Company Name.
Slide 2: This slide presents agenda.
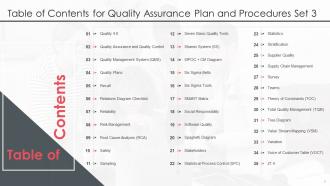
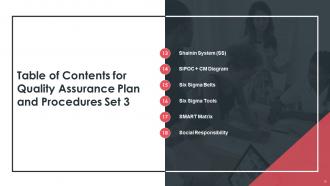
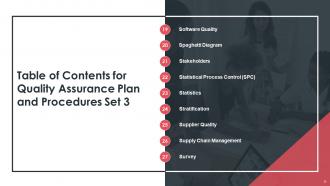
Slide 3: This slide exhibits table of contents.
Slide 4: This slide depicts title for four topics that are to be covered next in the template.
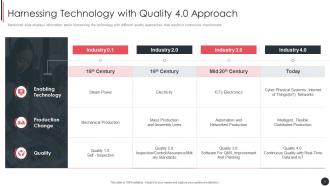
Slide 5: This slide displays information about harnessing the technology with different quality approaches that results in continuous improvement.
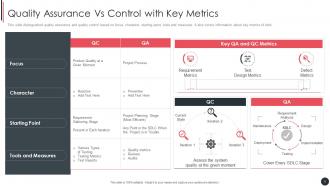
Slide 6: This slide distinguished quality assurance and quality control based on focus, character, starting point, tools and measures.
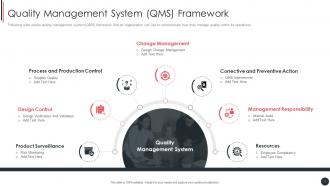
Slide 7: This slide shows quality management system (QMS) framework that an organization can use to communicate how they manage quality within its operations.
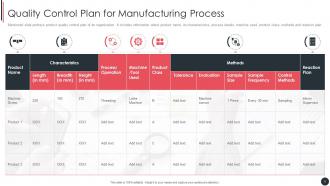
Slide 8: This slide portrays product quality control plan of an organization.
Slide 9: This slide depicts title for five topics that are to be covered next in the template.
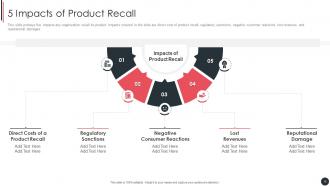
Slide 10: This slide portrays five impacts any organization recall its product.
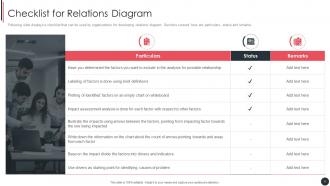
Slide 11: This slide displays a checklist that can be used by organizations for developing relations diagram.
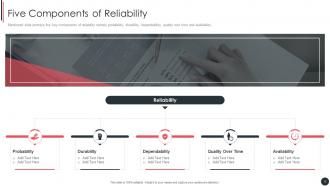
Slide 12: This slide portrays five key components of reliability namely probability, durability, dependability, quality over time and availability.
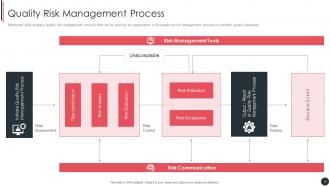
Slide 13: This slide displays quality risk management process that can be used by an organization to illustrates its risk management process.
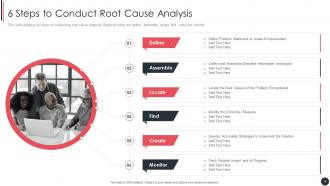
Slide 14: This slide displays six steps of conducting root cause analysis. Steps included are define, assemble, locate, find, crate and monitor.
Slide 15: This slide depicts title for three topics that are to be covered next in the template.
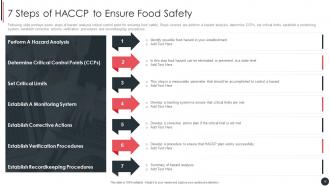
Slide 16: This slide portrays seven steps of hazard analysis critical control point for ensuring food safety.
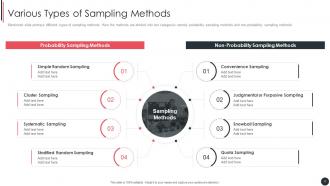
Slide 17: This slide portrays different types of sampling methods.
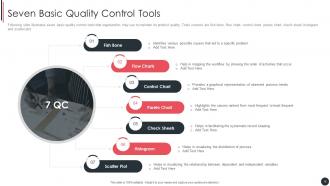
Slide 18: This slide illustrates seven basic quality control tools that organization may use to maintain its product quality.
Slide 19: This slide depicts title for six topics that are to be covered next in the template.
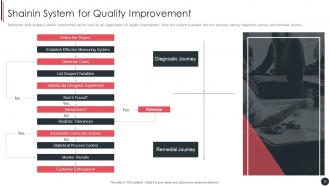
Slide 20: This slide displays shainin system that can be used by an organization for quality improvement.
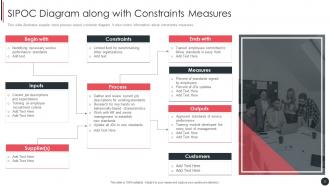
Slide 21: This slide illustrates supplier input process output customer diagram.
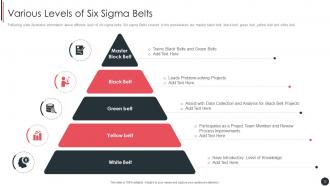
Slide 22: This slide illustrates information about different level of six sigma belts.
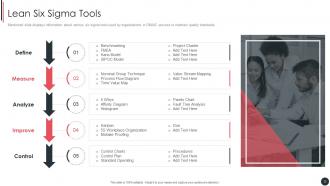
Slide 23: This slide displays information about various six sigma tools used by organizations in DMAIC process to maintain quality standards.
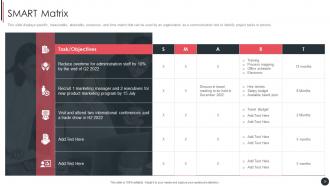
Slide 24: This slide displays specific, measurable, attainable, resources, and time matrix that can be used by an organization.
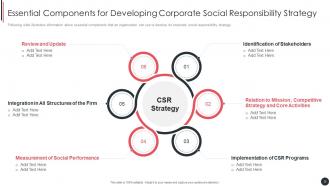
Slide 25: This slide illustrates information about essential components that an organization can use to develop its corporate social responsibility strategy.
Slide 26: This slide depicts title for nine topics that are to be covered next in the template.
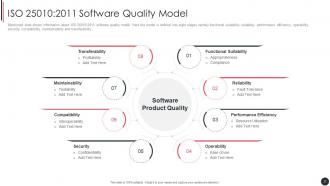
Slide 27: This slide shows information about ISO 25010:2011 software quality model.
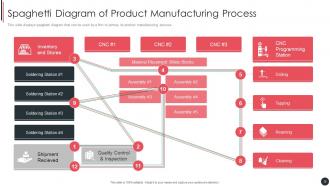
Slide 28: This slide displays spaghetti diagram that can be used by a firm to portray its product manufacturing process.
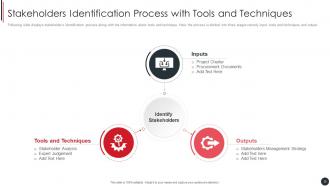
Slide 29: This slide displays stakeholder’s identification process along with the information about tools and technique.
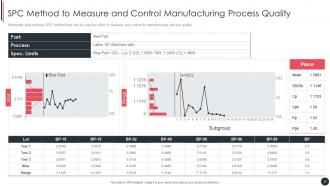
Slide 30: This slide portrays SPC method that can be used by a firm to measure and control its manufacturing process quality.
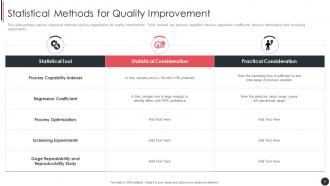
Slide 31: This slide portrays various statistical methods used by organization for quality improvement.
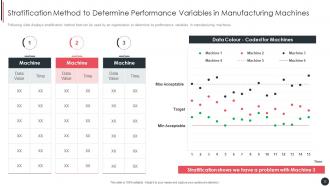
Slide 32: This slide displays stratification method that can be used by an organization to determine its performance variables in manufacturing machines.
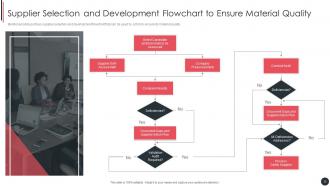
Slide 33: This slide portrays supplier selection and development flowchart that can be used by a firm to ensure its material quality.
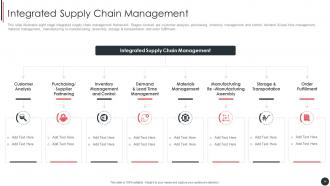
Slide 34: This slide illustrates eight stage integrated supply chain management framework.
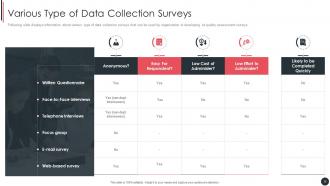
Slide 35: This slide displays information about various type of data collection surveys that can be used by organization in developing its quality assessment surveys.
Slide 36: This slide depicts title for four topics that are to be covered next in the template.
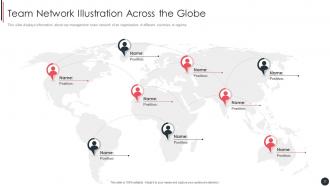
Slide 37: This slide displays information about top management team network of an organization in different countries or regions.
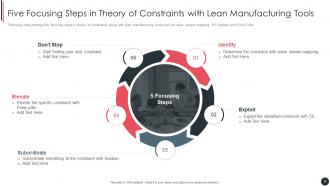
Slide 38: This slide portrays five focusing steps in theory of constraints along with lean manufacturing tools such as value stream mapping, 5S, Kanban and Poka-Yoke.
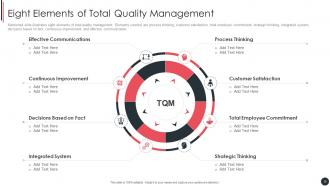
Slide 39: This slide illustrates eight elements of total quality management.
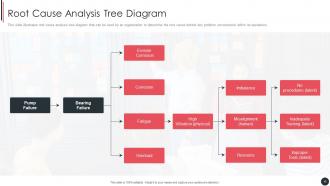
Slide 40: This slide illustrates root cause analysis tree diagram that can be used by an organization to determine the root cause behind any problem.
Slide 41: This slide depicts title for four topics that are to be covered next in the template.
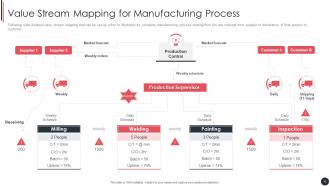
Slide 42: This slide displays value stream mapping that can be use by a firm to illustrates its complete manufacturing process.
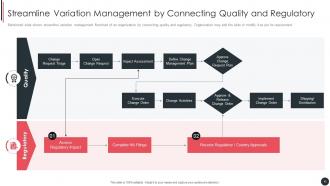
Slide 43: This slide shows streamline variation management flowchart of an organization by connecting quality and regulatory.
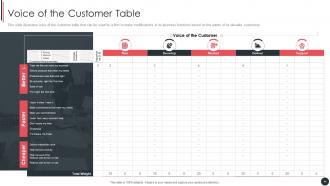
Slide 44: This slide illustrates voice of the customer table that can be used by a firm to make modifications in its business functions.
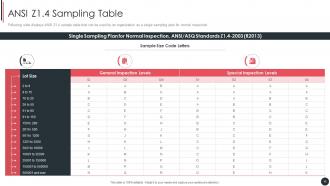
Slide 45: This slide displays ANSI Z1.4 sample table that can be used by an organization as a single sampling plan for normal inspection.
Slide 46: This is the icons slide.
Slide 47: This slide presents title for additional slides.
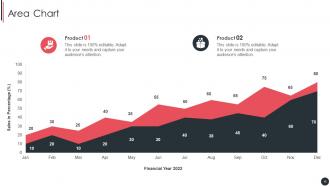
Slide 48: This slide exhibits monthly sales area charts for different products. The charts are linked to Excel.
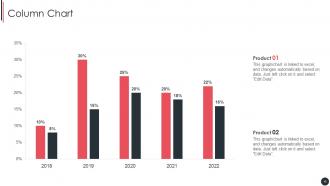
Slide 49: This slide exhibits yearly column charts for different products. The charts are linked to Excel.
Slide 50: This slide depicts 30-60-90 days plan for projects.
Slide 51: This slide presents magnifying glass.
Slide 52: This slide depicts posts for past experiences of clients.
Slide 53: This slide shows puzzle for displaying elements of company.
Slide 54: This slide displays Venn.
Slide 55: This slide presents circular diagram.
Slide 56: This slide shows roadmap of company.
Slide 57: This is thank you slide & contains contact details of company like office address, phone no., etc.
Quality Assurance Plan And Procedures Set 3 Powerpoint Presentation Slides with all 62 slides:
Use our Quality Assurance Plan And Procedures Set 3 Powerpoint Presentation Slides to effectively help you save your valuable time. They are readymade to fit into any presentation structure.


FAQs for Quality Assurance Plan And Procedures Set 3
Quality assurance ensures software meets specified requirements and user expectations through systematic testing, code reviews, and validation processes throughout development phases. QA teams identify defects early, reduce development costs, and enhance user satisfaction by implementing automated testing frameworks, continuous integration practices, and performance monitoring, ultimately delivering reliable software products that maintain competitive advantage.
Automated testing improves quality assurance by accelerating test execution, increasing test coverage, and reducing human error through consistent, repeatable processes. It enables organizations to run comprehensive regression tests continuously, detect defects earlier in development cycles, and allocate QA resources to strategic exploratory testing, ultimately delivering faster releases and higher software reliability.
Key quality assurance metrics include defect density, test coverage percentage, mean time to resolution, customer satisfaction scores, and cost of quality ratios. These measurements enable organizations to streamline testing processes, enhance product reliability, and minimize post-release issues, with many software companies finding that comprehensive QA metrics ultimately deliver faster deployment cycles and improved customer experiences.
Healthcare QA emphasizes regulatory compliance, patient safety protocols, and rigorous documentation standards, while financial services focus on risk management, audit trails, and regulatory reporting requirements. Technology sectors prioritize automated testing, continuous integration practices, and rapid deployment cycles, with many organizations finding that industry-specific frameworks ultimately deliver enhanced operational efficiency and competitive advantage.
Organizations face challenges including resistance to change, resource constraints, inadequate training, inconsistent processes, and difficulty measuring quality metrics effectively. These obstacles often stem from competing priorities and legacy systems, though companies in manufacturing, healthcare, and financial services find that strategic planning, executive support, and phased implementation ultimately deliver improved operational efficiency and competitive advantage.
Teams ensure effective communication between development and quality assurance through regular stand-up meetings, shared documentation platforms, collaborative testing environments, clear defect tracking systems, and integrated communication tools. These practices streamline workflow coordination, enhance transparency between teams, and minimize miscommunication, with many organizations finding that structured communication protocols ultimately deliver faster release cycles, improved product quality, and stronger cross-functional collaboration.
Customer feedback significantly impacts quality assurance by identifying real-world defects, revealing user experience gaps, and highlighting performance issues that internal testing might miss. This feedback enables organizations to refine testing protocols, prioritize critical fixes, and enhance product reliability, with many companies finding that customer-driven insights ultimately deliver faster resolution times and improved customer satisfaction.
DevOps integration enhances quality assurance by enabling continuous testing, automated feedback loops, and seamless collaboration between development and QA teams. Through shared tools and processes, organizations streamline bug detection, accelerate release cycles, and maintain consistent quality standards, with many software companies finding that this strategic combination ultimately delivers faster time-to-market and improved product reliability.
**INPUT**: What are the best practices for creating and maintaining test cases? **OUTPUT**: Best practices for test cases include clear requirements traceability, detailed step-by-step procedures, expected results documentation, regular updates, and version control management. These practices streamline quality assurance by reducing testing inconsistencies, accelerating defect identification, and enhancing team collaboration, with many organizations finding that systematic test case maintenance ultimately delivers faster release cycles and improved software reliability. *[Word count: 58]*
CI/CD benefits quality assurance by automating testing processes, enabling faster feedback loops, and reducing manual errors through consistent deployment pipelines. These practices streamline quality checks by integrating automated tests at every code commit, facilitating early bug detection, and ensuring reliable releases, with many development teams finding that CI/CD ultimately delivers higher software quality and accelerated delivery cycles.
Essential QA tools include automated testing frameworks like Selenium and Cypress, performance testing tools such as JMeter, bug tracking systems like Jira, and continuous integration platforms including Jenkins and GitLab. These technologies streamline testing workflows by accelerating test execution, enhancing defect visibility, and enabling seamless integration across development cycles, with many organizations finding that strategic tool combinations ultimately deliver faster releases and superior product quality.
Quality assurance contributes to risk management by identifying potential issues early, implementing preventive controls, and establishing systematic monitoring processes throughout project lifecycles. Through structured testing, compliance audits, and performance validation, organizations minimize operational disruptions, reduce costly rework, and ensure deliverable reliability, ultimately protecting project timelines, budgets, and stakeholder confidence while maintaining competitive advantage.
User acceptance testing serves as the final validation phase in quality assurance, where end-users verify that software meets business requirements, functions as expected, and delivers the intended user experience before production release. This critical testing phase enables organizations to identify gaps between technical specifications and real-world usage, ultimately reducing post-launch issues and ensuring customer satisfaction across various industries.
Teams develop a quality-centric culture by establishing clear quality standards, implementing regular training programs, creating cross-functional collaboration processes, and integrating quality metrics into performance evaluations. This strategic approach enables organizations to streamline operations, reduce defects, and enhance customer satisfaction, with many companies finding that empowering employees as quality champions ultimately delivers competitive advantage and sustainable growth.
Future trends in quality assurance include AI-powered testing automation, continuous integration practices, cloud-based testing environments, shift-left testing methodologies, and predictive analytics for defect prevention. These technologies streamline testing cycles by reducing manual effort, accelerating release timelines, and enhancing software reliability, with many organizations finding that early testing integration ultimately delivers faster deployment and improved customer experiences.
-
I am really satisfied with their XYZ products. Used their slides for my business presentations and now I am taking their help for my son's high-school assignments. Super satisfied!!
-
Every time I ask for something out-of-the-box from them and they never fail in delivering that. No words for their excellence!