Ratio fixed average corrective maintenance time variable costs kpi presentation slide
Add to the fun with a few jokes in our Ratio Fixed Average Corrective Maintenance Time Variable Costs Kpi Presentation Slide. Indulge in a bit of humour.
You must be logged in to download this presentation.
PowerPoint presentation slides
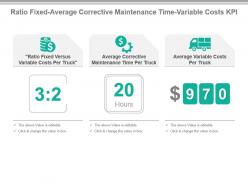
Presenting ratio fixed average corrective maintenance time variable costs kpi presentation slide. This presentation slide shows Three Key Performance Indicators or KPIs in a Dashboard style design. The first KPI that can be shown is Ratio Fixed Versus Variable Costs Per Truck. The second KPI is Average Corrective Maintenance Time Per Truck. The third is Average Variable Costs Per Truck. These KPI Powerpoint graphics are all data driven, and the shape automatically adjusts according to your data. Just right click on the KPI graphic, enter the right value and the shape will adjust automatically. Make a visual impact with our KPI slides.
People who downloaded this PowerPoint presentation also viewed the following :
Ratio fixed average corrective maintenance time variable costs kpi presentation slide with all 6 slides:
Our Ratio Fixed Average Corrective Maintenance Time Variable Costs Kpi Presentation Slide enable enhanced earnings. They help boost your capital.
-
Commendable slides with attractive designs. Extremely pleased with the fact that they are easy to modify. Great work!
-
Nice and innovative design.


