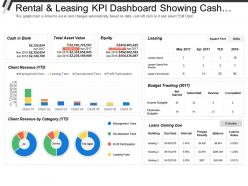
Rental and leasing kpi dashboard showing cash in bank total asset value equity

Rating:
100%
Rental and leasing kpi dashboard showing cash in bank total asset value equity
Slide 1 of 6
Favourites Favourites

Try Before you Buy Download Free Sample Product

Audience Impress Your
Audience
Editable 100%
Editable
Time Save Hours
of Time
The Biggest Sale is ending soon in
0
0
:
0
0
:
0
0
AI-Ready
Upload this template to AI and ask it to make any changes to content or color
100% editable Powerpoint Template for AI-assisted presentations. Finish your work in less time. ​
Works with
Microsoft PowerPoint
Microsoft 365
Claude for PowerPoint
ChatGPT
Google Slides
Microsoft Copilot
Rating:
100%
Presenting this set of slides with name - Rental And Leasing Kpi Dashboard Showing Cash In Bank Total Asset Value Equity. This is a three stage process. The stages in this process are Rental And Leasing, Dealing And Leasing, Rental And Engage.

FAQs for Rental and leasing kpi dashboard showing cash in bank total

Essential KPIs for rental and leasing businesses include occupancy rates, revenue per unit, customer acquisition costs, lease renewal rates, and average collection periods. These metrics streamline operational oversight by tracking profitability, tenant satisfaction, and cash flow efficiency, with many property management companies finding that comprehensive dashboard monitoring ultimately delivers enhanced portfolio performance and competitive market positioning.

A KPI dashboard improves rental and leasing decision-making by providing real-time visibility into occupancy rates, revenue per unit, tenant retention metrics, and maintenance costs in one centralized view. This enables property managers and leasing companies to quickly identify underperforming assets, optimize pricing strategies, and streamline operations, ultimately delivering faster responses to market changes and enhanced profitability.

Rental occupancy rate calculations should include total available rental units, currently occupied units, vacancy periods, lease renewal rates, and seasonal occupancy fluctuations. These metrics enable property managers to accurately assess portfolio performance by tracking utilization trends, identifying revenue optimization opportunities, and benchmarking against industry standards, ultimately delivering enhanced investment returns and strategic decision-making capabilities.

Lease renewal rates can be effectively monitored through KPI dashboards by tracking renewal percentages, tenant satisfaction scores, lease expiration timelines, and comparative market rates. These dashboards enable property managers to identify at-risk tenants early, benchmark performance across portfolios, and implement targeted retention strategies, with many real estate companies finding that proactive monitoring increases renewal rates by 15-25% while reducing vacancy costs.

Customer satisfaction serves as a cornerstone KPI in rental and leasing, directly influencing renewal rates, referral generation, maintenance cost reduction, and overall profitability metrics. Through satisfaction tracking, rental companies enhance tenant retention, streamline property management operations, and minimize vacancy periods, with many property management firms finding that satisfied customers reduce operational costs while delivering sustained revenue growth and competitive market positioning.

Operational efficiency in leasing companies can be measured through lease processing times, asset utilization rates, maintenance cost ratios, customer acquisition costs, and revenue per asset metrics. These KPIs enable organizations to streamline operations by identifying bottlenecks, optimizing fleet management, and reducing overhead expenses, with many leasing firms finding that integrated dashboards deliver faster decision-making and improved profitability.

**INPUT**: What is the significance of tracking average time to lease a property or asset? **OUTPUT**: Tracking average time to lease reveals operational efficiency, market positioning, and revenue optimization opportunities, helping property managers identify bottlenecks in marketing, pricing, and approval processes. This metric enables real estate firms, equipment leasing companies, and asset managers to streamline tenant acquisition, reduce vacancy costs, and enhance competitive advantage through faster turnaround times.

A KPI dashboard tracks rental price trends through automated data visualization, historical comparisons, seasonal pattern analysis, and market segment breakdowns, enabling real-time monitoring of pricing fluctuations across different property types and locations. These analytical capabilities help property managers and leasing companies identify emerging market opportunities, adjust pricing strategies proactively, and ultimately maximize revenue while staying competitive in dynamic rental markets.

Best practices for visualizing rental and leasing KPIs include using clear metric hierarchies, interactive filters, real-time data feeds, color-coded performance indicators, and trend analysis charts that highlight occupancy rates, revenue per unit, and lease renewal percentages. These visualization techniques streamline property management by enabling quick identification of underperforming assets, optimizing pricing strategies, and enhancing tenant retention decisions, with many real estate companies finding that well-designed dashboards ultimately deliver faster decision-making and improved portfolio performance.

Maintenance response times can be incorporated as a KPI by tracking average response hours, resolution rates, and tenant satisfaction scores through automated work order systems and real-time monitoring dashboards. Property managers can segment metrics by urgency levels, maintenance categories, and property types, while benchmarking against industry standards to optimize operational efficiency and enhance tenant retention rates.

Recommended tools include Tableau, Power BI, Google Data Studio, Qlik Sense, and Looker, each offering robust visualization capabilities and real-time data integration. These platforms streamline property management operations by connecting rental systems, financial databases, and tenant information, with many real estate companies finding that automated dashboards enhance decision-making and operational efficiency.

Effective KPI tracking revolutionizes rental property management by monitoring occupancy rates, maintenance costs, tenant satisfaction scores, and revenue per unit, enabling data-driven decisions that optimize operations. Through comprehensive dashboards, property managers streamline maintenance scheduling, reduce vacancy periods, and enhance tenant retention while minimizing operational expenses, ultimately delivering improved profitability and competitive advantage in increasingly demanding rental markets.

Economic factors significantly influence rental and leasing KPIs through interest rate fluctuations, inflation pressures, employment levels, and consumer spending patterns, directly affecting occupancy rates, pricing strategies, and collection efficiency. During economic downturns, companies typically experience increased vacancy rates and extended lease negotiations, while economic growth periods enable higher rental yields and faster tenant acquisition, with many property management firms finding that proactive economic monitoring enhances portfolio performance and strategic decision-making.

Tenant turnover costs can be quantified by tracking vacancy periods, marketing expenses, unit preparation costs, administrative fees, and lost rental income during transitions. These metrics are displayed through visual indicators showing cost per vacancy, average turnover duration, and cumulative monthly impact, with many property management companies finding that real-time dashboards enable faster decision-making, optimize leasing strategies, and ultimately reduce operational expenses while improving tenant retention rates.

Rental and leasing KPIs should be reviewed monthly for operational metrics like occupancy rates and collection efficiency, with quarterly assessments for strategic indicators such as customer acquisition costs and portfolio performance. This balanced approach enables property managers and leasing companies to quickly address immediate concerns while maintaining long-term strategic focus, ultimately delivering improved tenant satisfaction and maximized revenue streams.

Ratings and Reviews

100% of 100
Review Form
Write a review
Most Relevant Reviews
  1. 100%

    by Donte Duncan

    Excellent work done on template design and graphics.
  2. 100%

    by Brown Baker

    Great designs, really helpful.

2 Item(s)

per page: