Sales Initiatives Report Assessment To Improve Salesperson Performance Complete Deck
Our Sales Initiatives Report Assessment To Improve Salesperson Performance Complete Deck are topically designed to provide an attractive backdrop to any subject. Use them to look like a presentation pro.
Our Sales Initiatives Report Assessment To Improve Salesperson Performance Complete Deck are topically designed to provide ..
- Google Slides is a new FREE Presentation software from Google.
- All our content is 100% compatible with Google Slides.
- Just download our designs, and upload them to Google Slides and they will work automatically.
- Amaze your audience with SlideTeam and Google Slides.
-
Want Changes to This PPT Slide? Check out our Presentation Design Services
- WideScreen Aspect ratio is becoming a very popular format. When you download this product, the downloaded ZIP will contain this product in both standard and widescreen format.
-

- Some older products that we have may only be in standard format, but they can easily be converted to widescreen.
- To do this, please open the SlideTeam product in Powerpoint, and go to
- Design ( On the top bar) -> Page Setup -> and select "On-screen Show (16:9)” in the drop down for "Slides Sized for".
- The slide or theme will change to widescreen, and all graphics will adjust automatically. You can similarly convert our content to any other desired screen aspect ratio.
Compatible With Google Slides

Get This In WideScreen
You must be logged in to download this presentation.
PowerPoint presentation slides
This complete deck can be used to present to your team. It has PPT slides on various topics highlighting all the core areas of your business needs. This complete deck focuses on Sales Initiatives Report Assessment To Improve Salesperson Performance Complete Deck and has professionally designed templates with suitable visuals and appropriate content. This deck consists of total of fifty eight slides. All the slides are completely customizable for your convenience. You can change the colour, text and font size of these templates. You can add or delete the content if needed. Get access to this professionally designed complete presentation by clicking the download button below.
People who downloaded this PowerPoint presentation also viewed the following :
Content of this Powerpoint Presentation
Slide 1: This slide introduces Sales Initiatives Report Assessment to Improve Salesperson Performance.
Slide 2: This slide displays Agenda.
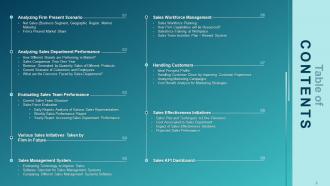
Slide 3: This slide displays Table of Contents of the presentation.
Slide 4: This slide displays Table of Contents.
Slide 5: This slide presents Net Sales (Business Segment, Geographic Region, Market Maturity) The purpose of this slide is to provide relevant information regarding the net sales generated by different business segment, net sales generated in different geographic locations and by the market maturity.
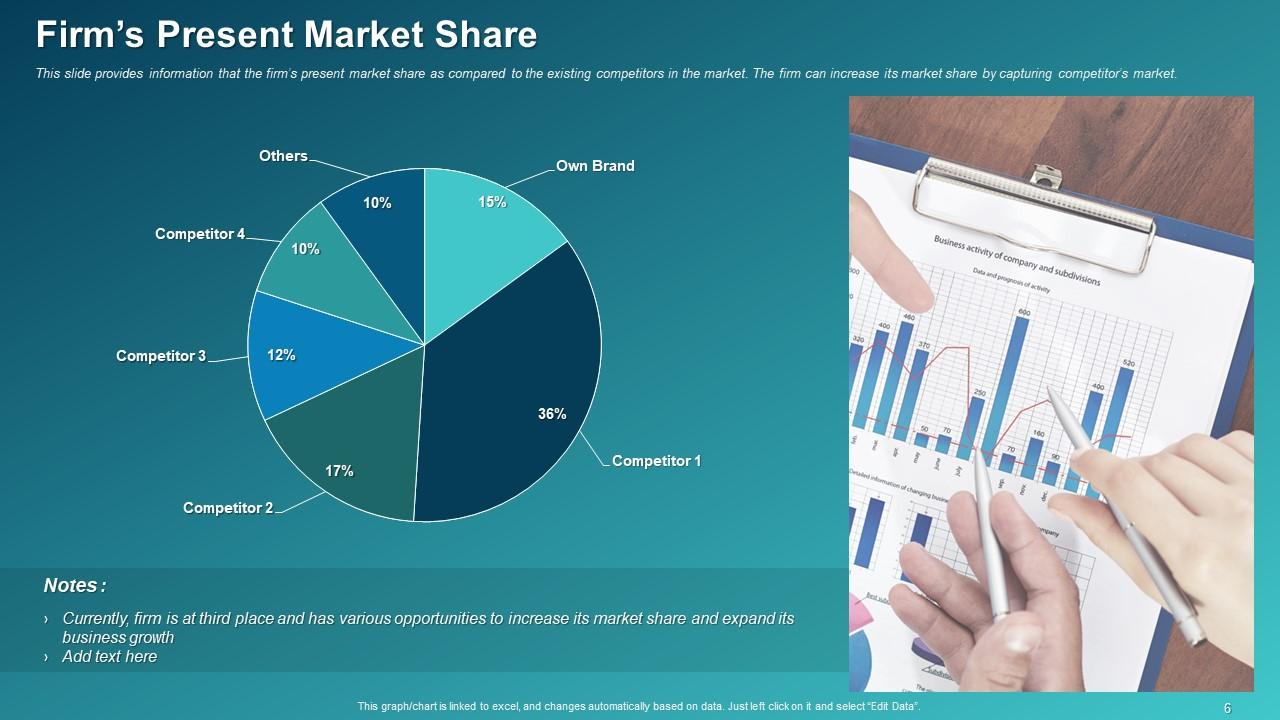
Slide 6: This slide provides information that the firm’s present market share as compared to the existing competitors in the market. The firm can increase its market share by capturing competitor’s market.
Slide 7: This slide displays Table of Contents of the presentation.
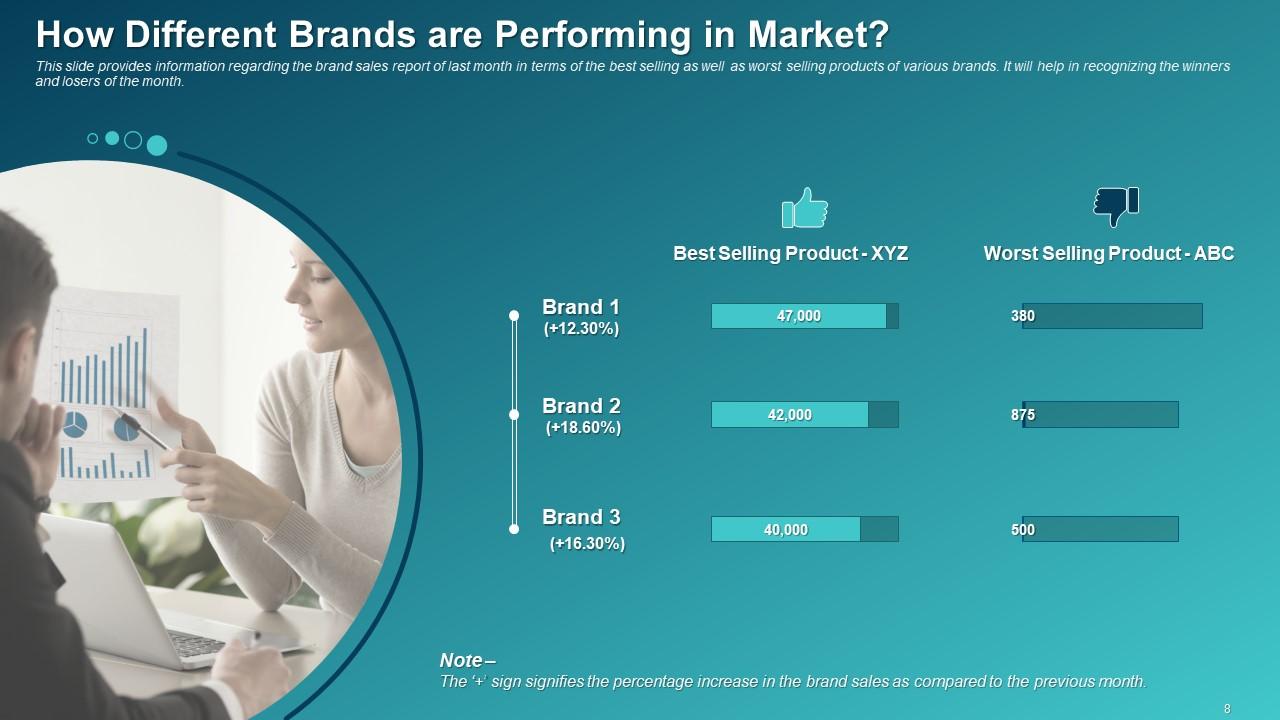
Slide 8: This slide provides information regarding the brand sales report of last month in terms of the best selling as well as worst selling products of various brands. It will help in recognizing the winners and losers of the month.
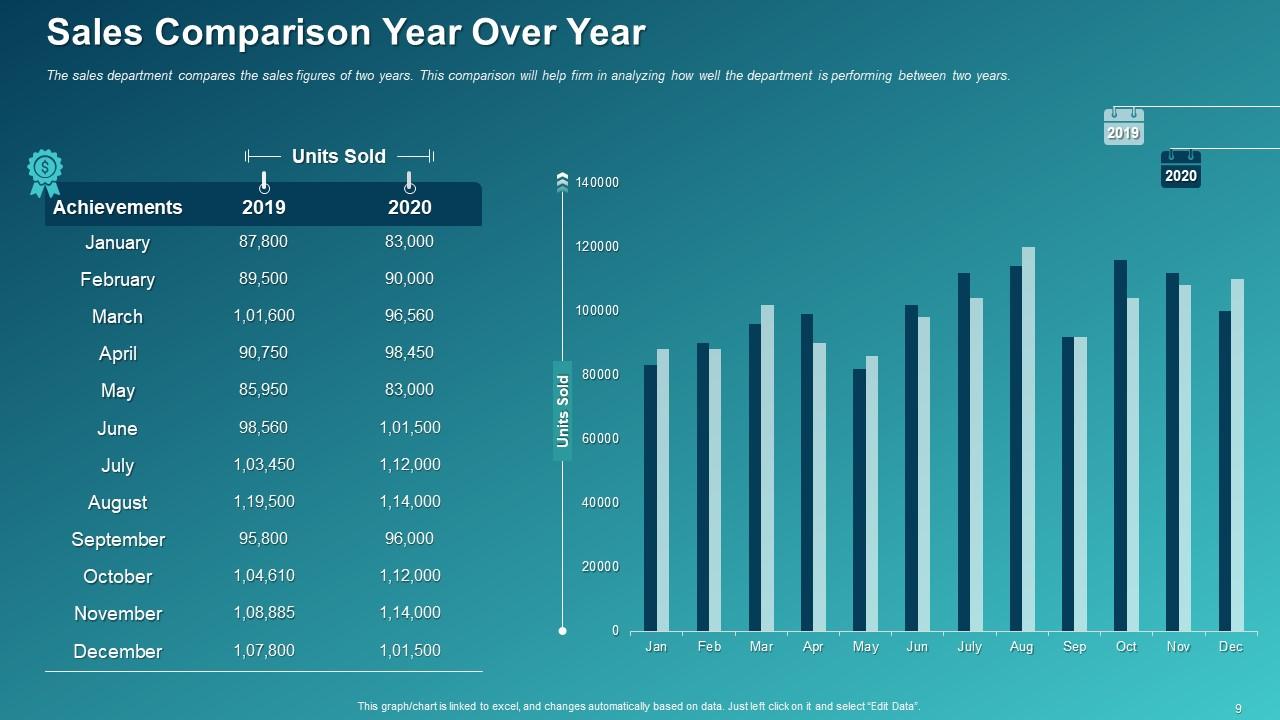
Slide 9: This slide shows Sales Comparison Year Over Year.
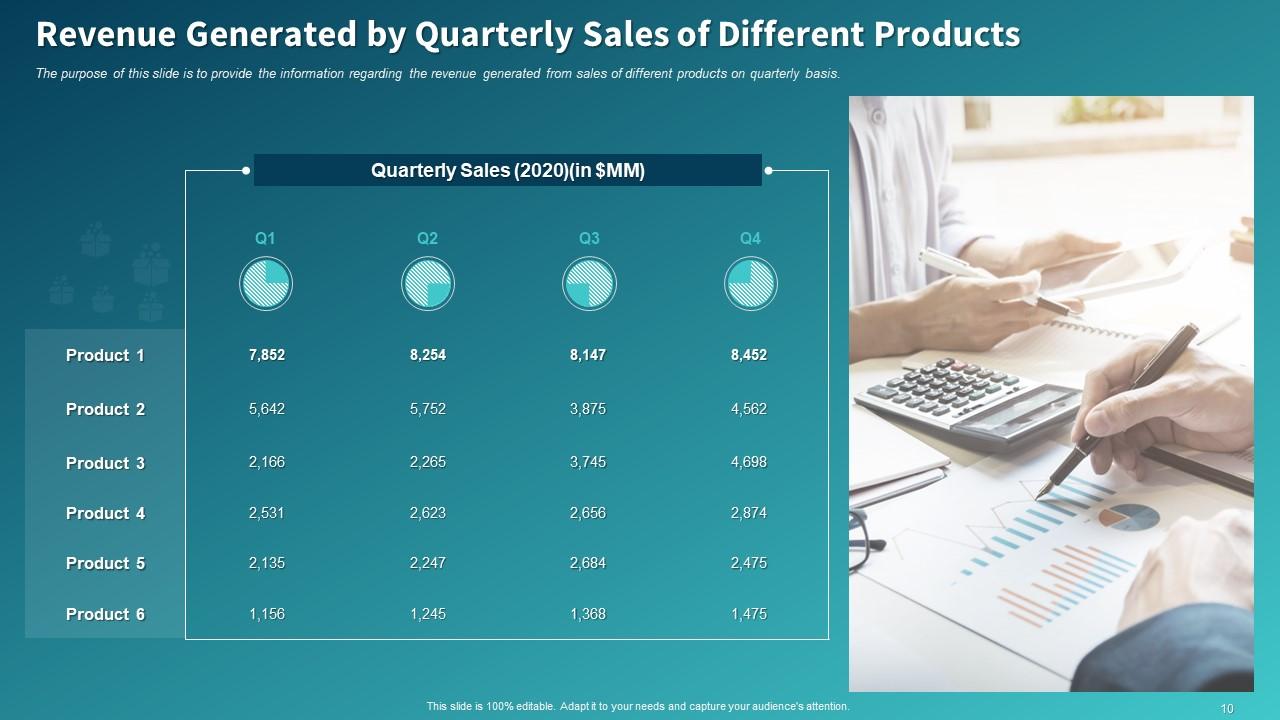
Slide 10: The purpose of this slide is to provide the information regarding the revenue generated from sales of different products on quarterly basis.
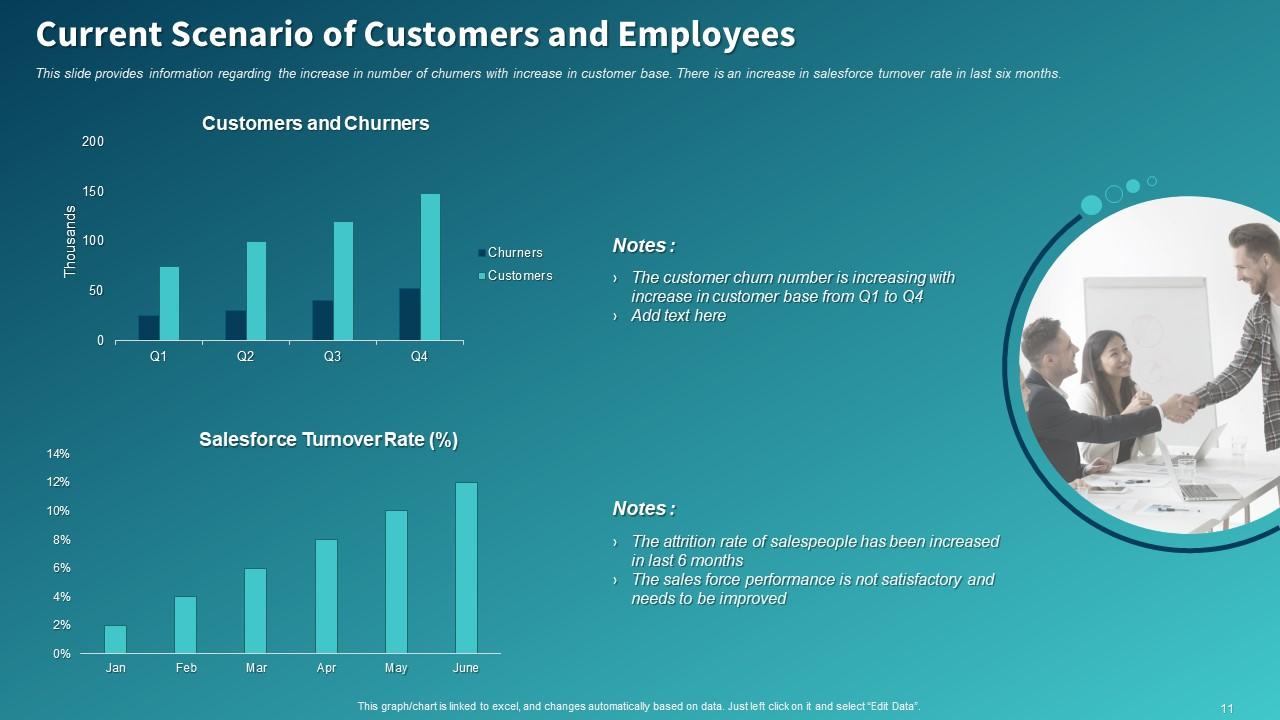
Slide 11: This slide provides information regarding the increase in number of churners with increase in customer base. There is an increase in salesforce turnover rate in last six months.
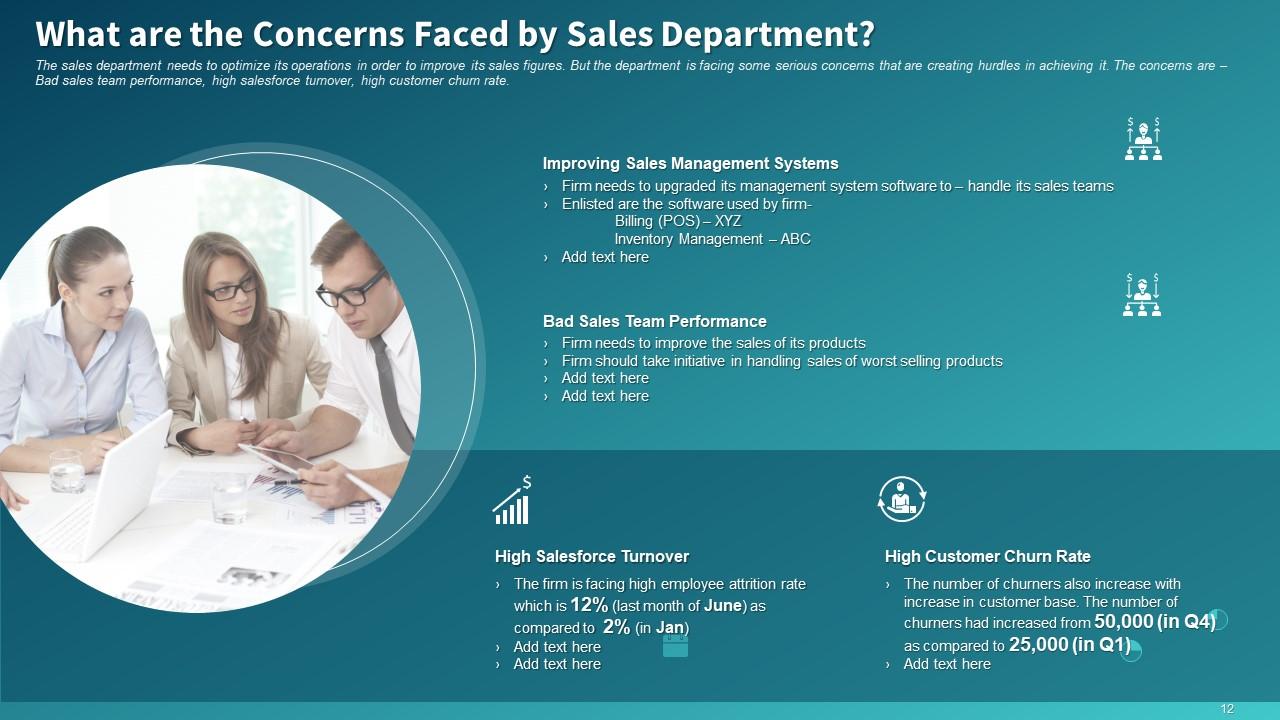
Slide 12: This slide displays the Concerns Faced by Sales Department.
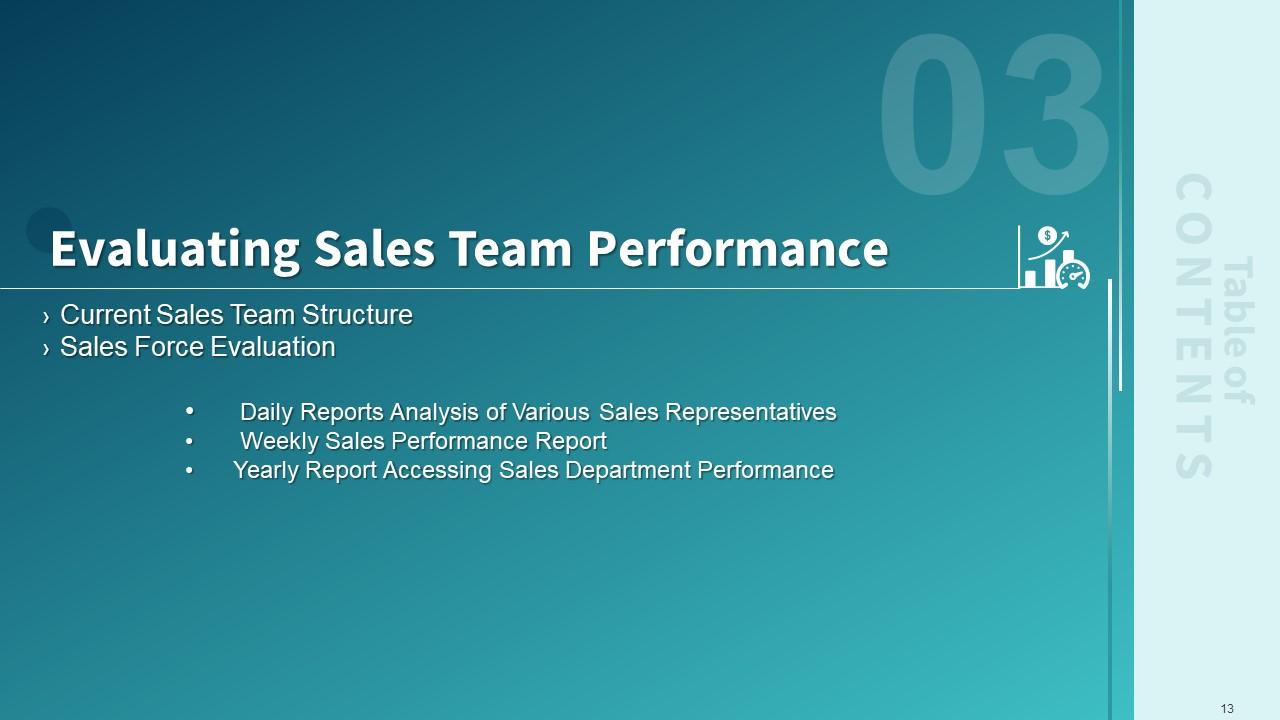
Slide 13: This slide depicts Table Of Contents.
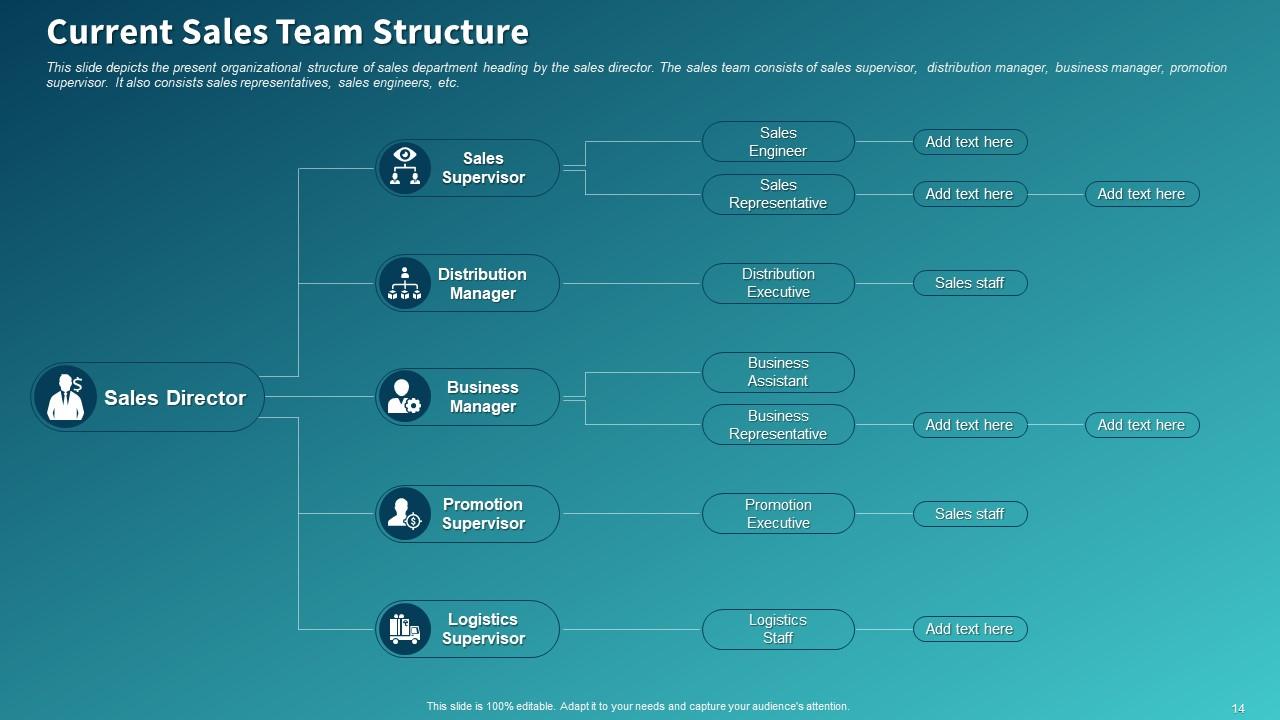
Slide 14: This slide depicts the present organizational structure of sales department heading by the sales director. The sales team consists of sales supervisor, distribution manager, business manager, promotion supervisor. It also consists sales representatives, sales engineers, etc.
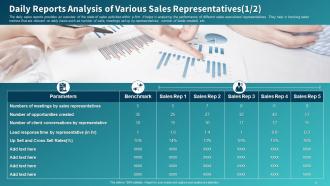
Slide 15: This slide shows Daily Reports Analysis of Various Sales Representatives.
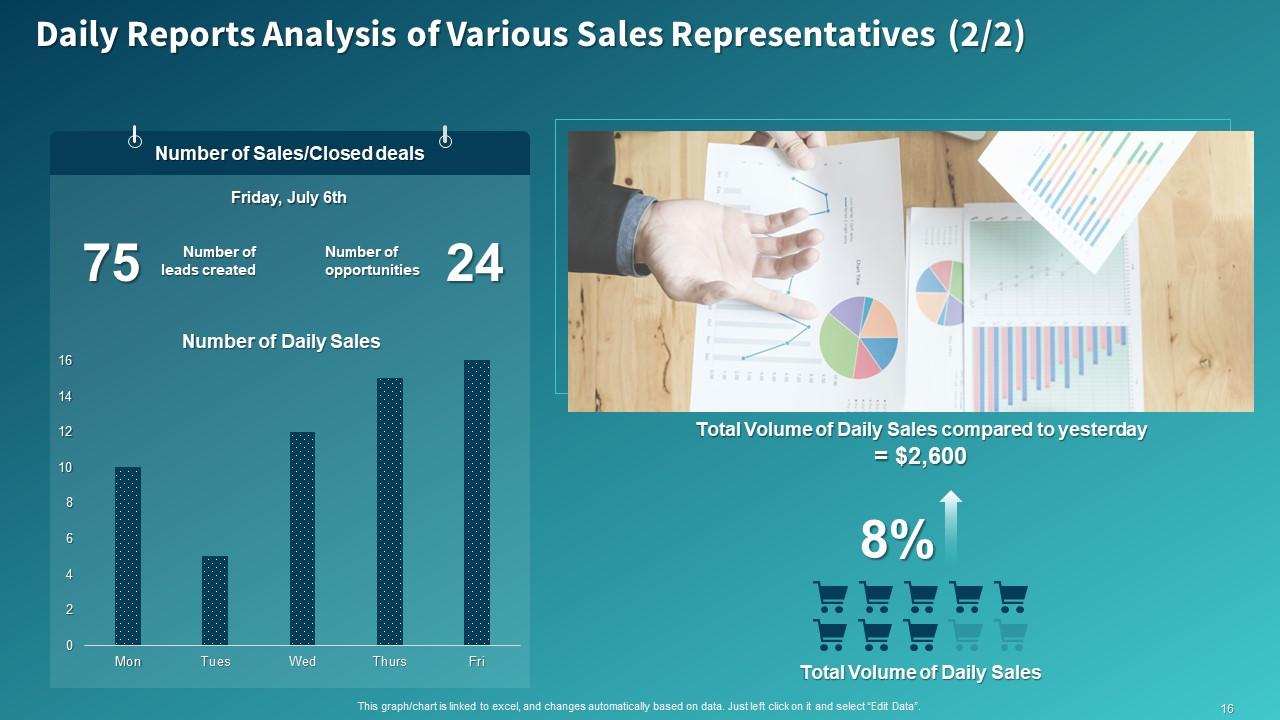
Slide 16: This slide depicts Daily Reports Analysis of Various Sales Representatives.
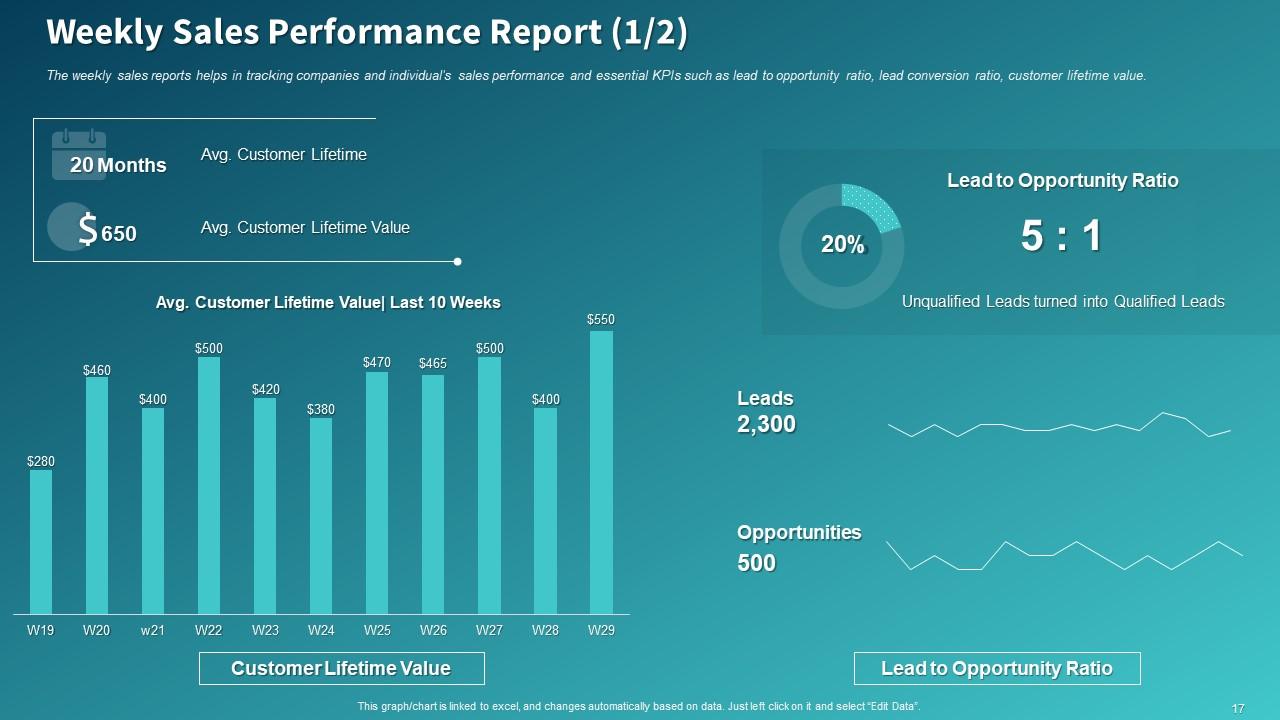
Slide 17: This slide shows Weekly Sales Performance Report.
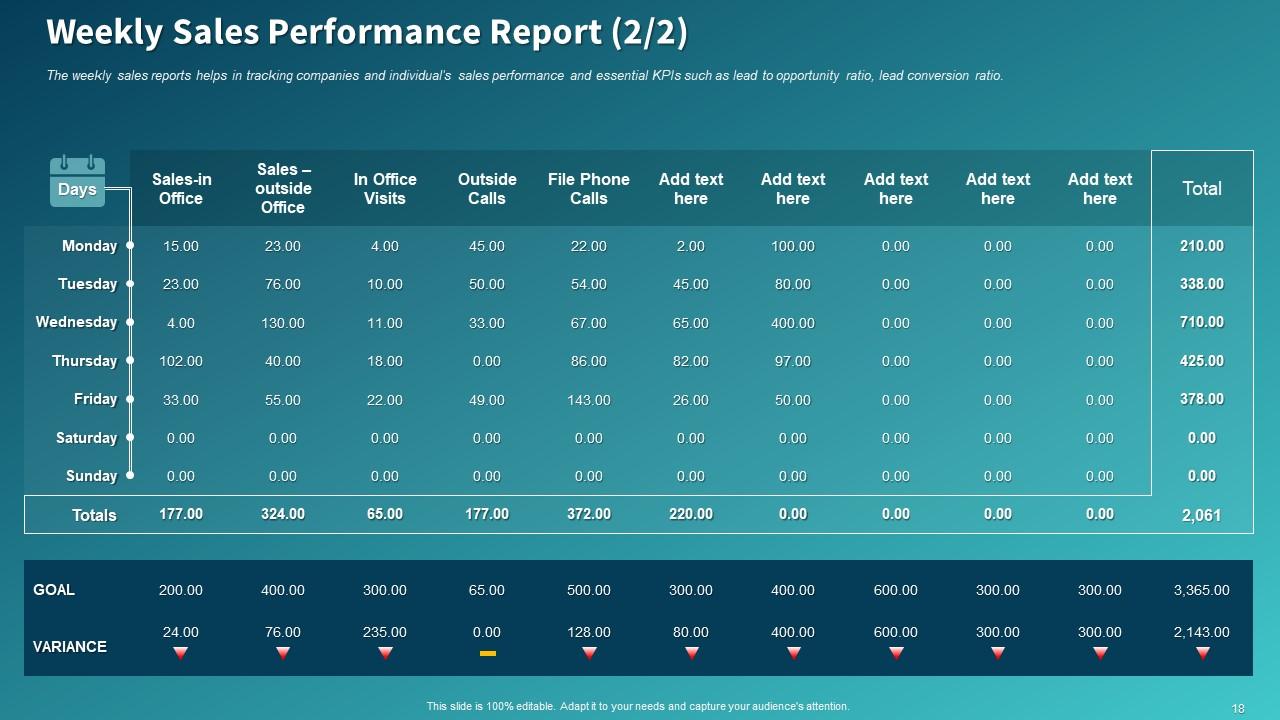
Slide 18: This slide shows Weekly Sales Performance Report.
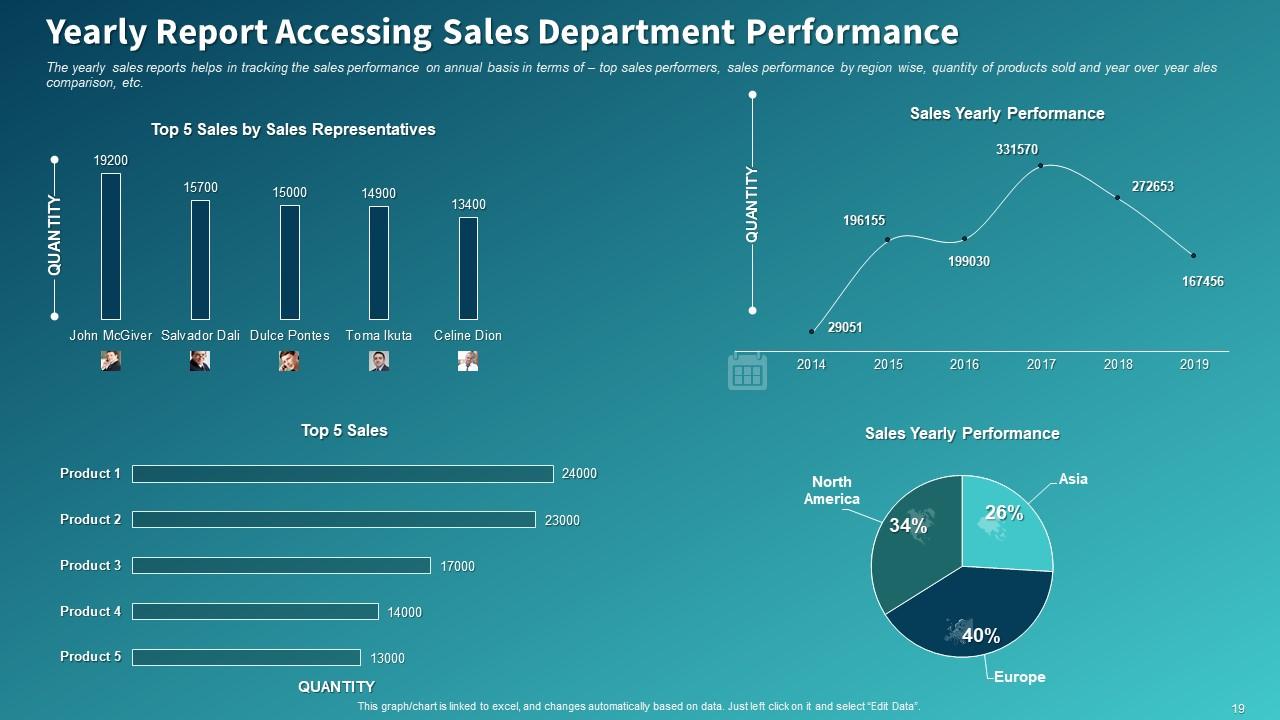
Slide 19: This slide shows Yearly Report Accessing Sales Department Performance.
Slide 20: This slide displays Table of Contents.
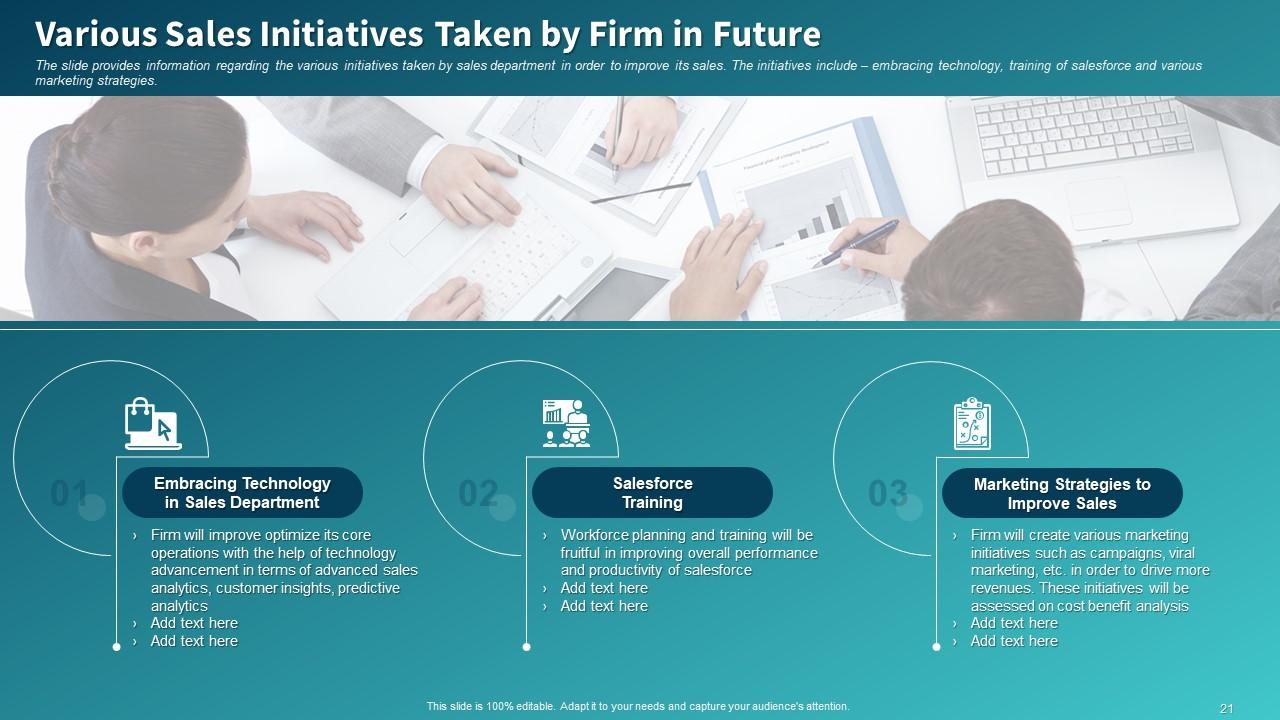
Slide 21: This slide displays Various Sales Initiatives Taken by Firm in Future.
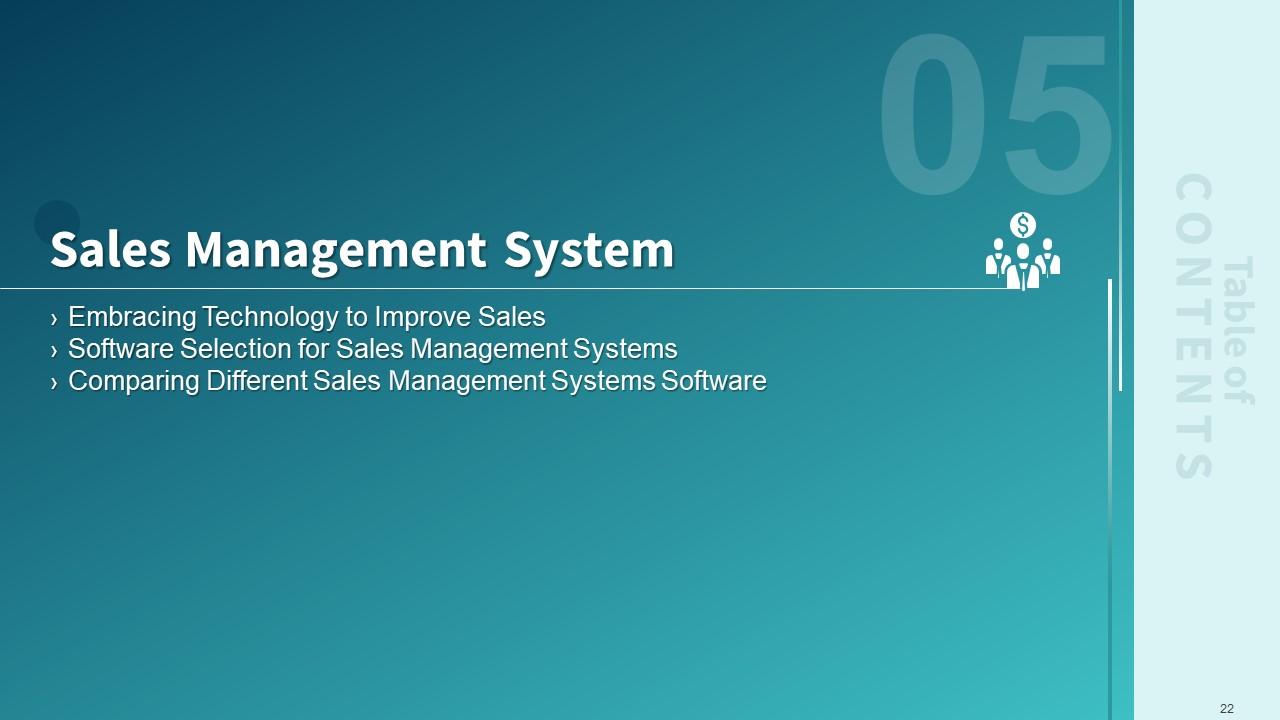
Slide 22: This slide displays Table of Contents.
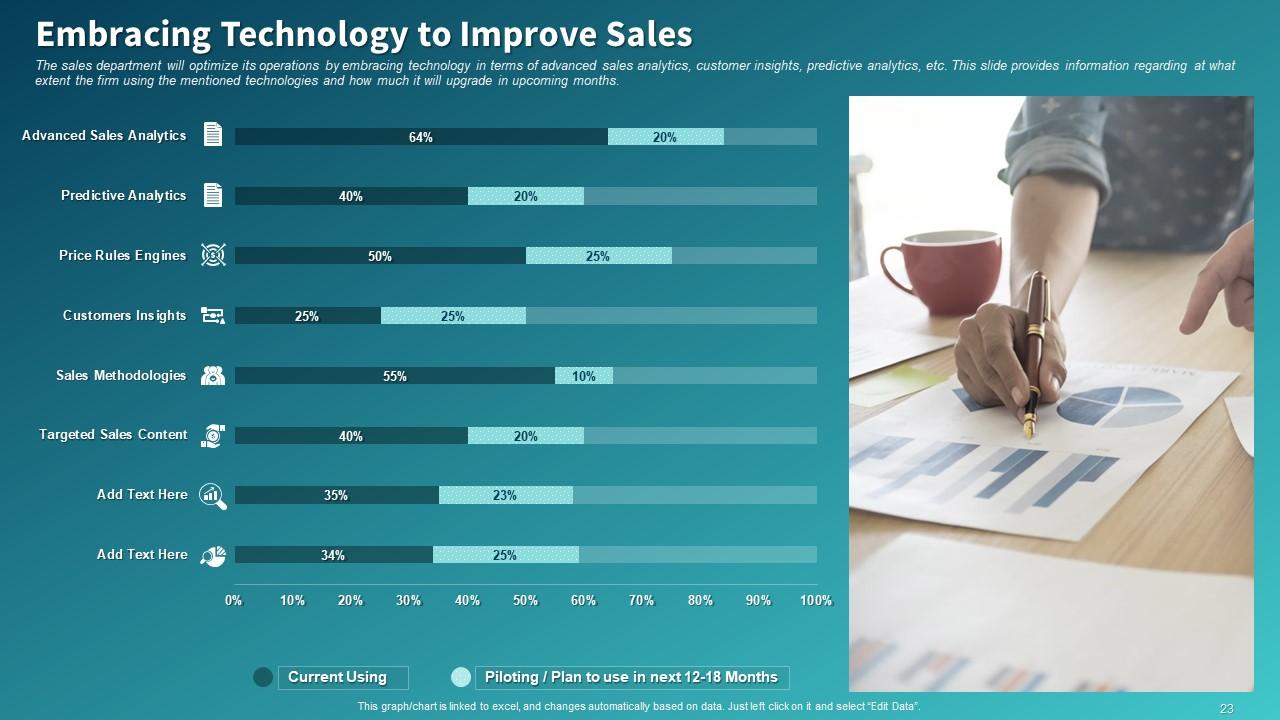
Slide 23: This slide shows Embracing Technology to Improve Sales
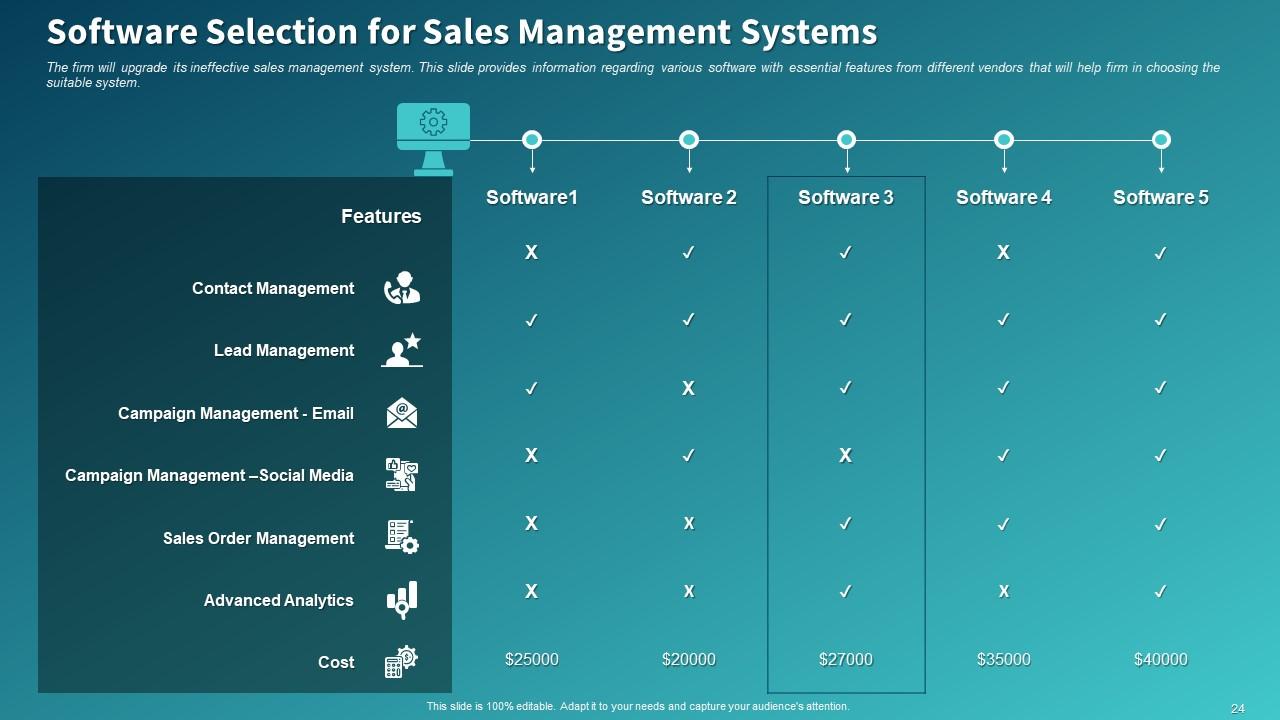
Slide 24: This slide depicts Software Selection for Sales Management Systems
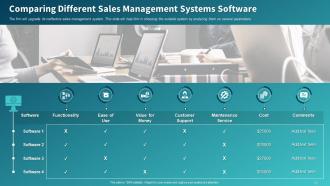
Slide 25: This slide asks about Comparing Different Sales Management Systems Software
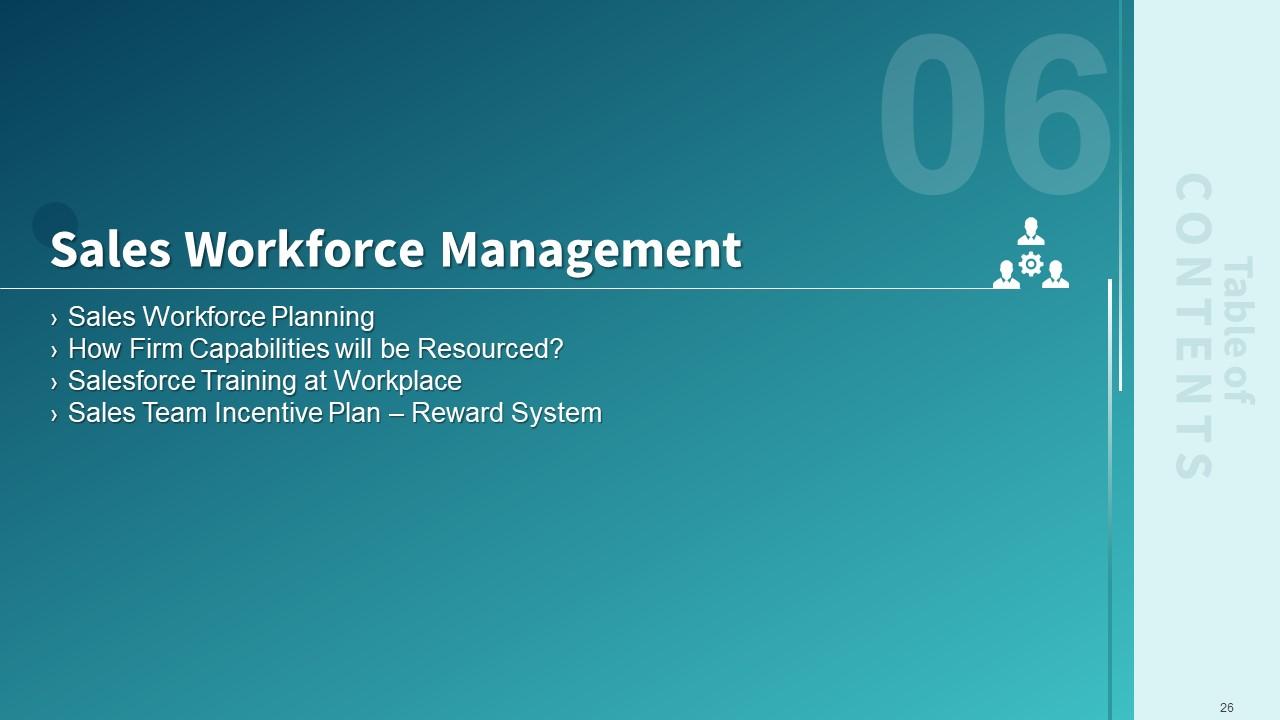
Slide 26: This slide displays Table of Contents.
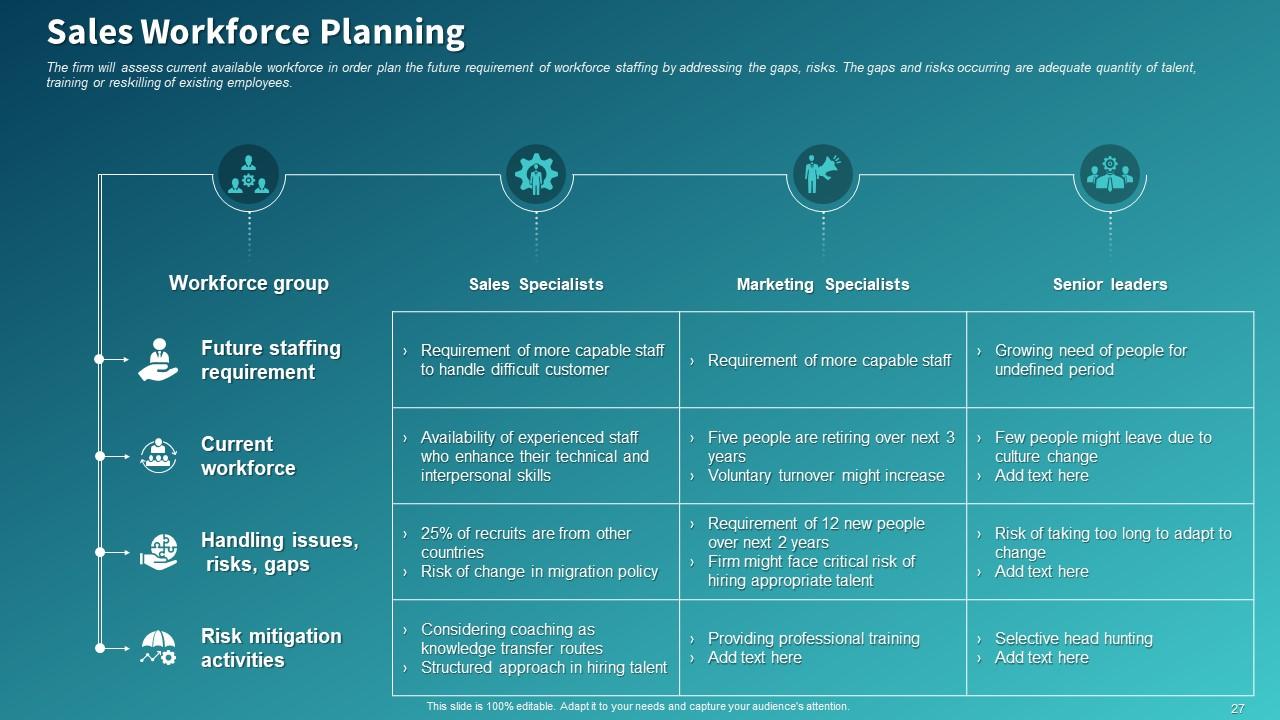
Slide 27: This slide depicts Sales Workforce Planning
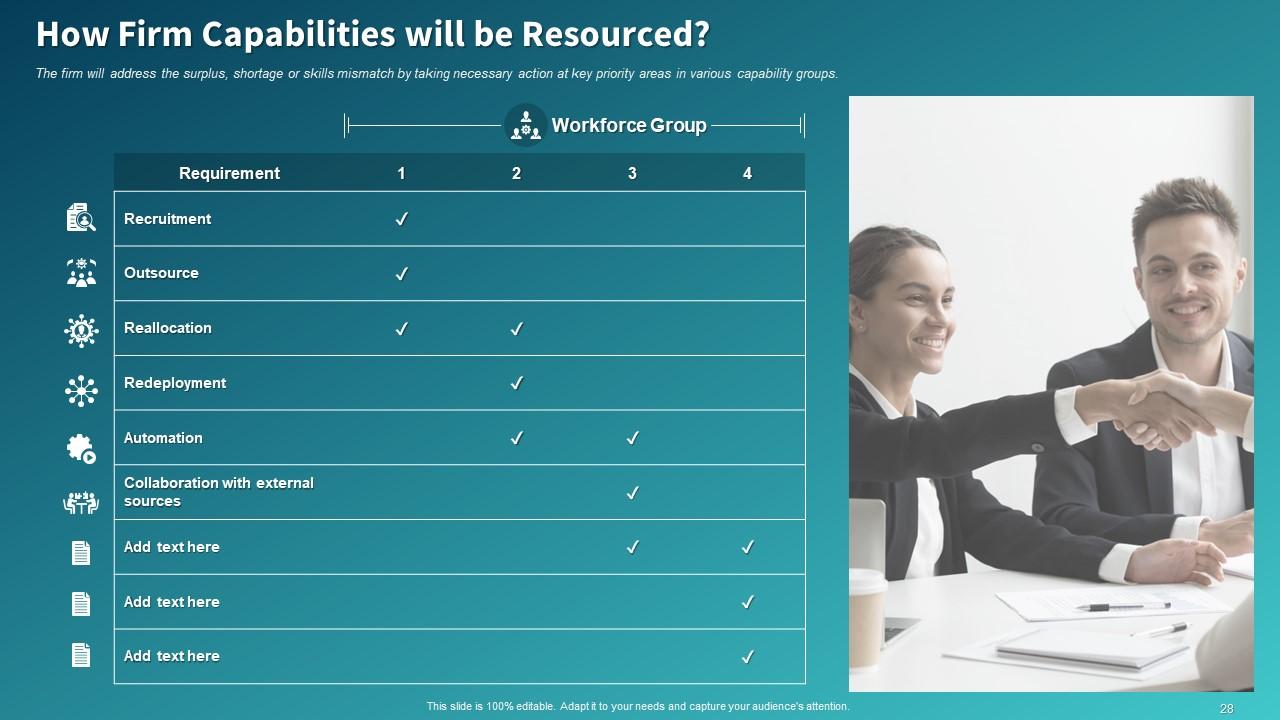
Slide 28: This slide shows How Firm Capabilities will be Resourced.
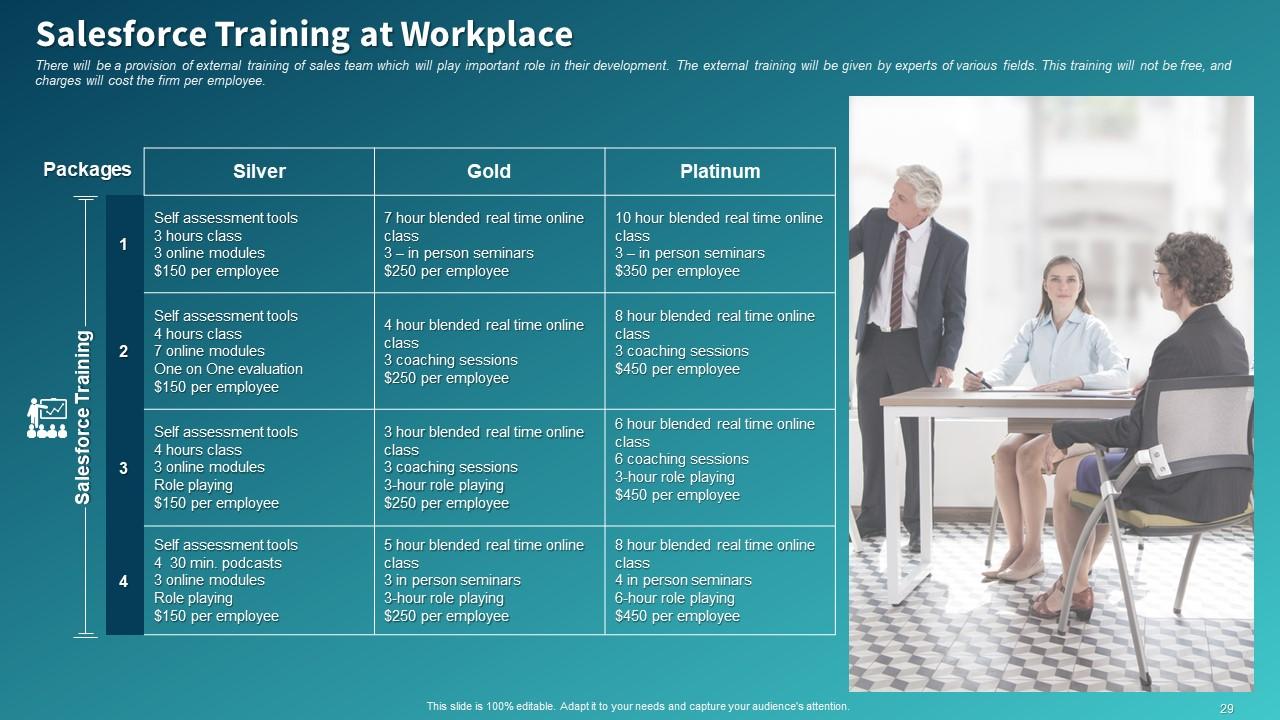
Slide 29: This slide shows Salesforce Training at Workplace
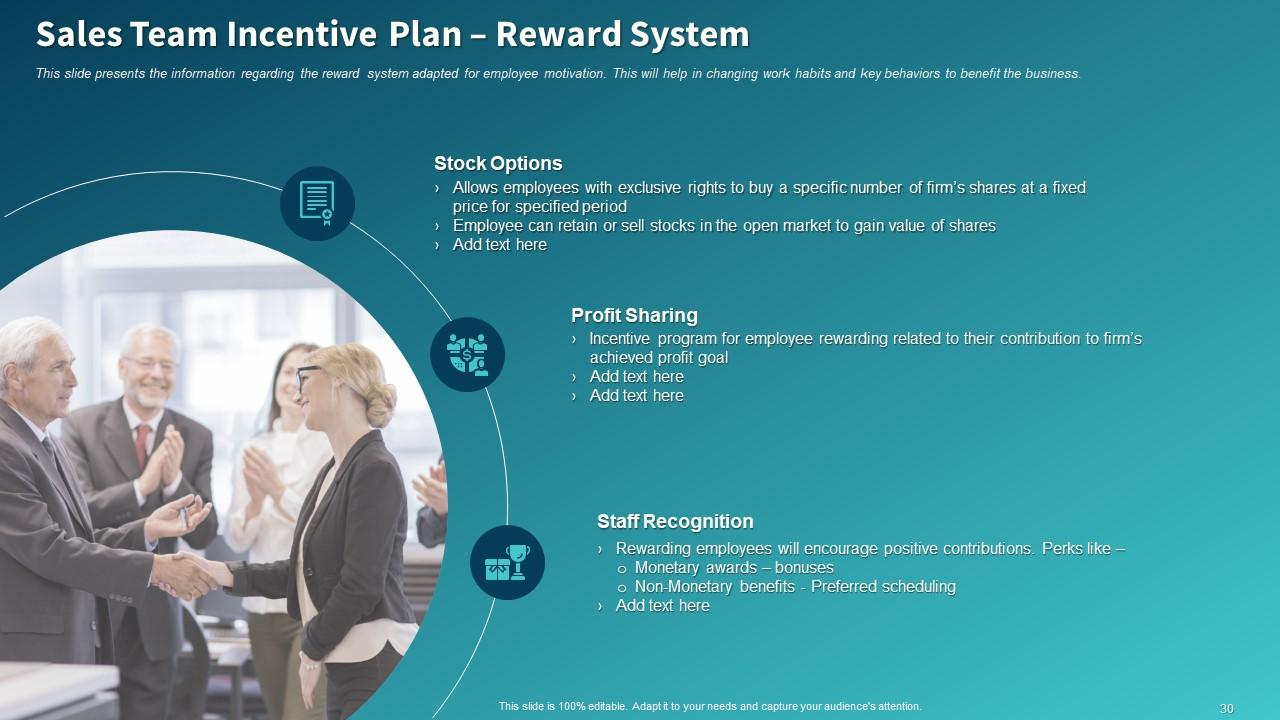
Slide 30: This slide depicts Sales Team Incentive Plan – Reward System
Slide 31: This slide shows Table of Contents.
Slide 32: The slide provides glimpse about customer profile that will help firm in better understanding of customer which includes customer demographics, background, etc
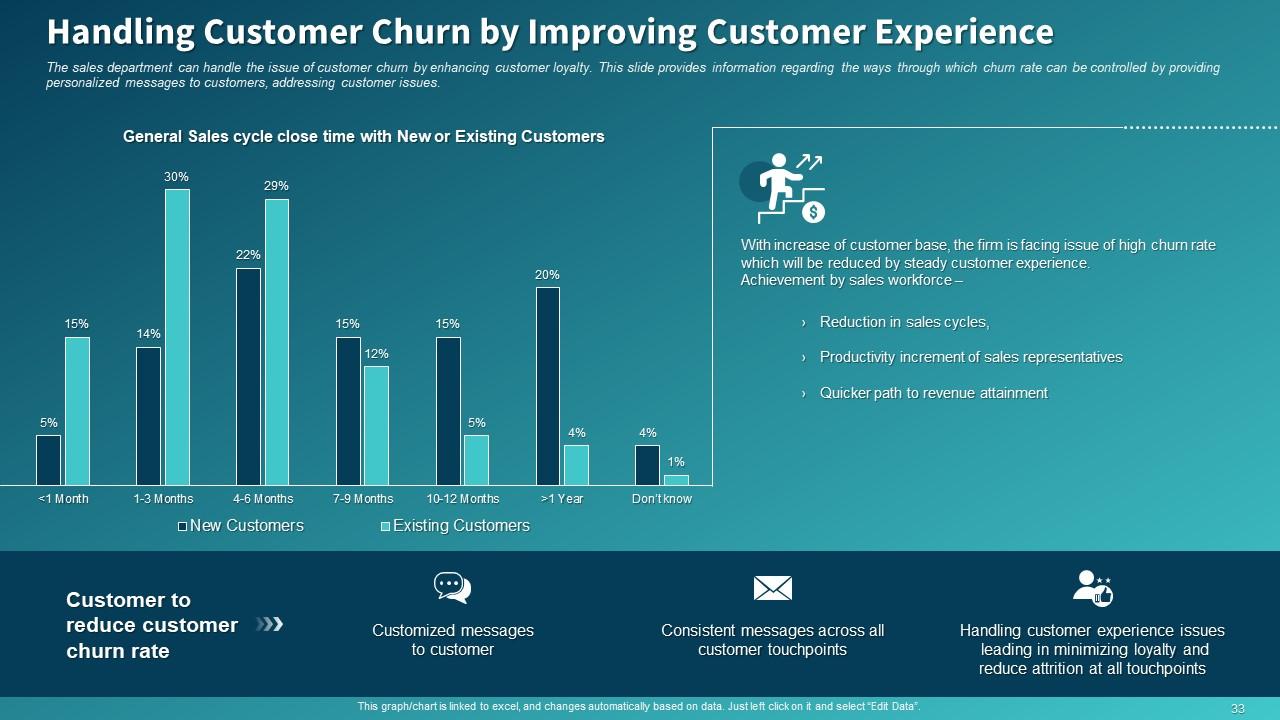
Slide 33: This slide explains about Handling Customer Churn by Improving Customer Experience
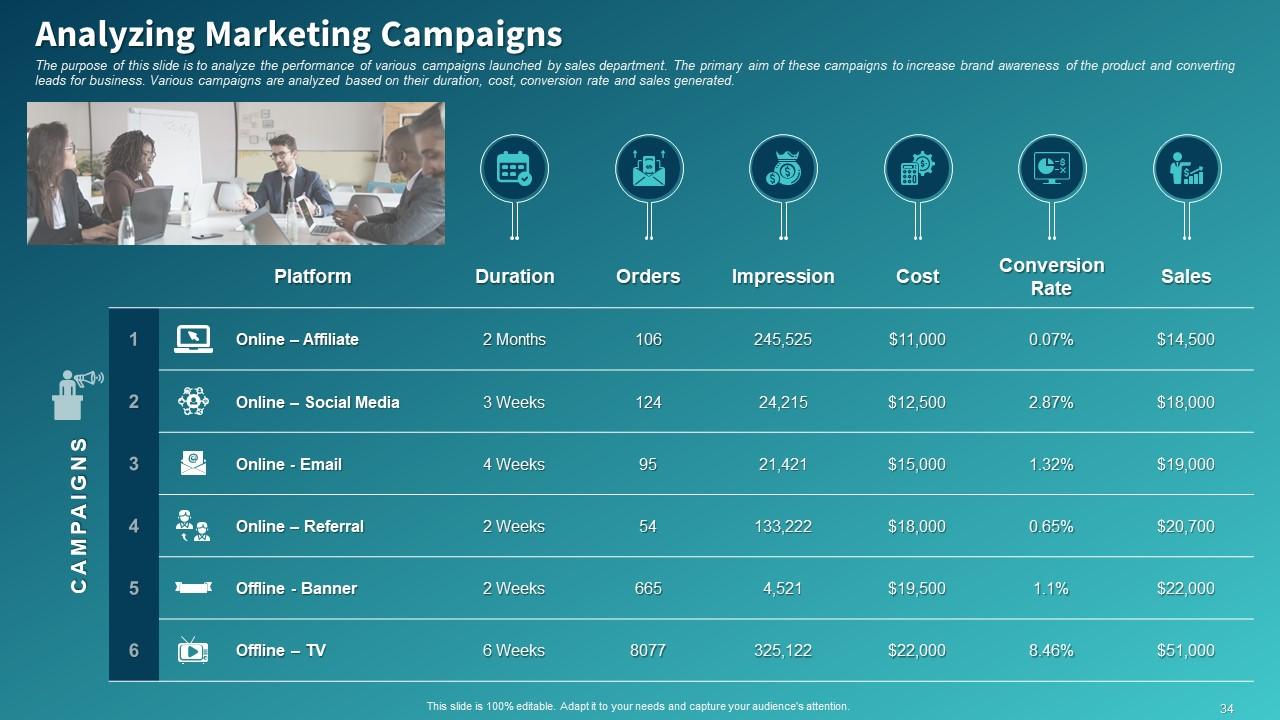
Slide 34: The purpose of this slide is to analyze the performance of various campaigns launched by sales department. The primary aim of these campaigns to increase brand awareness of the product and converting leads for business. Various campaigns are analyzed based on their duration, cost, conversion rate and sales generated.
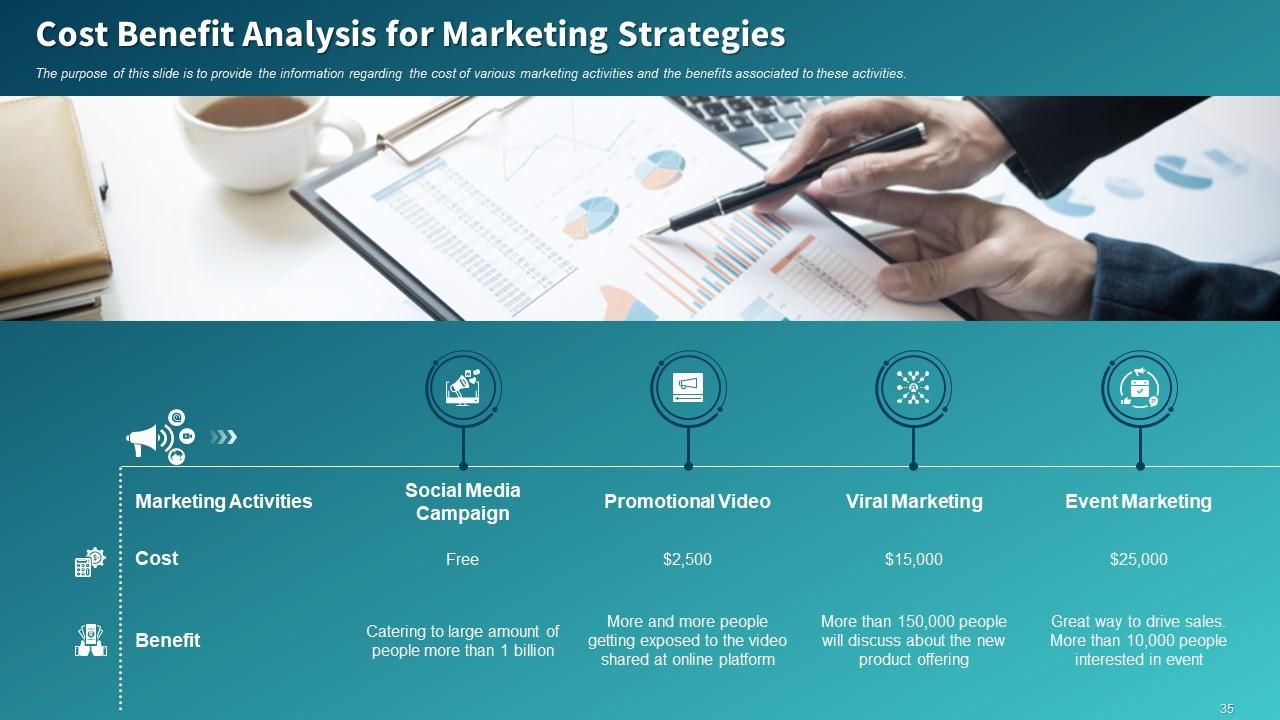
Slide 35: The purpose of this slide is to provide the information regarding the cost of various marketing activities and the benefits associated to these activities.
Slide 36: This slide shows Table of Contents.
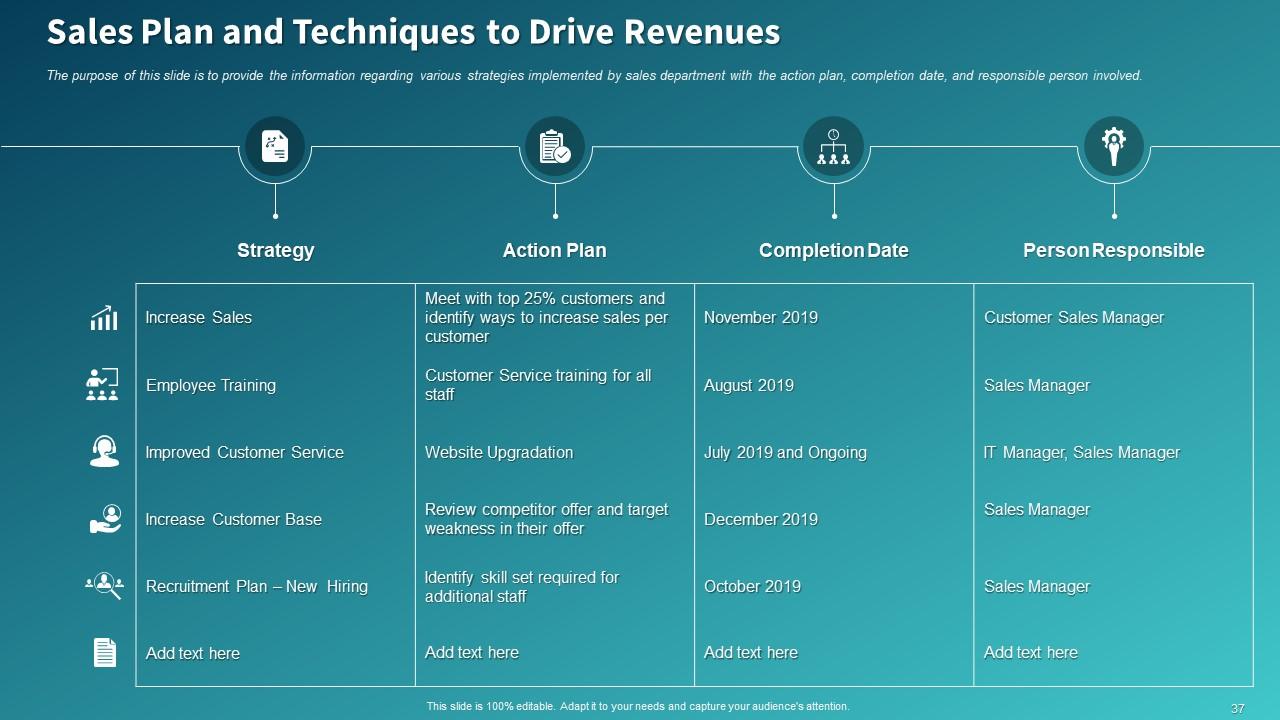
Slide 37: The purpose of this slide is to provide the information regarding various strategies implemented by sales department with the action plan, completion date, and responsible person involved.
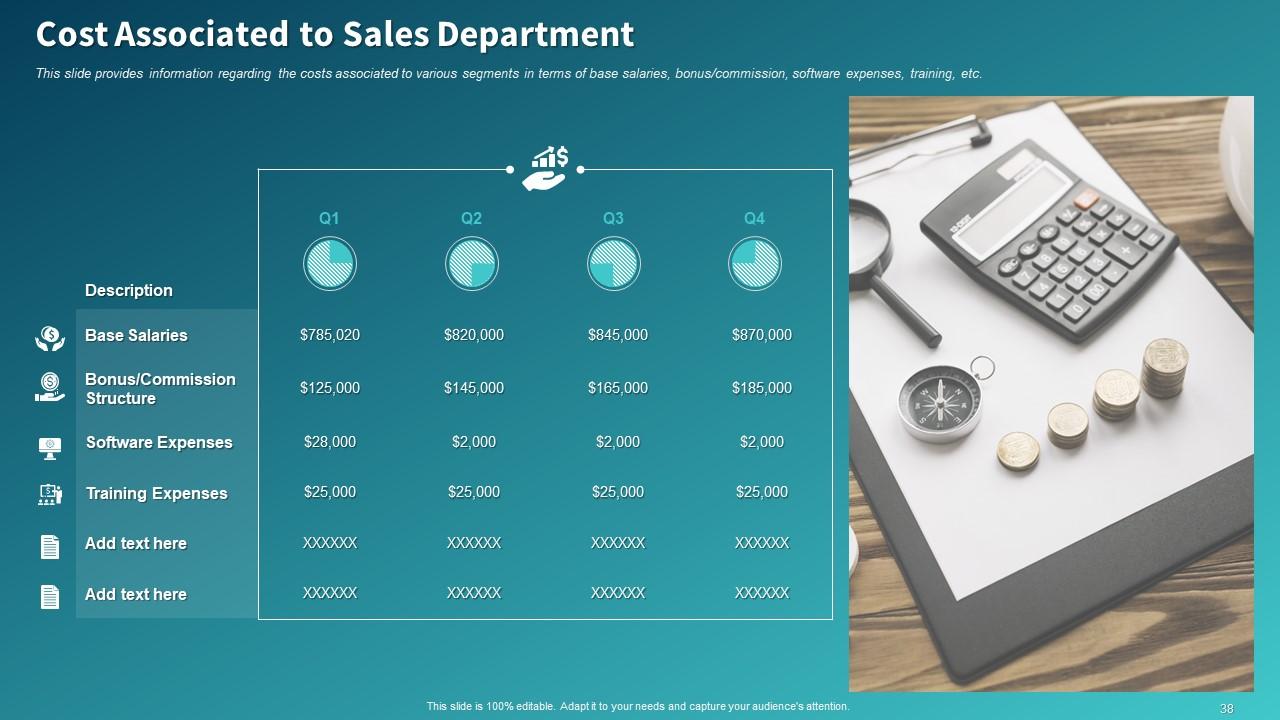
Slide 38: This slide provides information regarding the costs associated to various segments in terms of base salaries, bonus/commission, software expenses, training, etc.
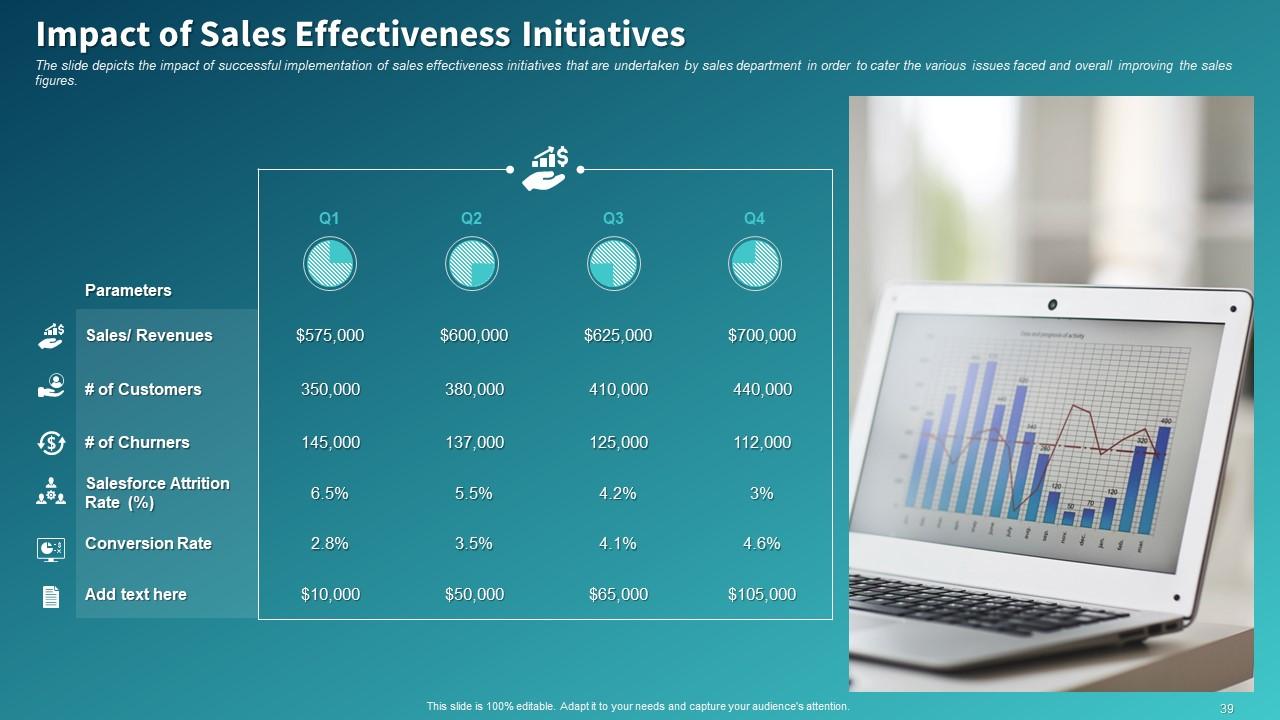
Slide 39: The slide depicts the impact of successful implementation of sales effectiveness initiatives that are undertaken by sales department in order to cater the various issues faced and overall improving the sales figures.
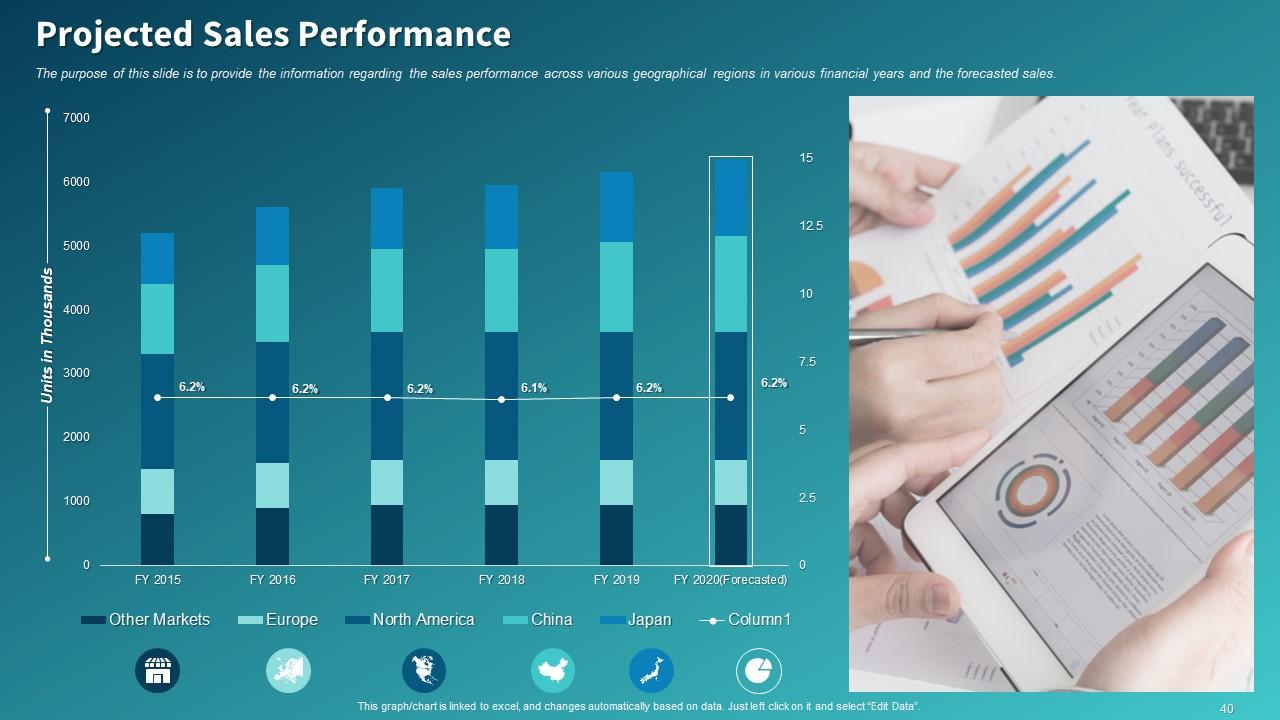
Slide 40: The purpose of this slide is to provide the information regarding the sales performance across various geographical regions in various financial years and the forecasted sales.
Slide 41: This slide displays Table of Contents.
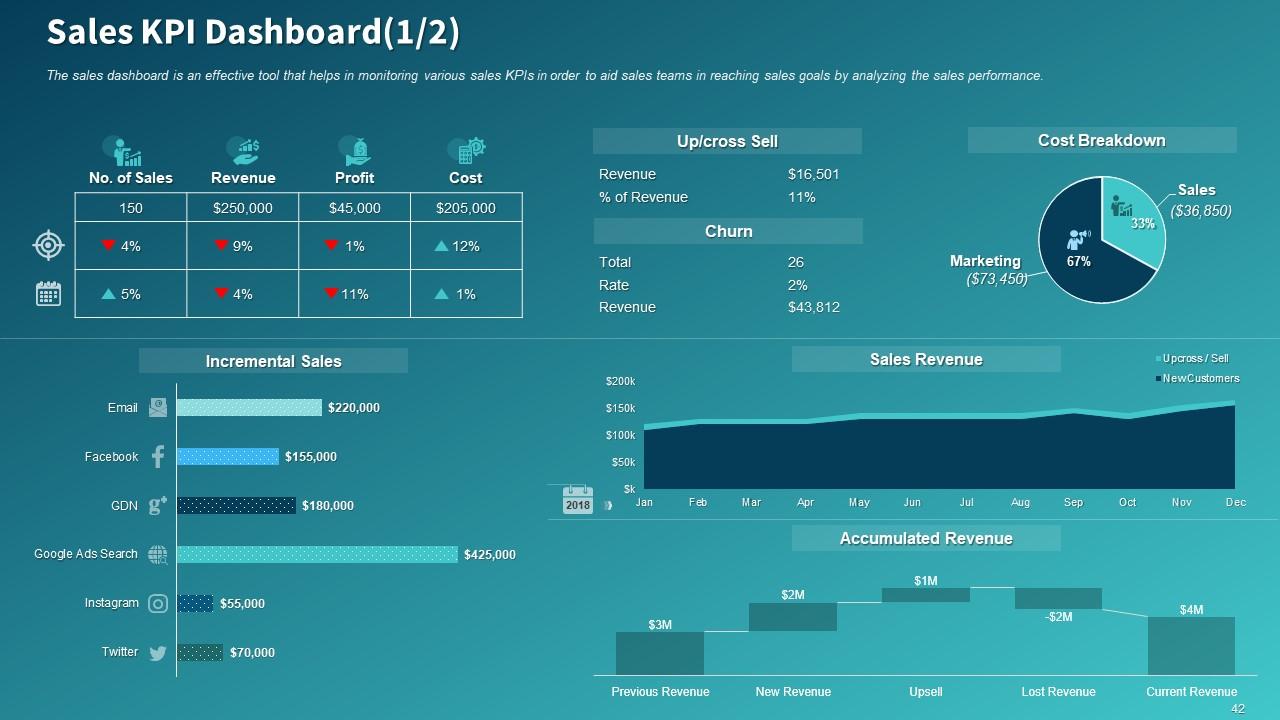
Slide 42: This slide shows Sales KPI Dashboard
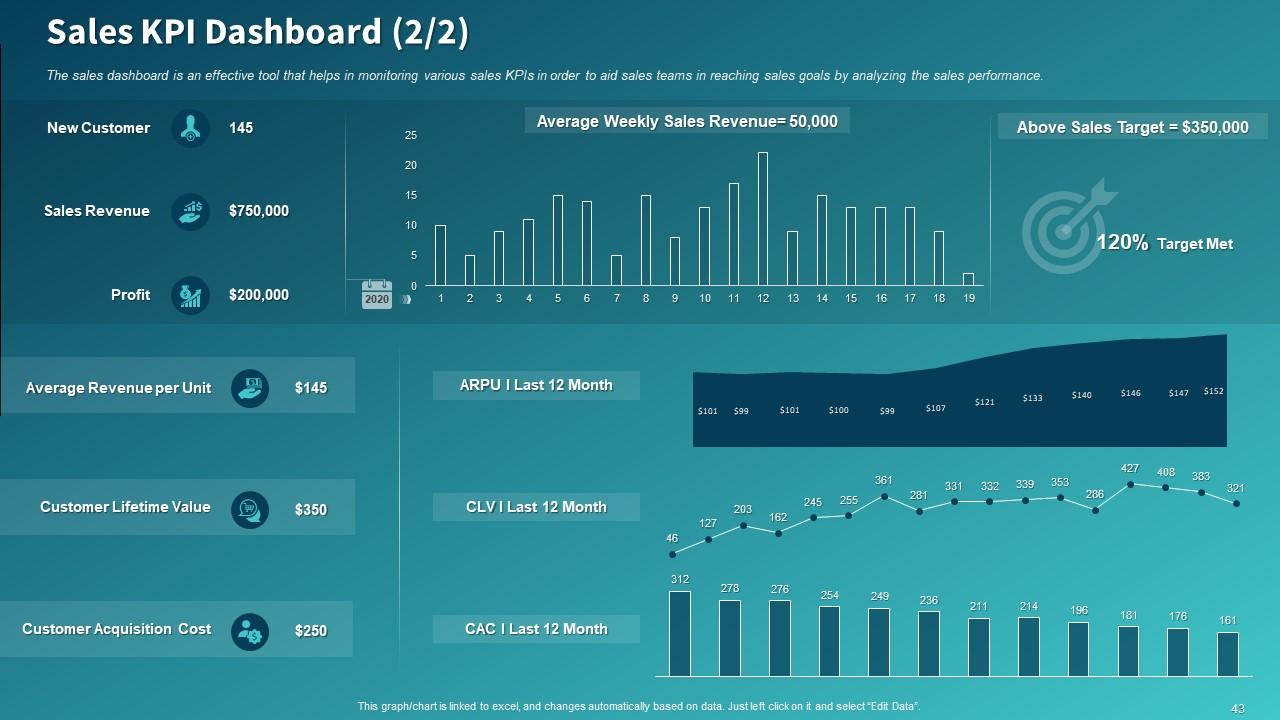
Slide 43: This slide presents Sales KPI Dashboard.
Slide 44: This is Sales Initiatives Report Icons Slide
Slide 45: This slide is titled as Additional slides for moving forward.
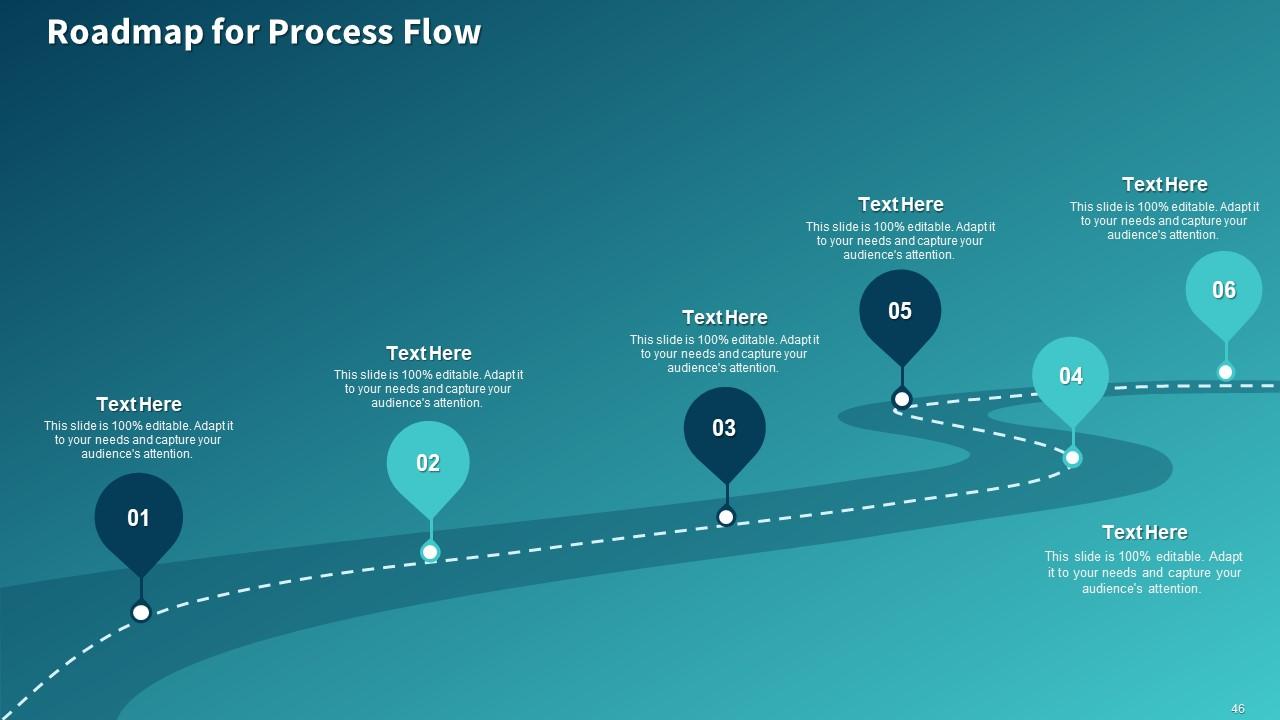
Slide 46: This slide shows Roadmap for Process Flow
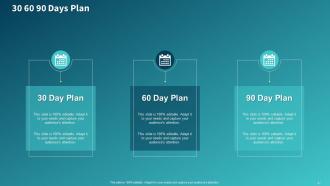
Slide 47: This is 30 60 90 Days Plan slide.
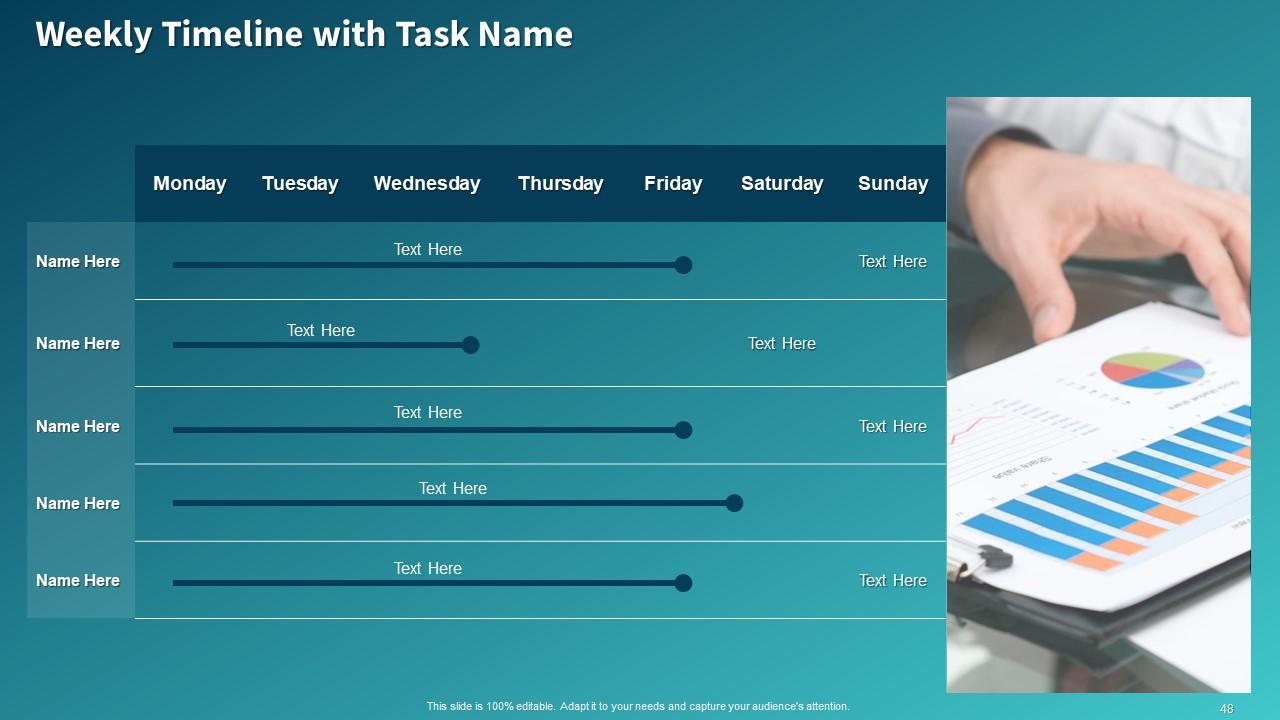
Slide 48: This slide shows Weekly Timeline with Task Name
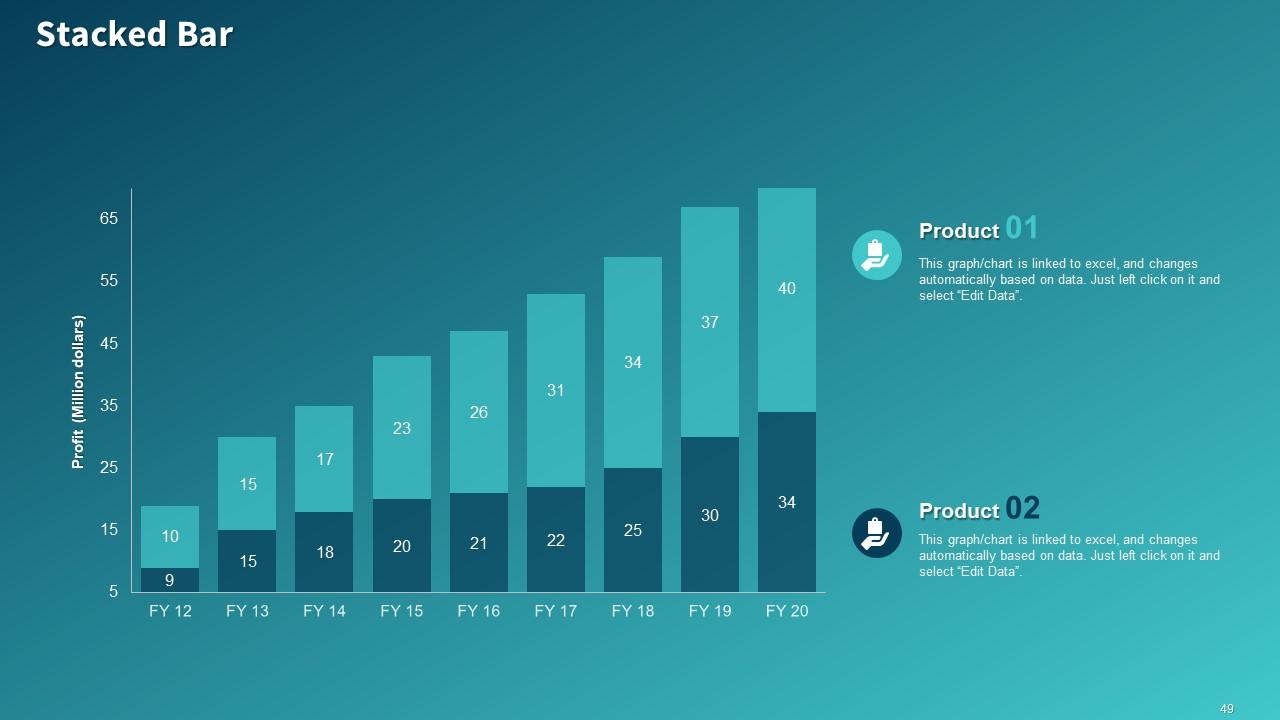
Slide 49: This slide displays Stacked Bar with product comparison.
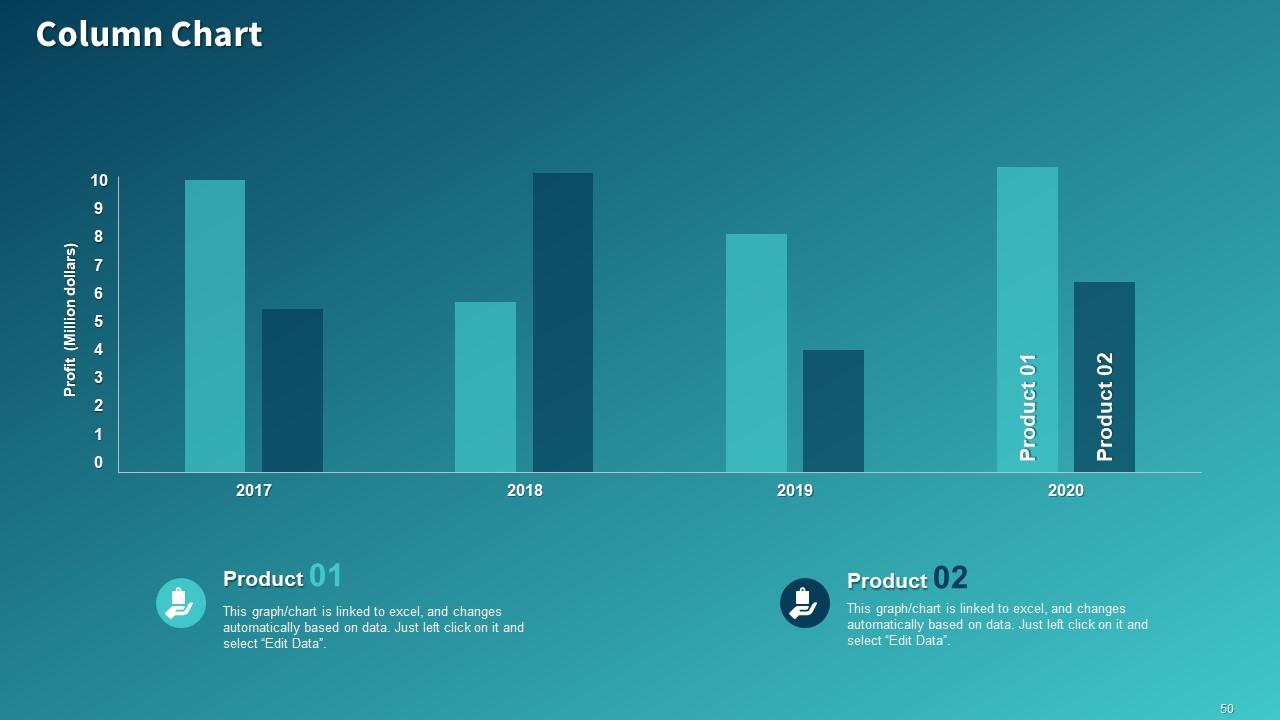
Slide 50: This slide displays Column Chart with product comparison.
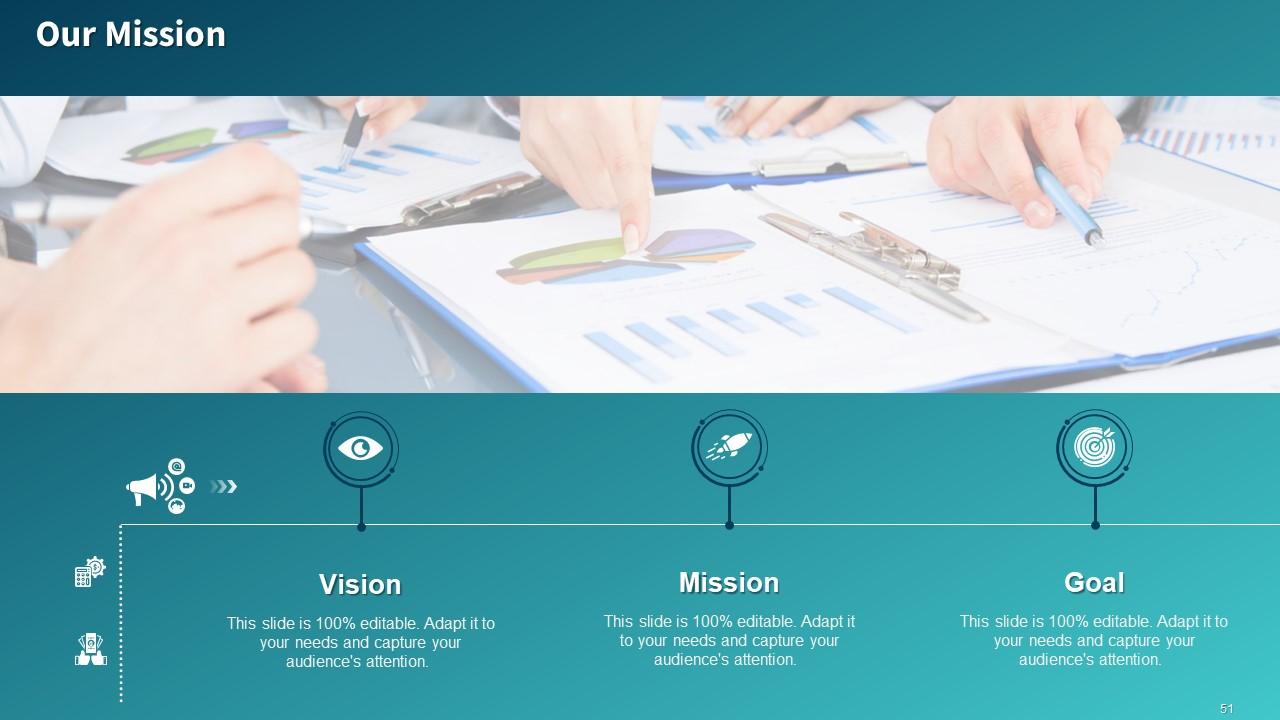
Slide 51: This slide displays Our Mission, Vision and Goal.
Slide 52: This is Our Team slide with Names and Designations.
Slide 53: This is Financial slide.
Slide 54: This is About us slide to showcase Company specifications.
Slide 55: This slide shows Comparison.
Slide 56: This slide is titled as Post it Notes for posting important notes.
Slide 57: This is Quotes slide to represent inspirational quotes.
Slide 58: This is Thank You slide with Address, Email address and Contact details.
Sales Initiatives Report Assessment To Improve Salesperson Performance Complete Deck with all 58 slides:
Use our Sales Initiatives Report Assessment To Improve Salesperson Performance Complete Deck to effectively help you save your valuable time. They are readymade to fit into any presentation structure.
-
Editable templates with innovative design and color combination.
-
Unique design & color.
-
Awesome use of colors and designs in product templates.


