Sales Revenue By Region Report With Doughnut Chart
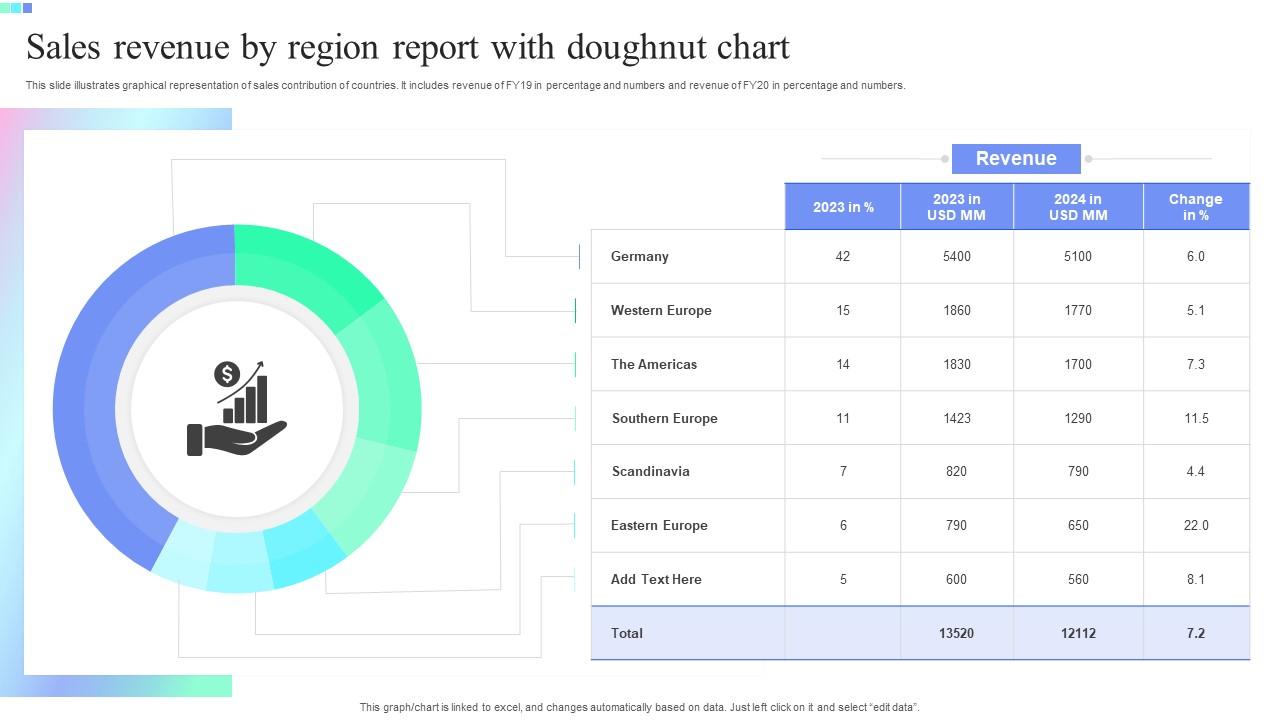
This slide illustrates graphical representation of sales contribution of countries.It includes revenue of FY19 in percentage and numbers and revenue of FY20 in percentage and numbers.
This slide illustrates graphical representation of sales contribution of countries.It includes revenue of FY19 in percentag..
- Google Slides is a new FREE Presentation software from Google.
- All our content is 100% compatible with Google Slides.
- Just download our designs, and upload them to Google Slides and they will work automatically.
- Amaze your audience with SlideTeam and Google Slides.
-
Want Changes to This PPT Slide? Check out our Presentation Design Services
- WideScreen Aspect ratio is becoming a very popular format. When you download this product, the downloaded ZIP will contain this product in both standard and widescreen format.
-

- Some older products that we have may only be in standard format, but they can easily be converted to widescreen.
- To do this, please open the SlideTeam product in Powerpoint, and go to
- Design ( On the top bar) -> Page Setup -> and select "On-screen Show (16:9)” in the drop down for "Slides Sized for".
- The slide or theme will change to widescreen, and all graphics will adjust automatically. You can similarly convert our content to any other desired screen aspect ratio.
Compatible With Google Slides

Get This In WideScreen
You must be logged in to download this presentation.
PowerPoint presentation slides
This slide illustrates graphical representation of sales contribution of countries. It includes revenue of FY19 in percentage and numbers and revenue of FY20 in percentage and numbers. Introducing our Sales Revenue By Region Report With Doughnut Chart set of slides. The topics discussed in these slides are Sales, Doughnut Chart. This is an immediately available PowerPoint presentation that can be conveniently customized. Download it and convince your audience.
People who downloaded this PowerPoint presentation also viewed the following :
Sales Revenue By Region Report With Doughnut Chart with all 7 slides:
Use our Sales Revenue By Region Report With Doughnut Chart to effectively help you save your valuable time. They are readymade to fit into any presentation structure.
-
The templates you provide are great! They have saved me tons of time and made my presentations come alive. Thank you for this awesome product. Keep up the good work!
-
The design is very attractive, informative, and eye-catching, with bold colors that stand out against all the basic presentation templates.


