Service Marketing Quarterly Performance Improvement Statistics Social Media Marketing
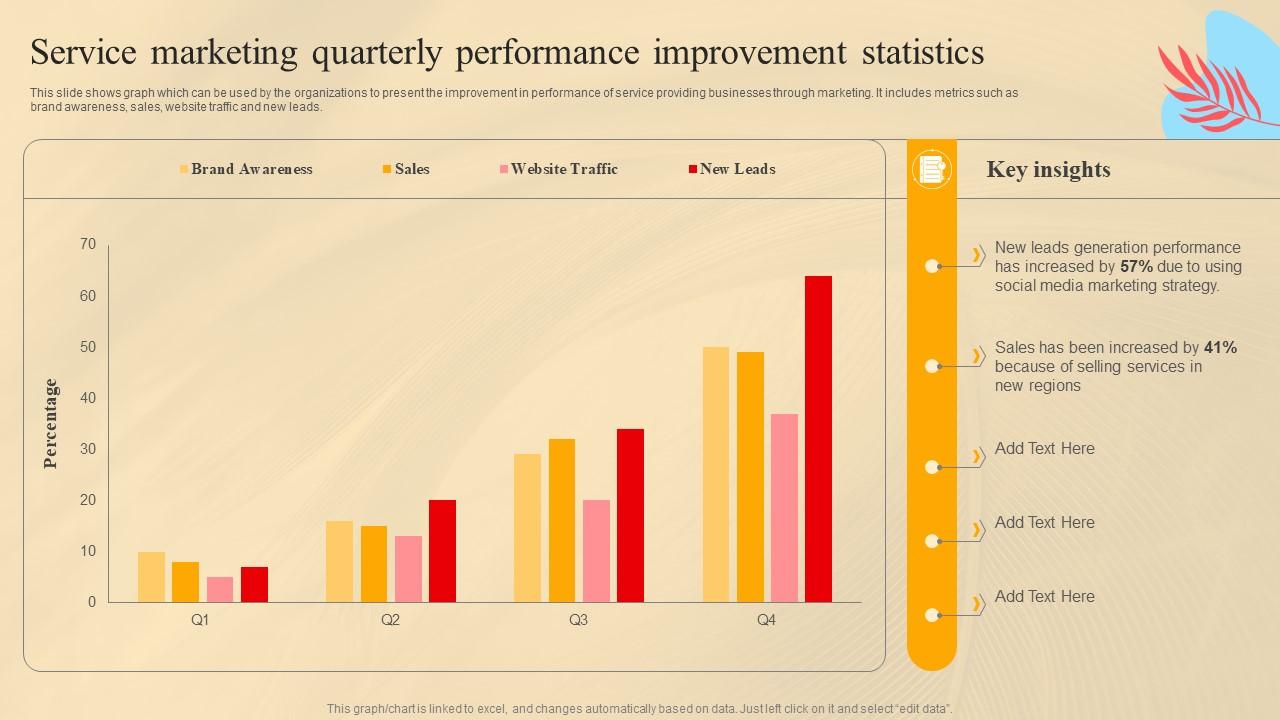
This slide shows graph which can be used by the organizations to present the improvement in performance of service providing businesses through marketing. It includes metrics such as brand awareness, sales, website traffic and new leads.
This slide shows graph which can be used by the organizations to present the improvement in performance of service providin..
- Google Slides is a new FREE Presentation software from Google.
- All our content is 100% compatible with Google Slides.
- Just download our designs, and upload them to Google Slides and they will work automatically.
- Amaze your audience with SlideTeam and Google Slides.
-
Want Changes to This PPT Slide? Check out our Presentation Design Services
- WideScreen Aspect ratio is becoming a very popular format. When you download this product, the downloaded ZIP will contain this product in both standard and widescreen format.
-

- Some older products that we have may only be in standard format, but they can easily be converted to widescreen.
- To do this, please open the SlideTeam product in Powerpoint, and go to
- Design ( On the top bar) -> Page Setup -> and select "On-screen Show (16:9)” in the drop down for "Slides Sized for".
- The slide or theme will change to widescreen, and all graphics will adjust automatically. You can similarly convert our content to any other desired screen aspect ratio.
Compatible With Google Slides

Get This In WideScreen
You must be logged in to download this presentation.
PowerPoint presentation slides
This slide shows graph which can be used by the organizations to present the improvement in performance of service providing businesses through marketing. It includes metrics such as brand awareness, sales, website traffic and new leads. Deliver an outstanding presentation on the topic using this Service Marketing Quarterly Performance Improvement Statistics Social Media Marketing Dispense information and present a thorough explanation of New Regions, Social Media, Marketing Strategy using the slides given. This template can be altered and personalized to fit your needs. It is also available for immediate download. So grab it now.
People who downloaded this PowerPoint presentation also viewed the following :
Service Marketing Quarterly Performance Improvement Statistics Social Media Marketing with all 7 slides:
Use our Service Marketing Quarterly Performance Improvement Statistics Social Media Marketing to effectively help you save your valuable time. They are readymade to fit into any presentation structure.
-
The website is jam-packed with fantastic and creative templates for a variety of business concepts. They are easy to use and customize.
-
Wow, never been this impressed with any online service provider. Really appreciate the customer support all along from the navigation to purchasing the right products.


