Strategic Guide For Web Design Company Performance Improvement Powerpoint Presentation Slides
Website design and development company a platform for building digital sites to take business online. This Strategic Guide for Web Design Company Performance Improvement presentation provides a deep dive into the web design company overview including company information, key statistics, service range, revenue sources, client base, geographical presence, etc. Grab our professionally designed PowerPoint, which provides conceptual information into the workings of a web design and development company. It further outlines the businesss current performance assessment with the respective SMART goals of the business. This presentation explores various reasons related to the declining performance of businesses such as technological advancement, security issues, high employee turnover, poor marketing strategies, etc. Furthermore, the Web Design Company PPT addresses the crucial elements of budgeting, providing key insights and practical tips on allocating resources more effectively for maximum impact. At last, this deck outlines various real life examples of Website designing companies working. Dont miss out on the chance to enhance Web designing company performance. Get the Website design company performance improvement PPT today and unlock the potential to drive growth, attract patients, and establish a brand as the industry leader. Download it right now.
Website design and development company a platform for building digital sites to take business online. This Strategic Guide ..
- Google Slides is a new FREE Presentation software from Google.
- All our content is 100% compatible with Google Slides.
- Just download our designs, and upload them to Google Slides and they will work automatically.
- Amaze your audience with SlideTeam and Google Slides.
-
Want Changes to This PPT Slide? Check out our Presentation Design Services
- WideScreen Aspect ratio is becoming a very popular format. When you download this product, the downloaded ZIP will contain this product in both standard and widescreen format.
-

- Some older products that we have may only be in standard format, but they can easily be converted to widescreen.
- To do this, please open the SlideTeam product in Powerpoint, and go to
- Design ( On the top bar) -> Page Setup -> and select "On-screen Show (16:9)” in the drop down for "Slides Sized for".
- The slide or theme will change to widescreen, and all graphics will adjust automatically. You can similarly convert our content to any other desired screen aspect ratio.
Compatible With Google Slides

Get This In WideScreen
You must be logged in to download this presentation.
PowerPoint presentation slides
Enthrall your audience with this Strategic Guide For Web Design Company Performance Improvement Powerpoint Presentation Slides. Increase your presentation threshold by deploying this well-crafted template. It acts as a great communication tool due to its well-researched content. It also contains stylized icons, graphics, visuals etc, which make it an immediate attention-grabber. Comprising eighty seven slides, this complete deck is all you need to get noticed. All the slides and their content can be altered to suit your unique business setting. Not only that, other components and graphics can also be modified to add personal touches to this prefabricated set.
People who downloaded this PowerPoint presentation also viewed the following :
Content of this Powerpoint Presentation
Slide 1: This slide showcase title Strategic Guide for Web Design Company Performance Improvement. State Your Company Name.
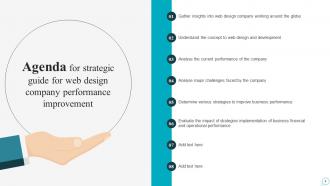
Slide 2: This slide showcase title Agenda for strategic guide for web design company performance improvement.
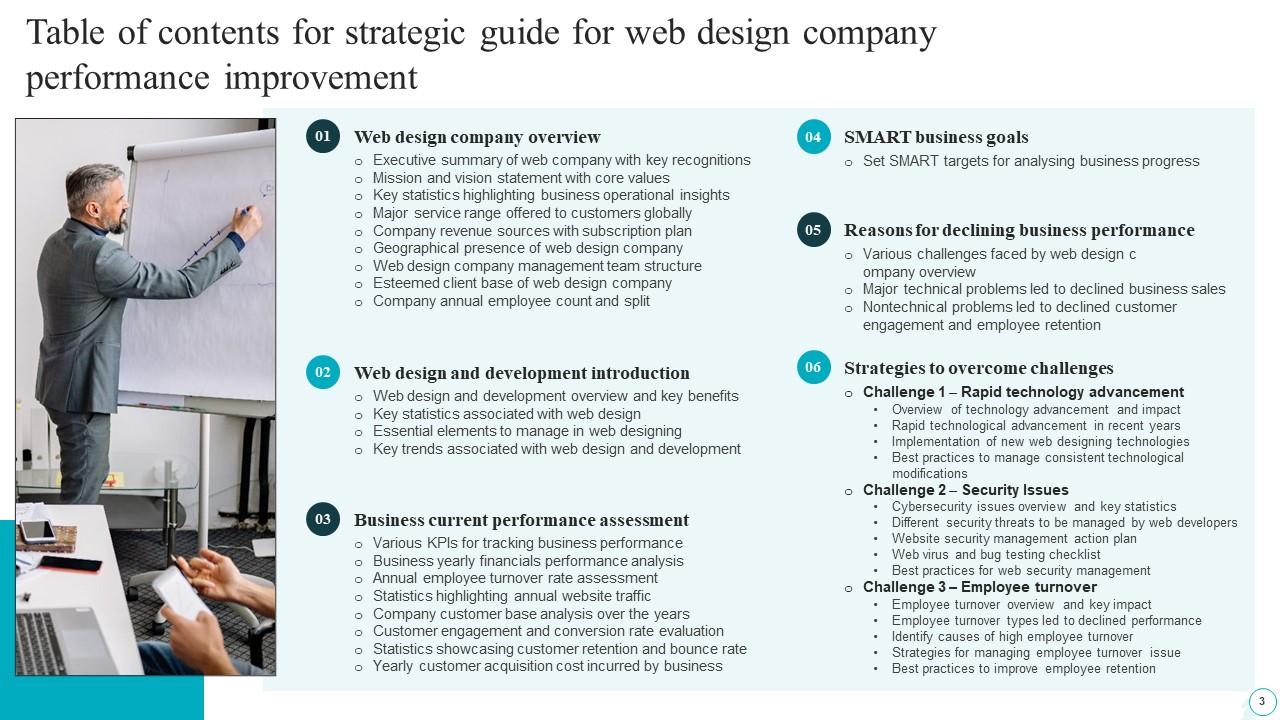
Slide 3: This slide exhibit Table of Content.
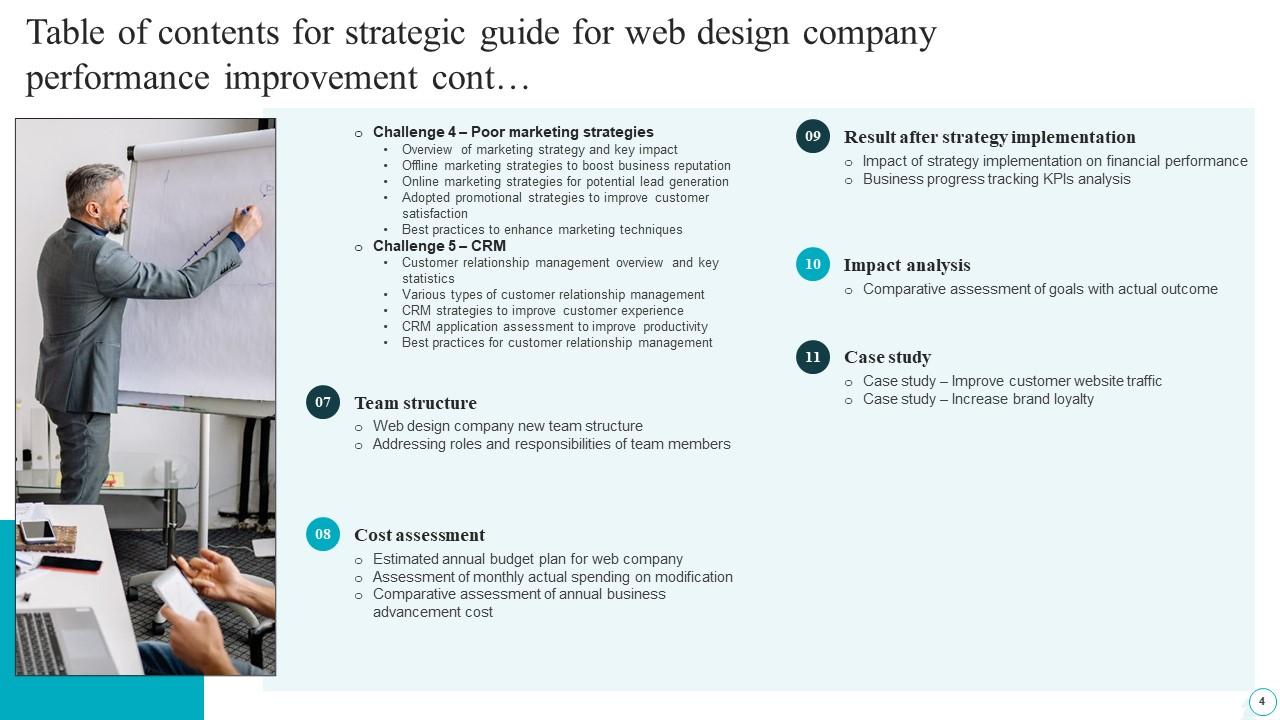
Slide 4: This slide exhibit Table of Content.
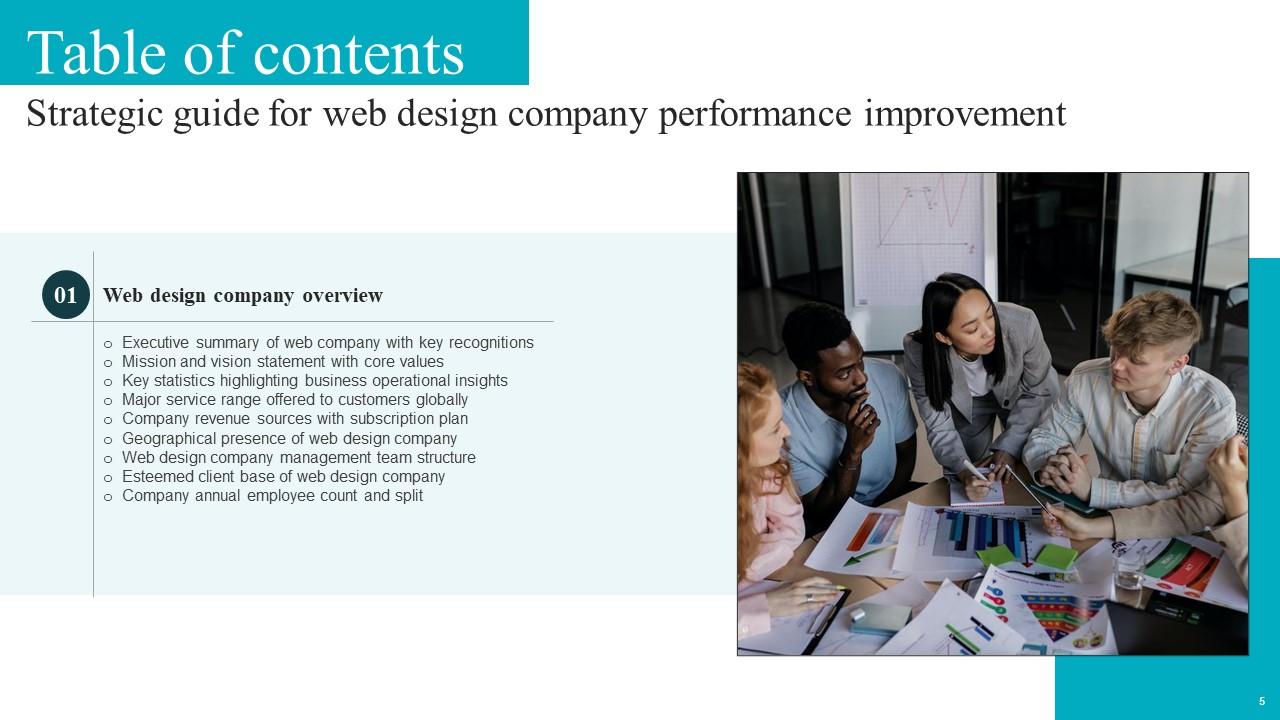
Slide 5: This slide exhibit Table of Content: Web design company overview.
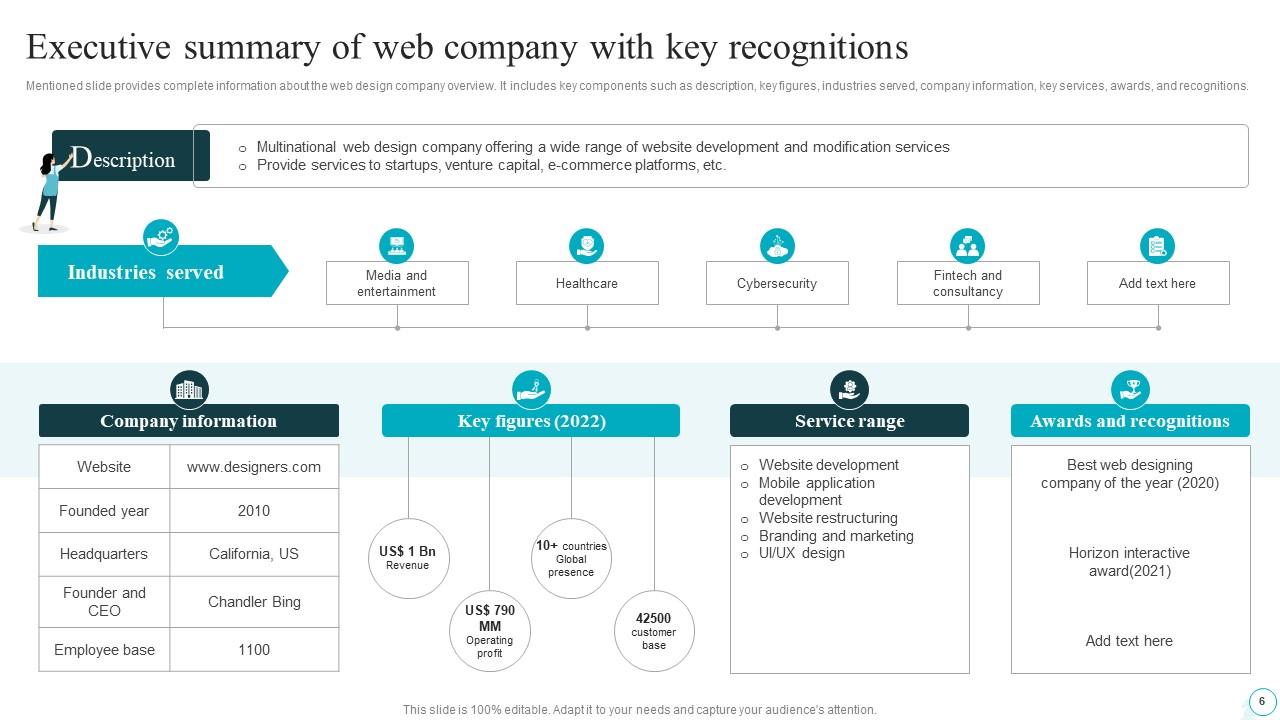
Slide 6: This slide provides complete information about the web design company overview.
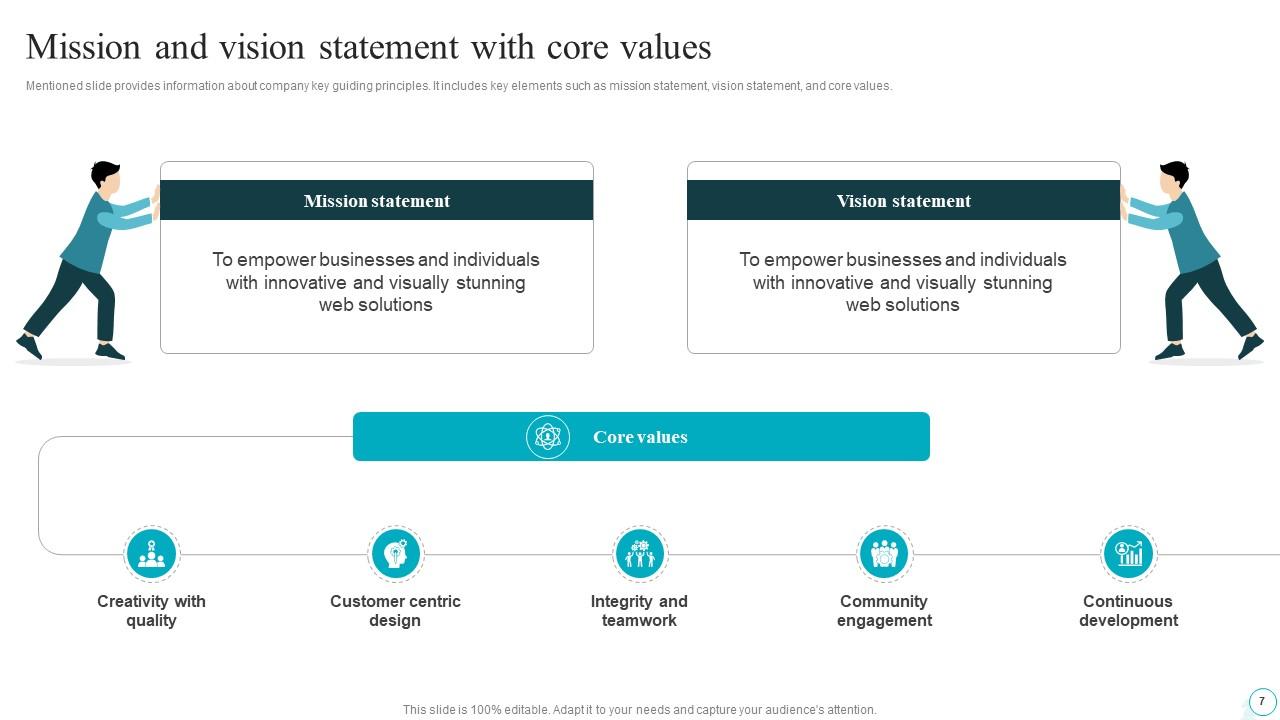
Slide 7: This slide provides information about company key guiding principles.
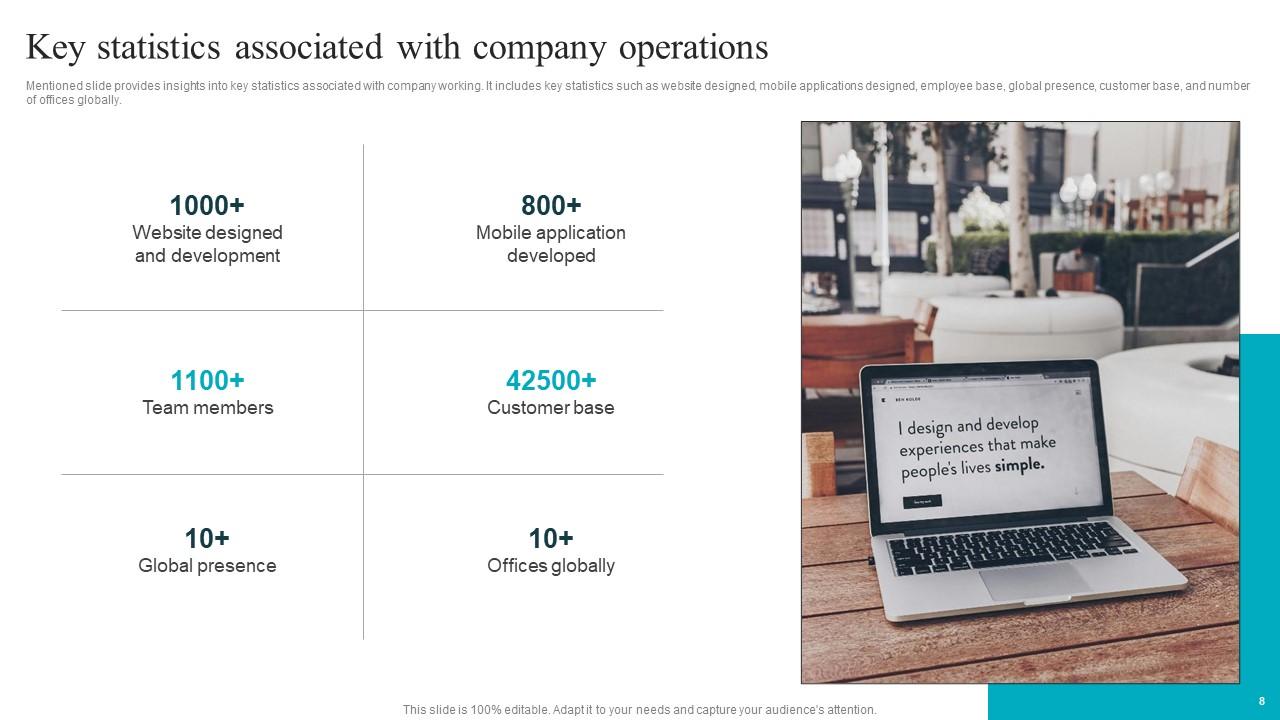
Slide 8: This slide provides insights into key statistics associated with company working.
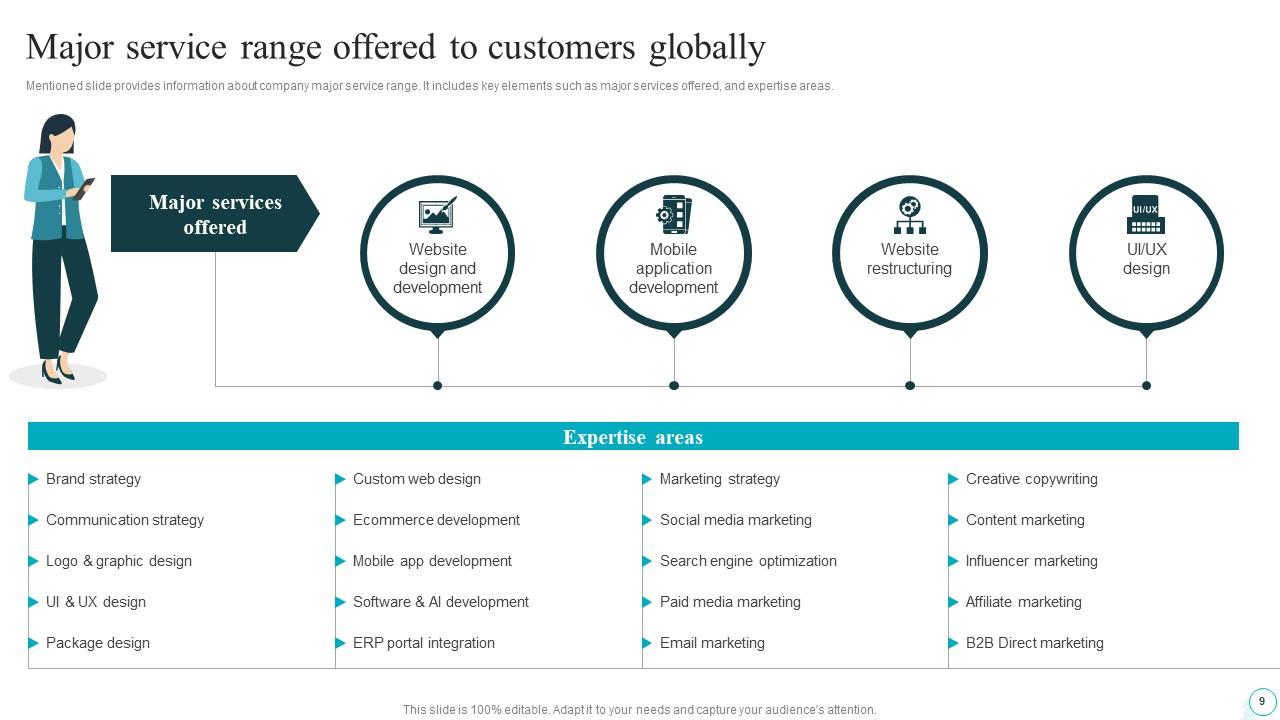
Slide 9: This slide provides information about company major service range. It includes key elements such as major services offered, and expertise areas.
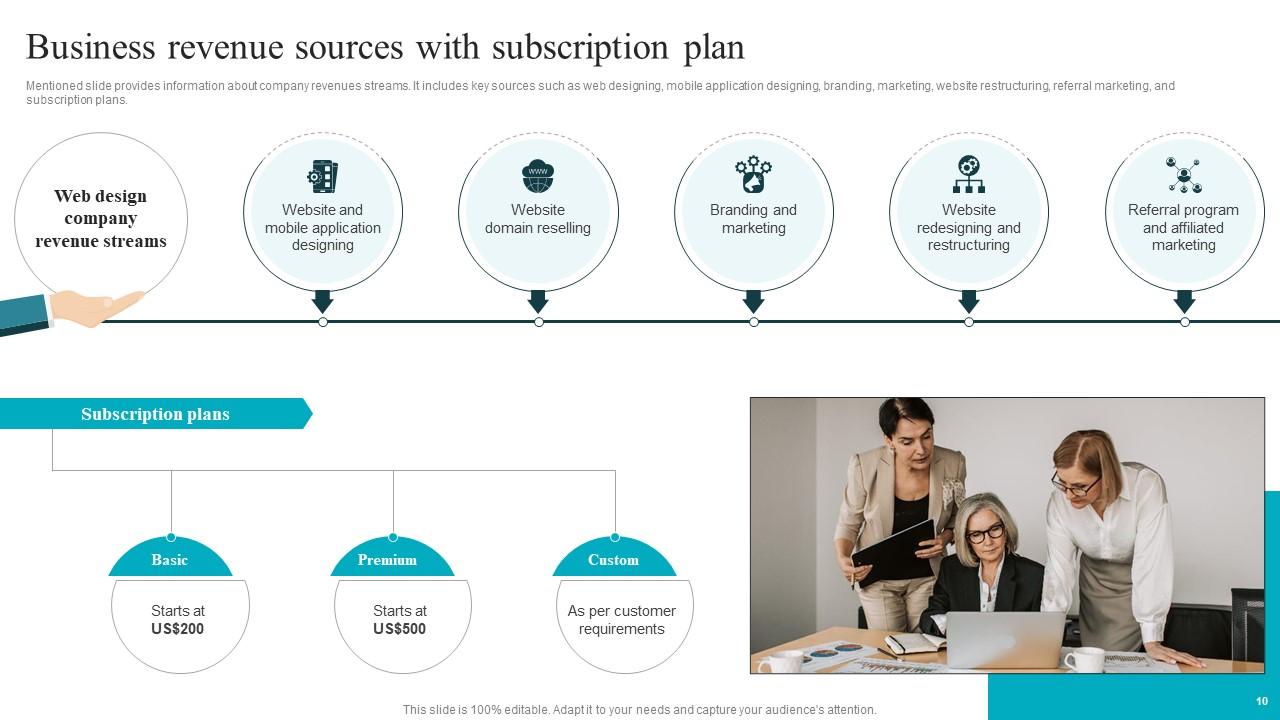
Slide 10: This slide provides information about company revenues streams.
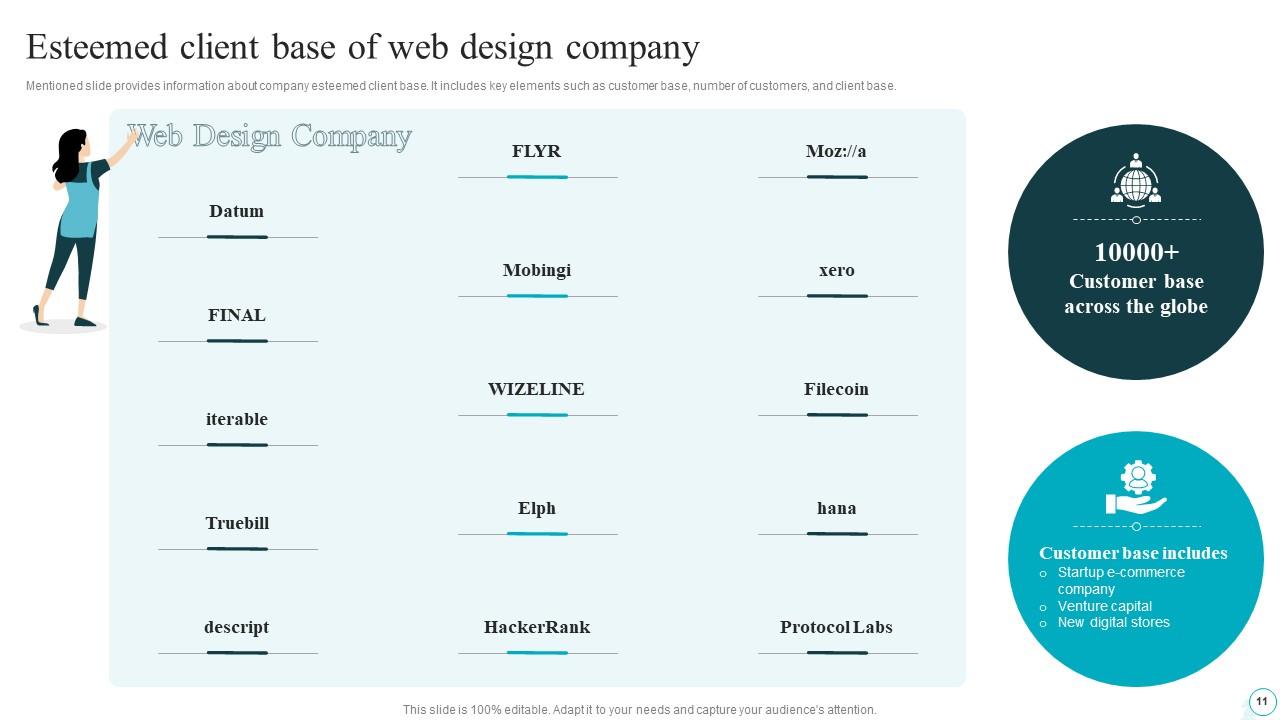
Slide 11: This slide provides information about company esteemed client base.
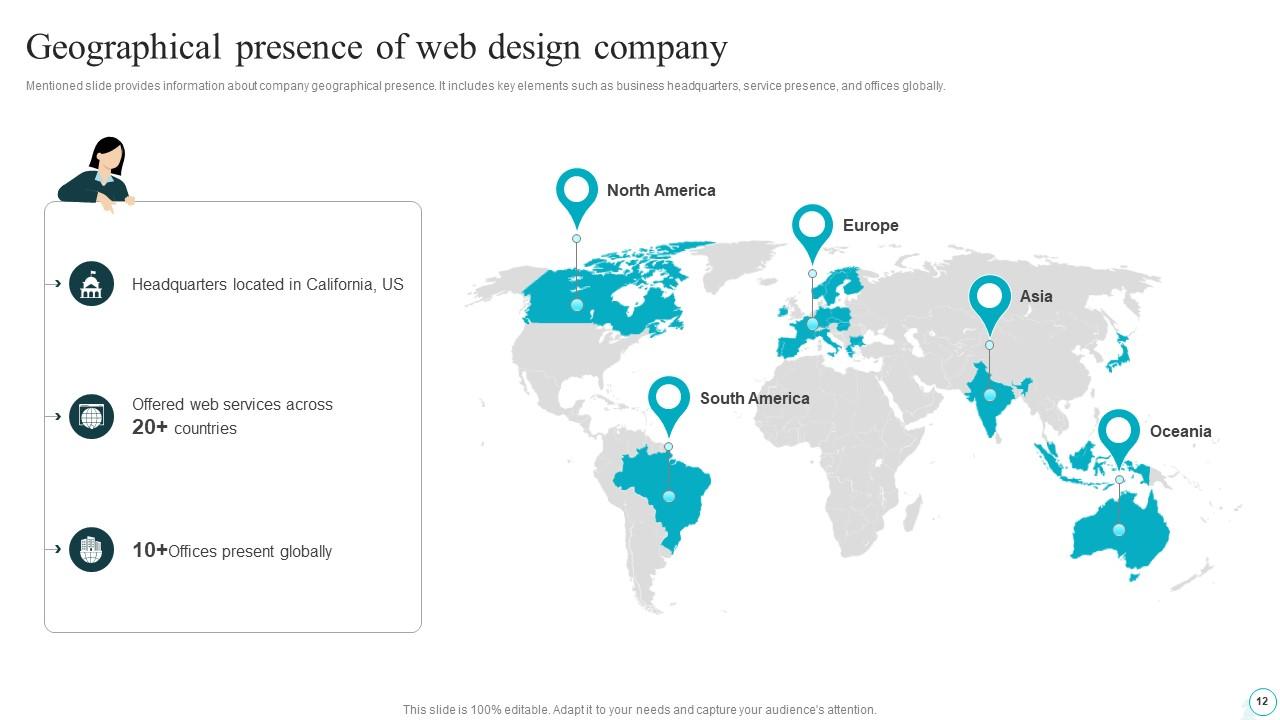
Slide 12: This slide provides information about company geographical presence.
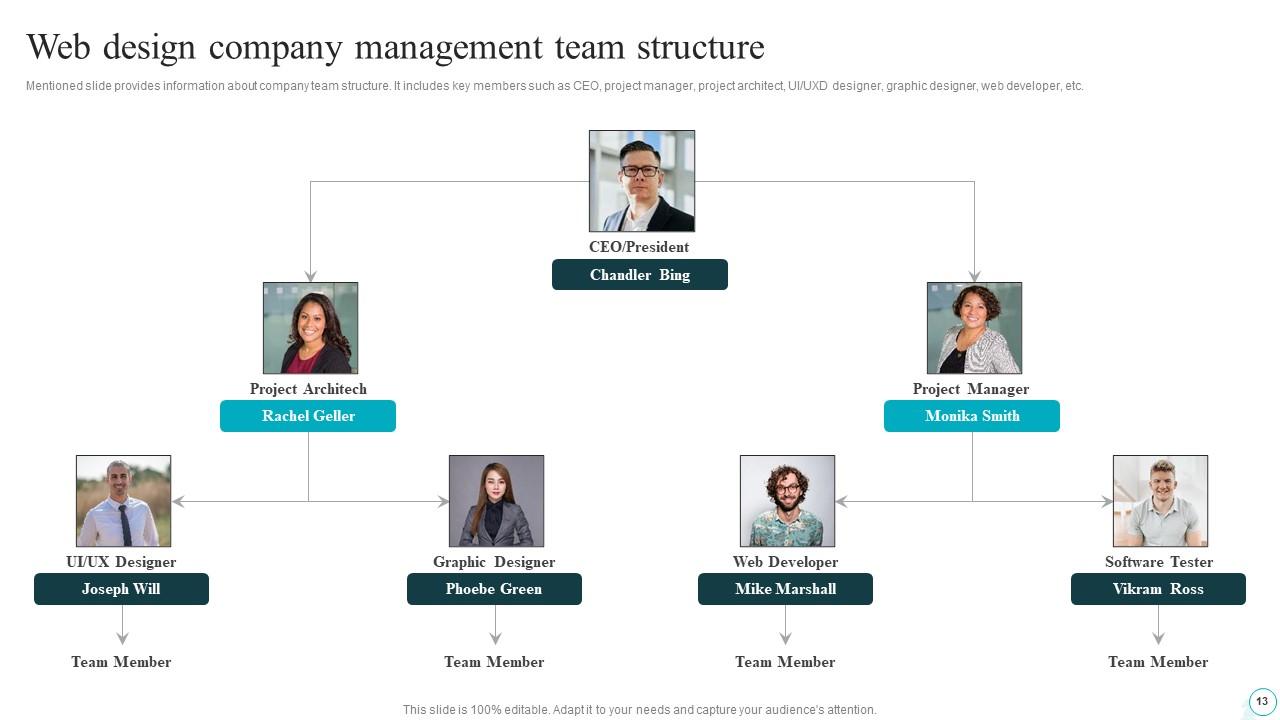
Slide 13: This slide provides information about company team structure.
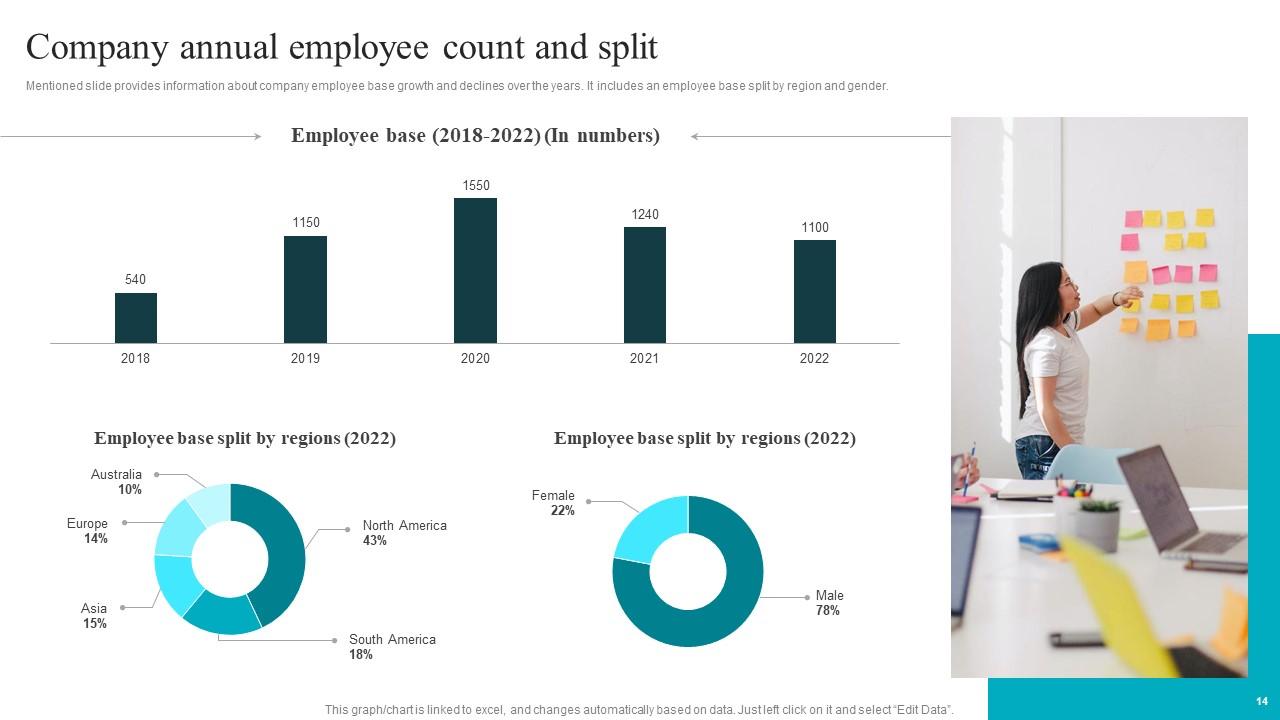
Slide 14: This slide provides information about company employee base growth and declines over the years.
Slide 15: This slide exhibit Table of Content: Web design and development introduction
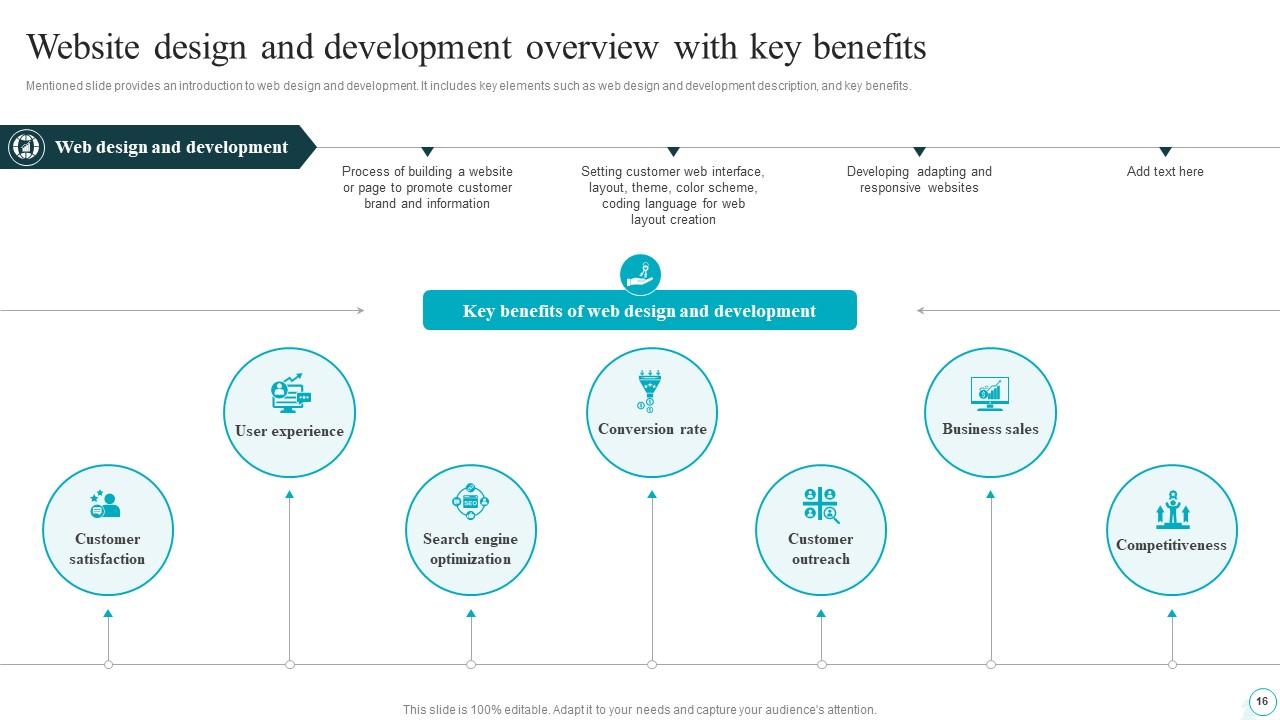
Slide 16: This slide provides an introduction to web design and development.
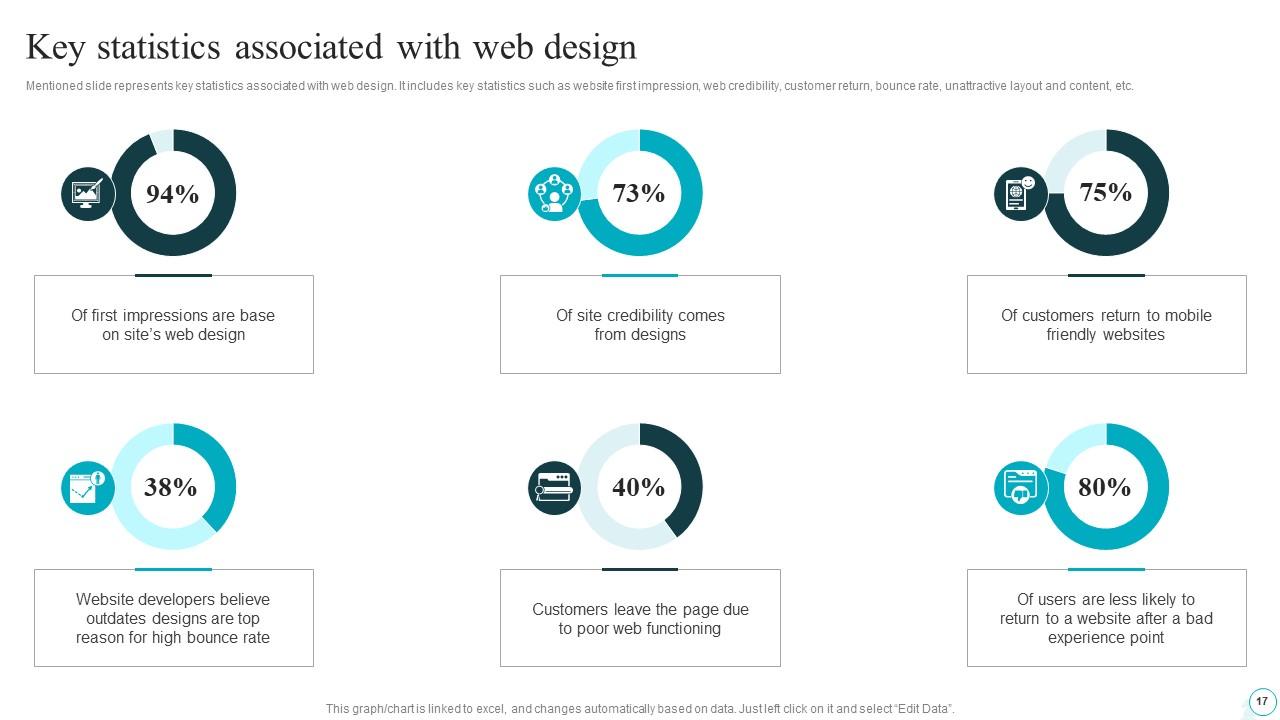
Slide 17: This slide represents key statistics associated with web design.
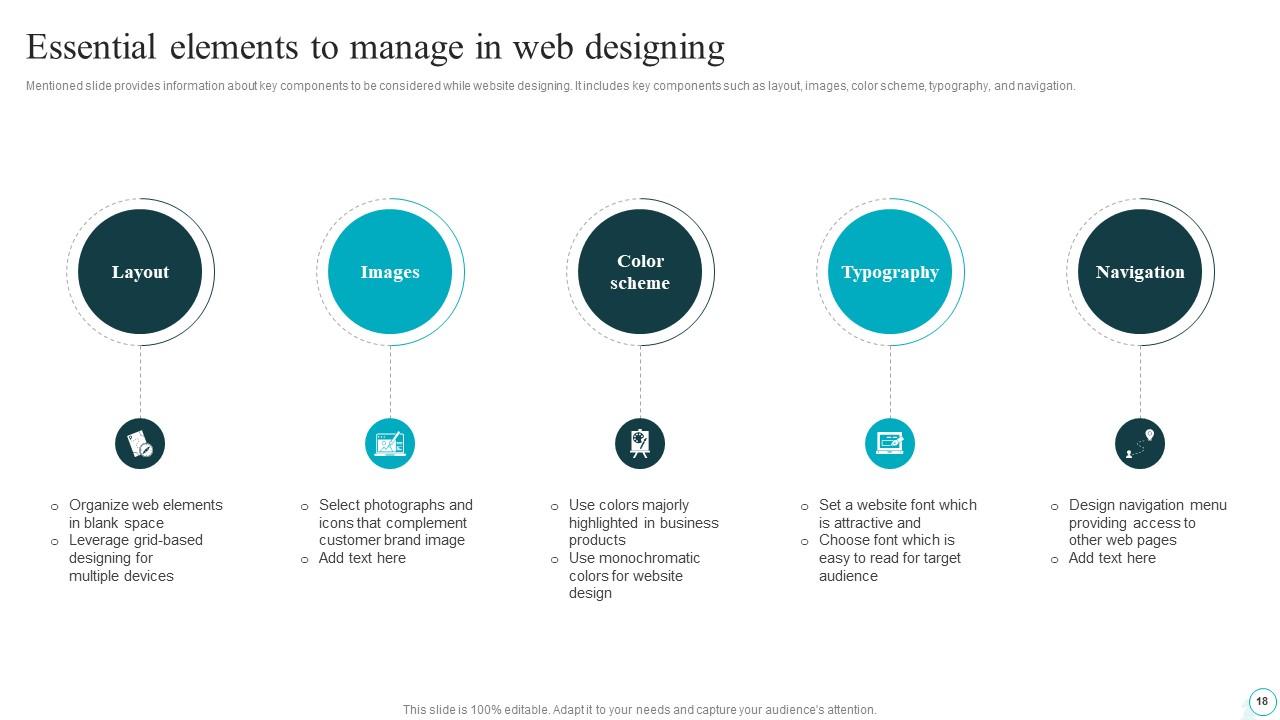
Slide 18: This slide provides information about key components to be considered while website designing.
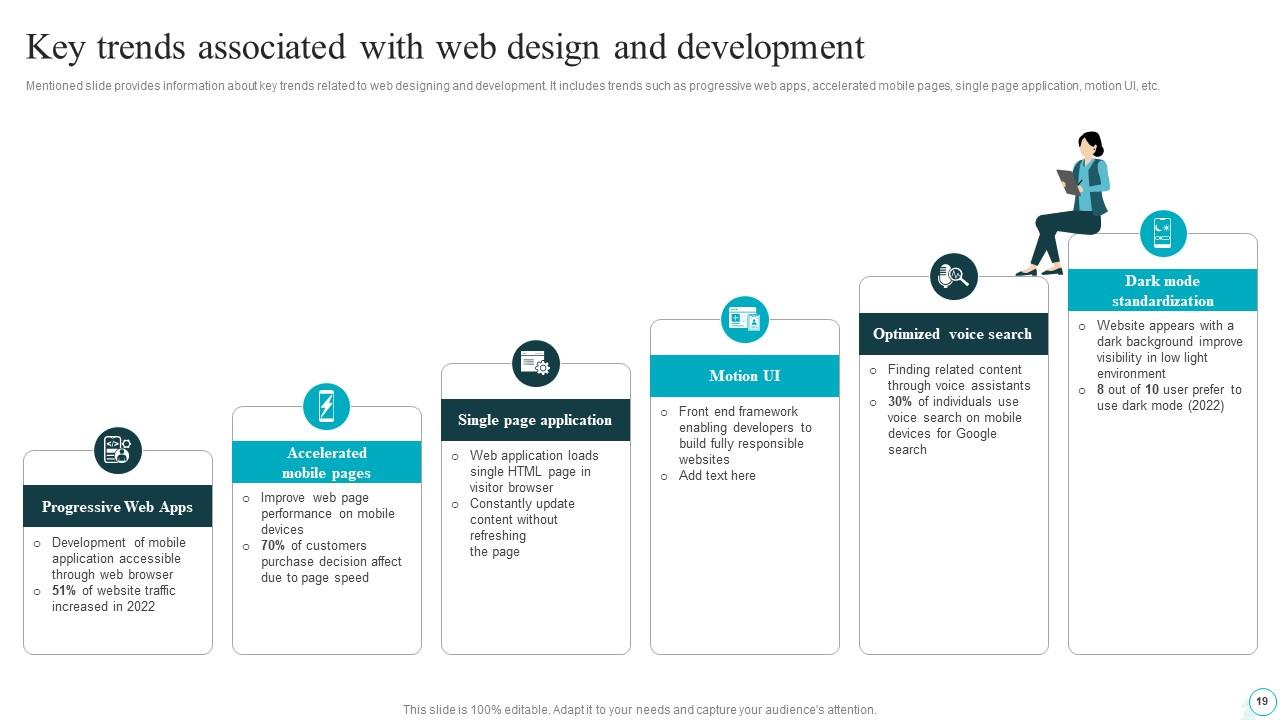
Slide 19: This slide provides information about key trends related to web designing and development.
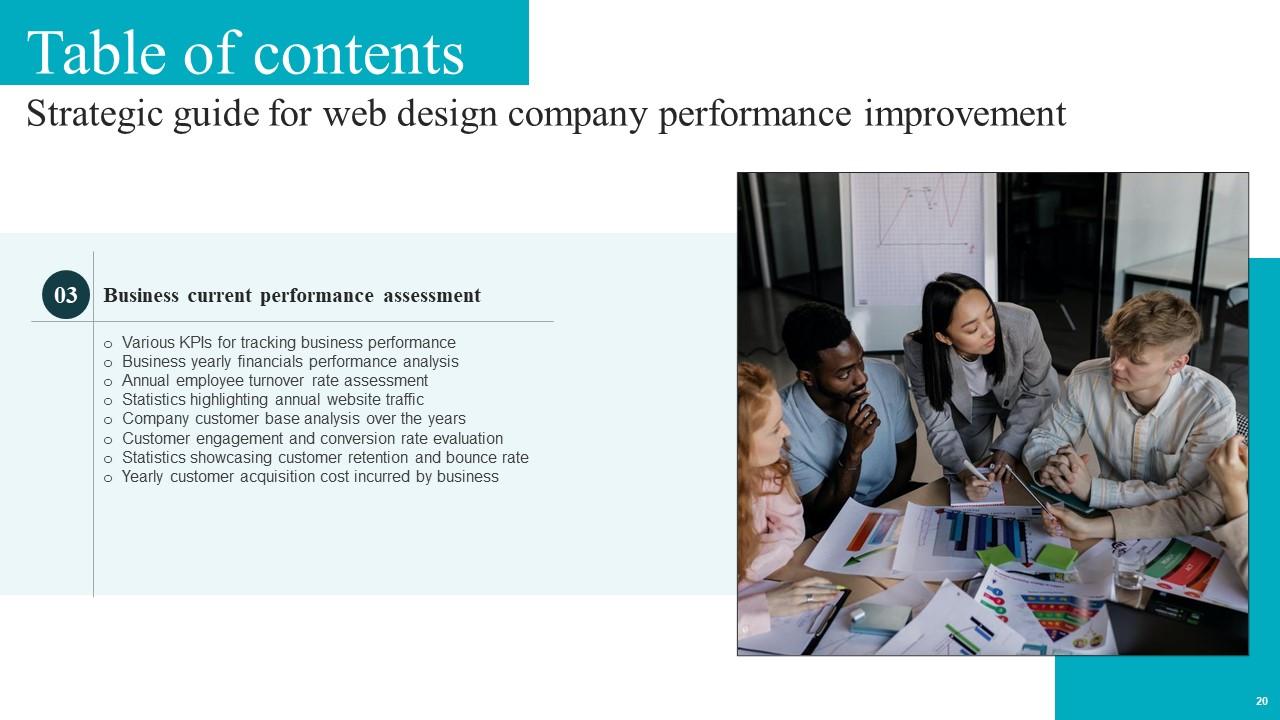
Slide 20: This slide exhibit Table of Content: Business current performance assessment.
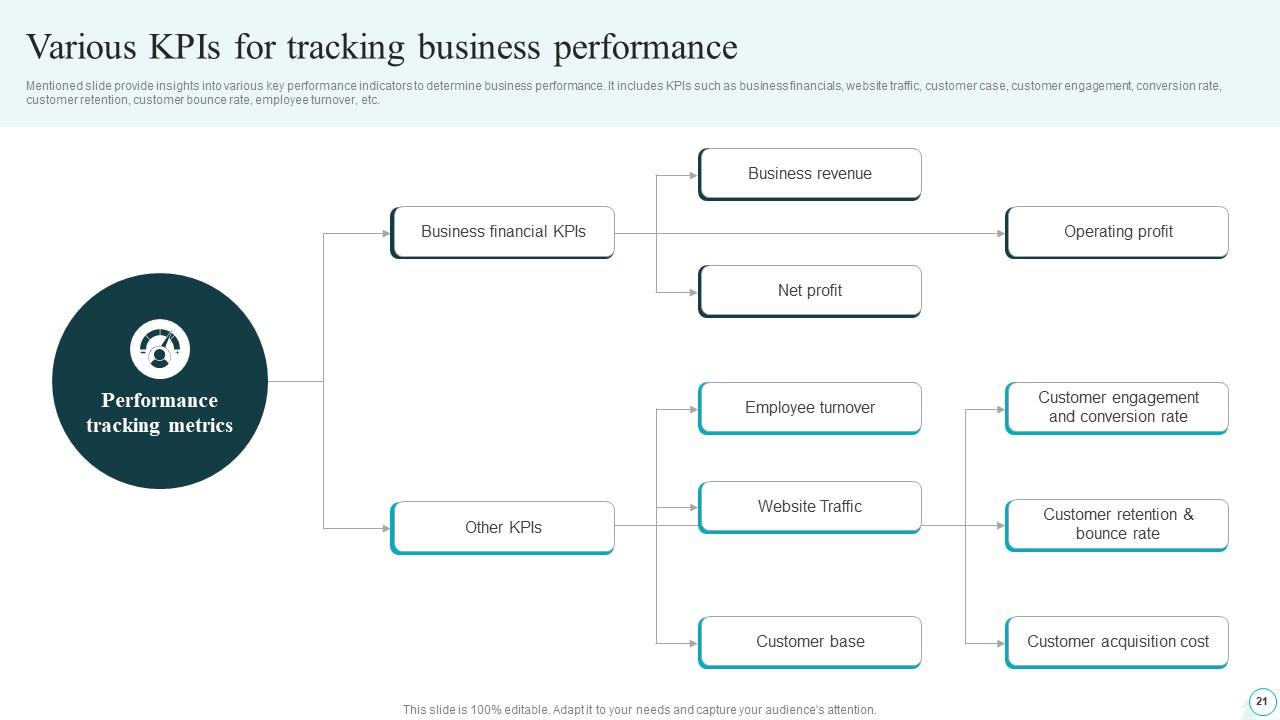
Slide 21: This slide provide insights into various key performance indicators to determine business performance.
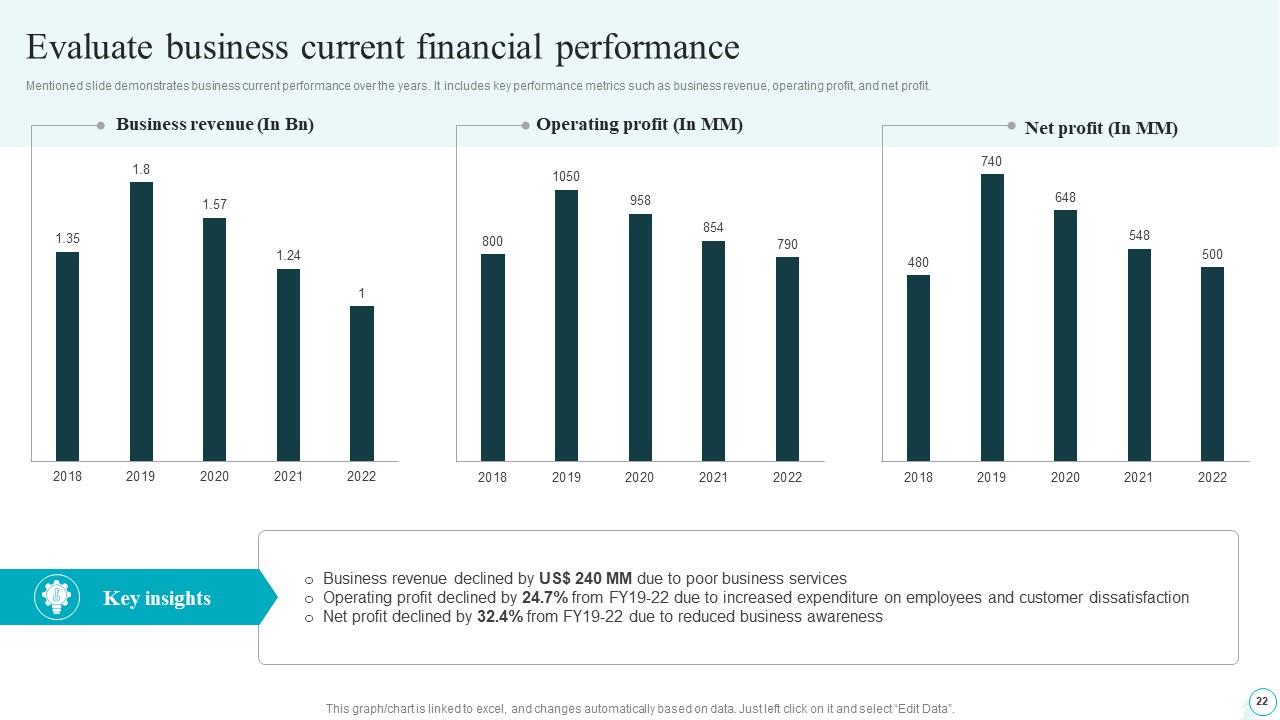
Slide 22: This slide demonstrates business current performance over the years.
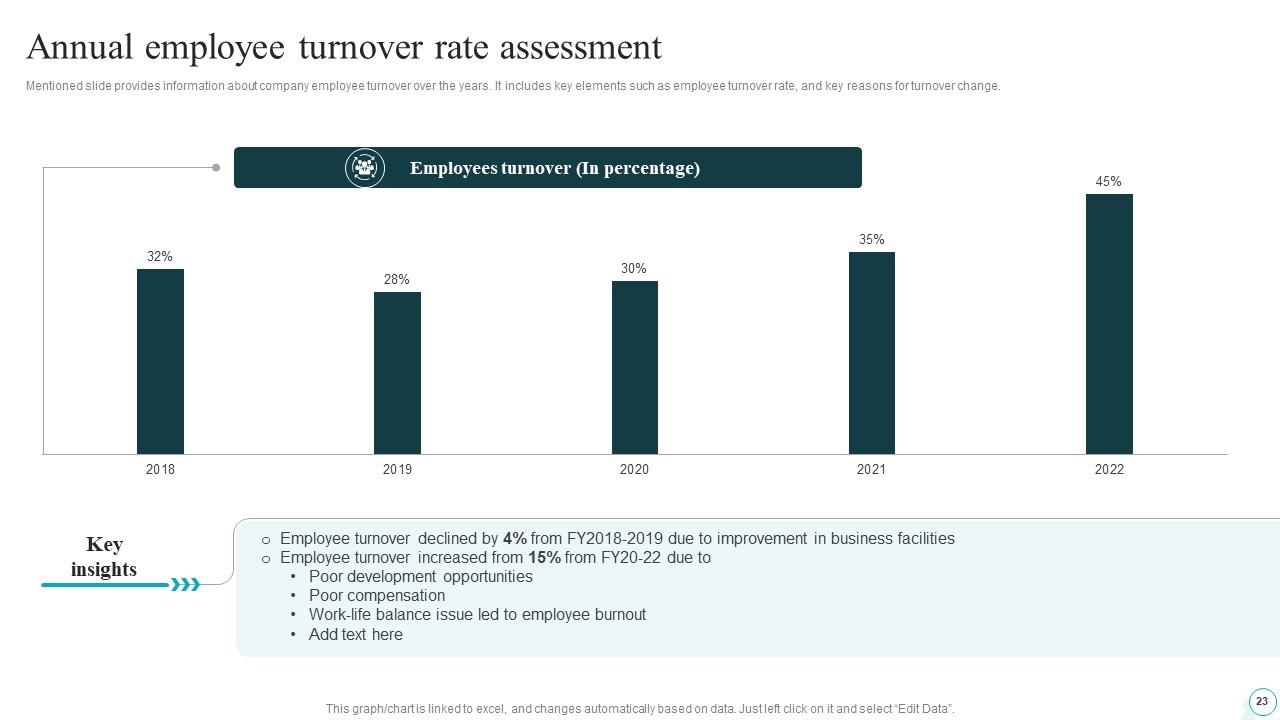
Slide 23: This slide provides information about company employee turnover over the years.
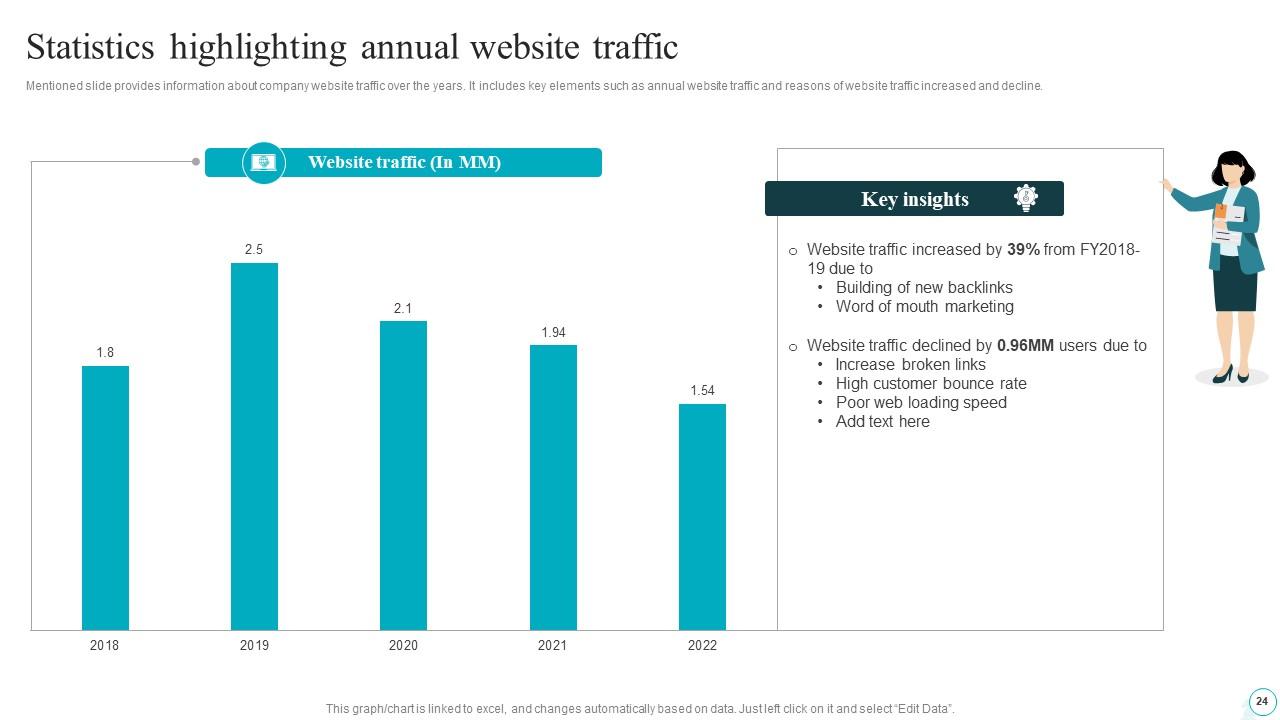
Slide 24: This slide provides information about company website traffic over the years.
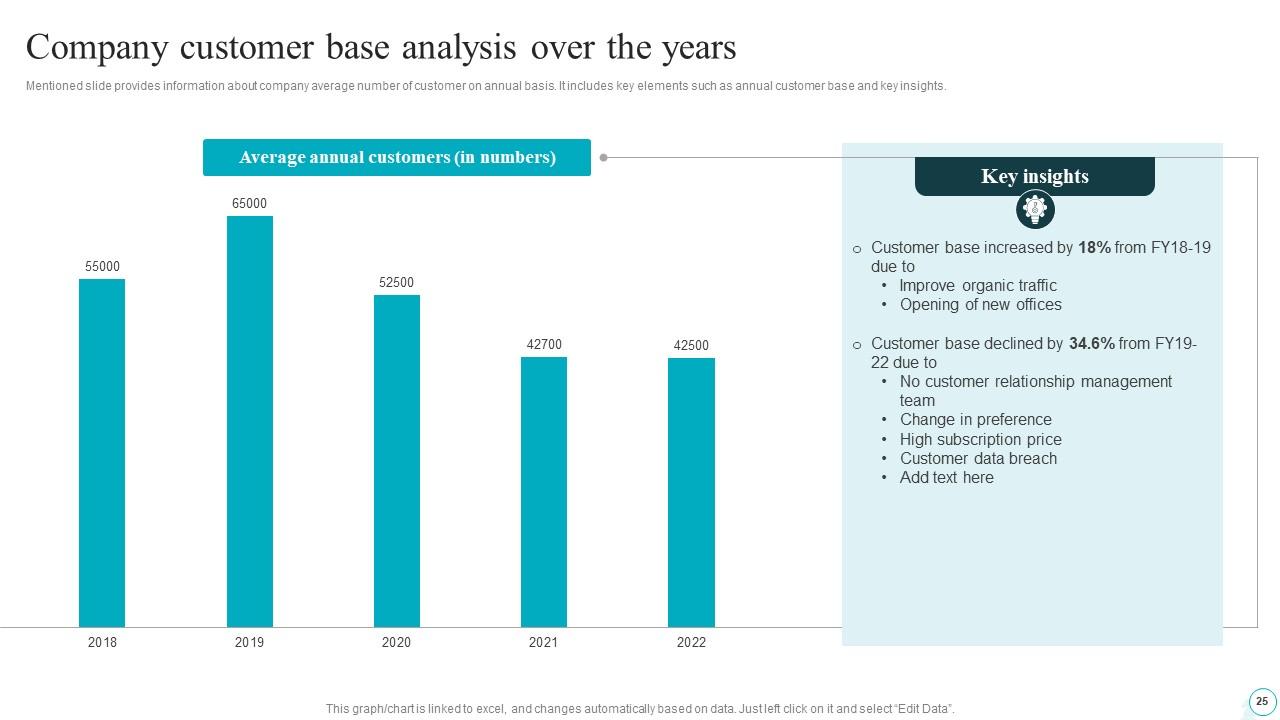
Slide 25: This slide provides information about company average number of customer on annual basis.
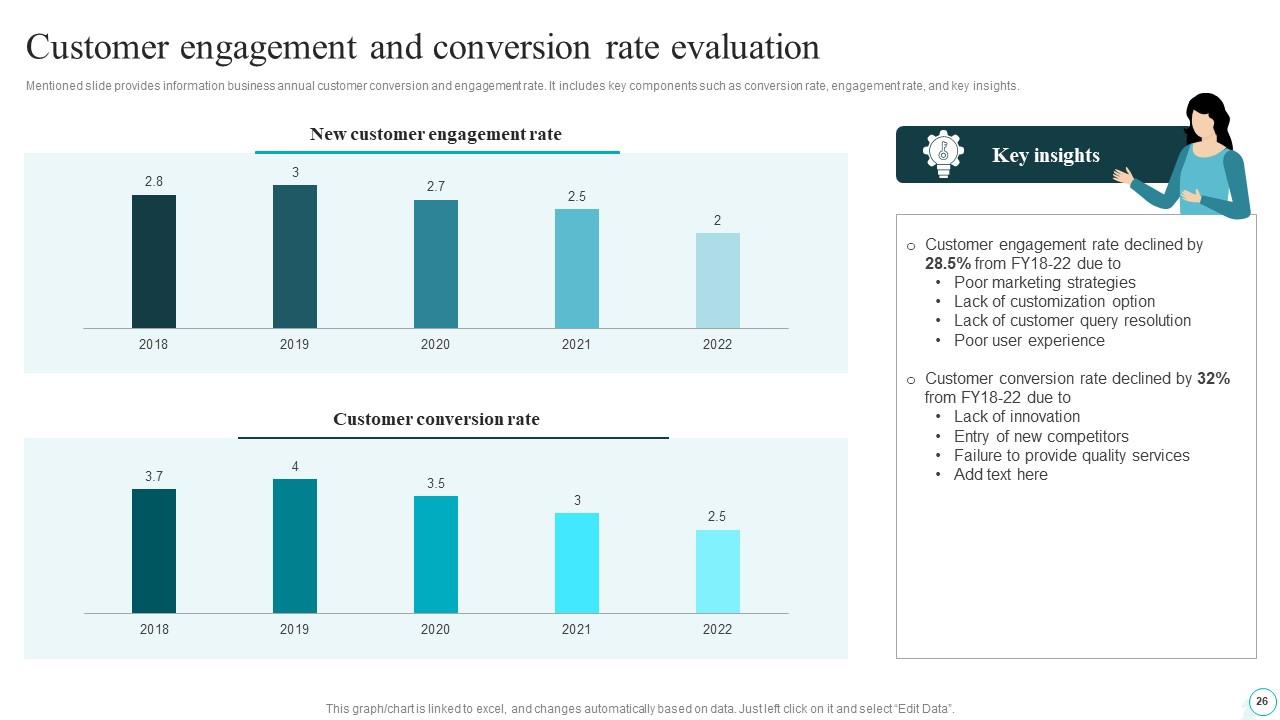
Slide 26: This slide provides information business annual customer conversion and engagement rate.
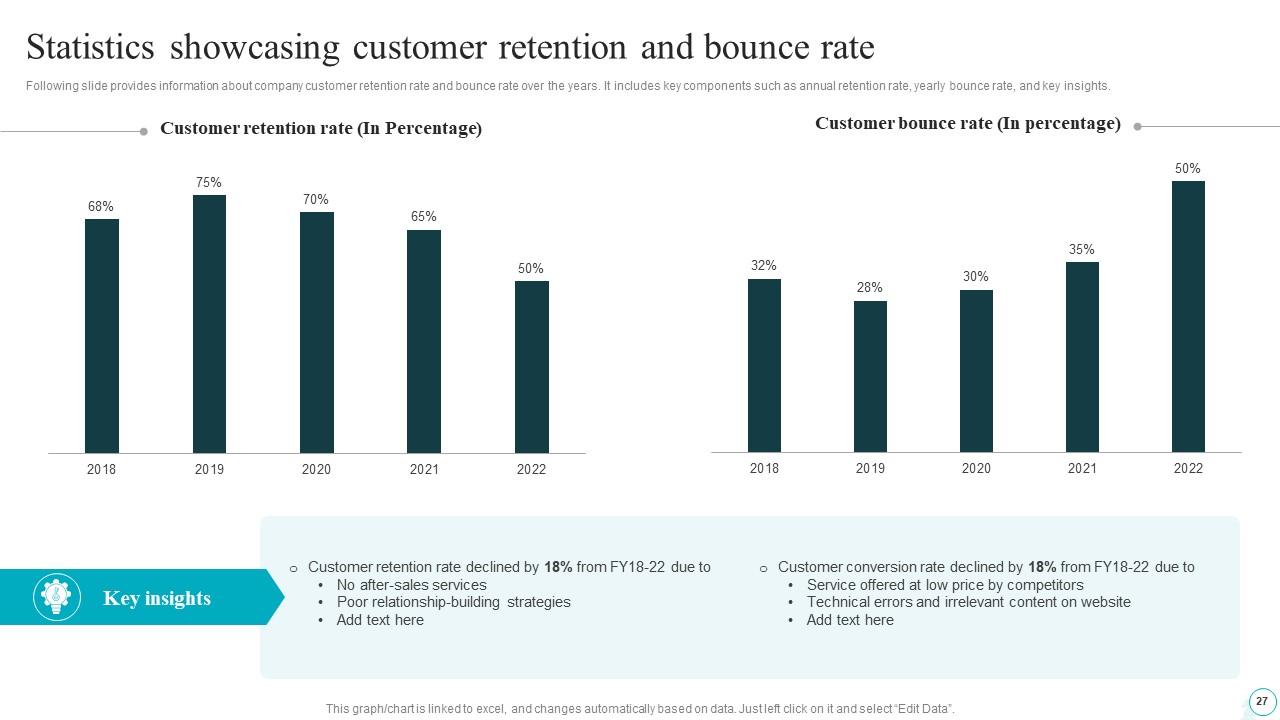
Slide 27: This slide provides information about company customer retention rate and bounce rate over the years.
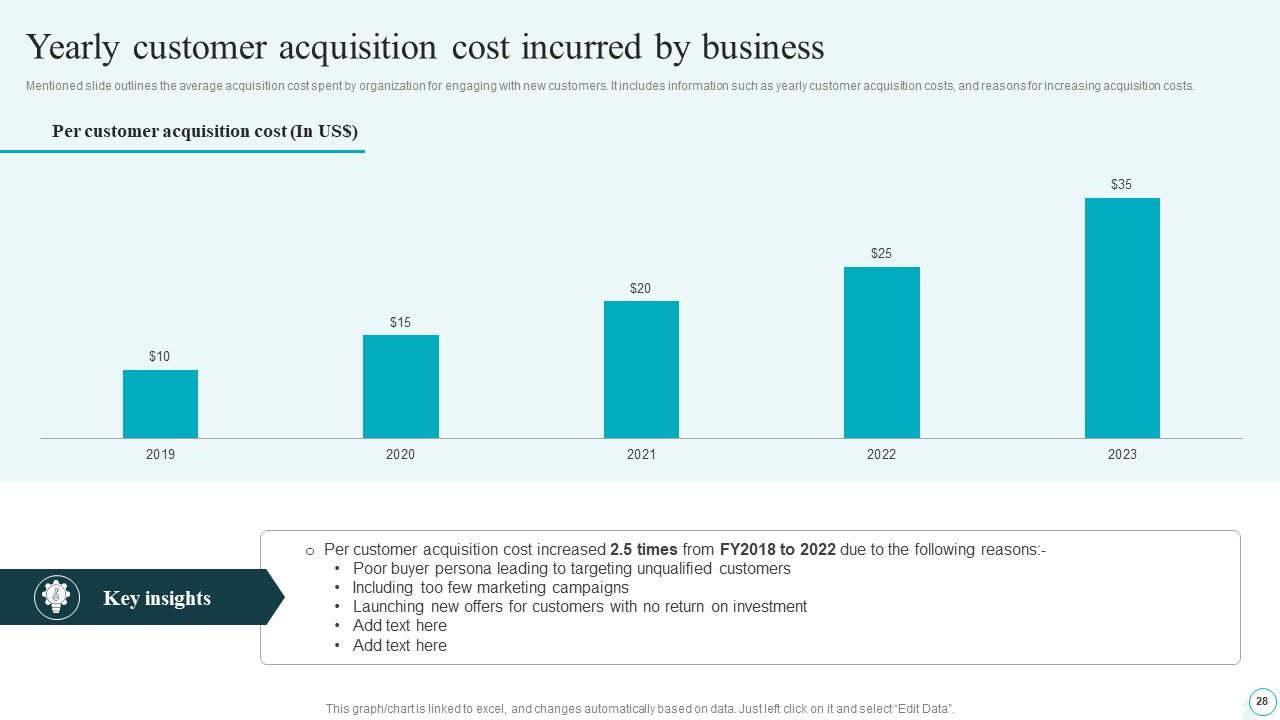
Slide 28: This slide outlines the average acquisition cost spent by organization for engaging with new customers.
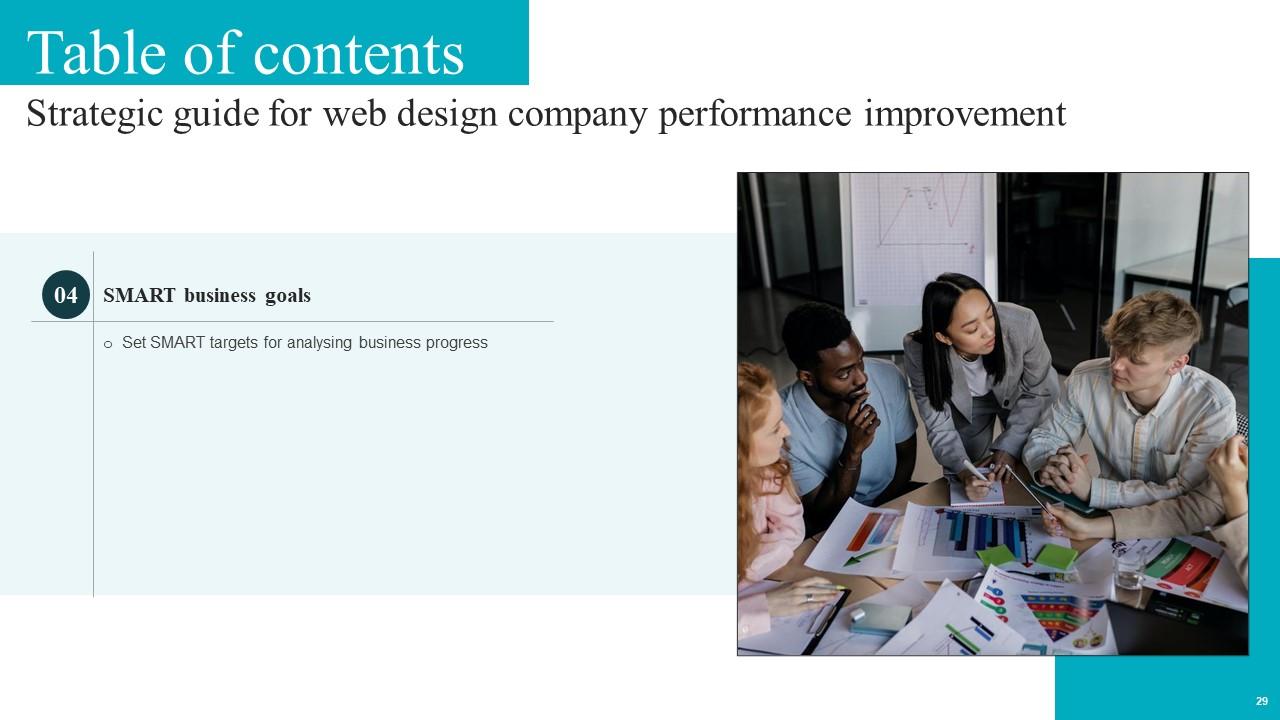
Slide 29: This slide exhibit Table of Content: SMART business goals.
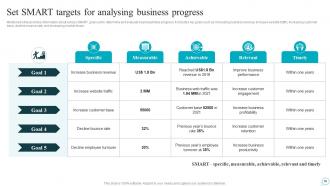
Slide 30: This slide provides information about various SMART goals set to determine and evaluate business future progress.
Slide 31: This slide exhibit Table of Content: Reasons for declining business performance.
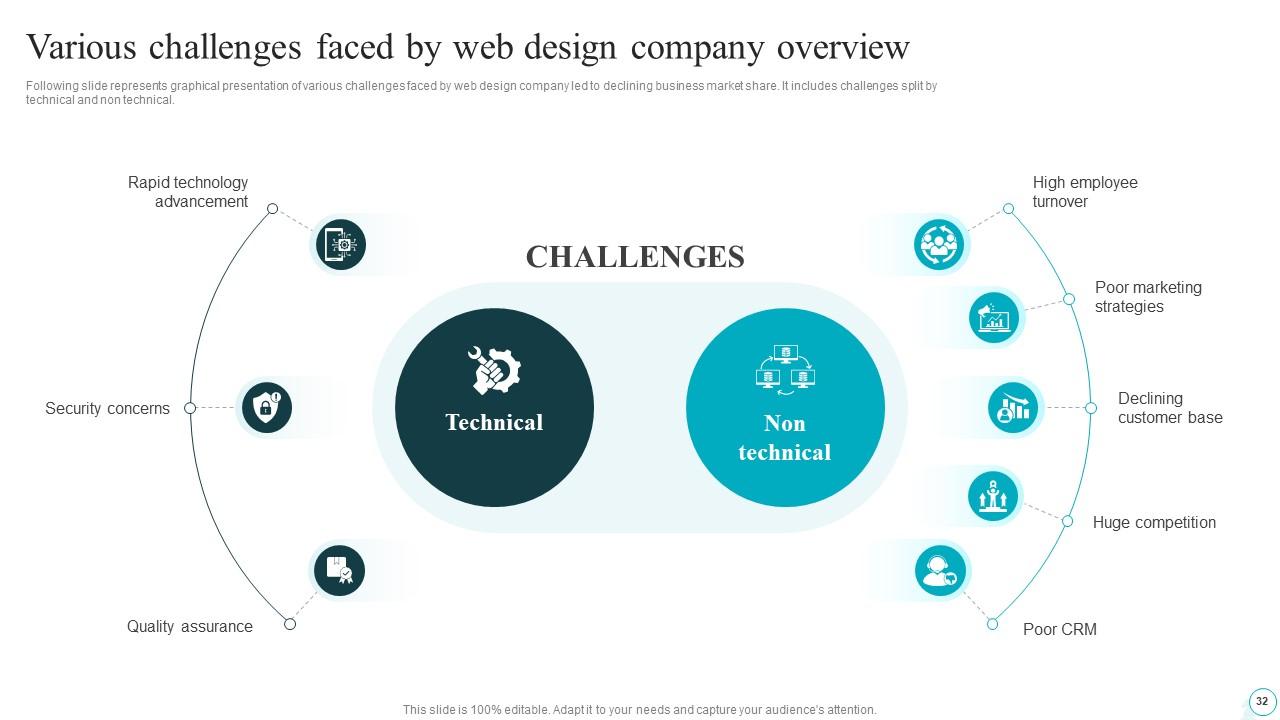
Slide 32: This slide represents graphical presentation of various challenges faced by web design company led to declining business market share.
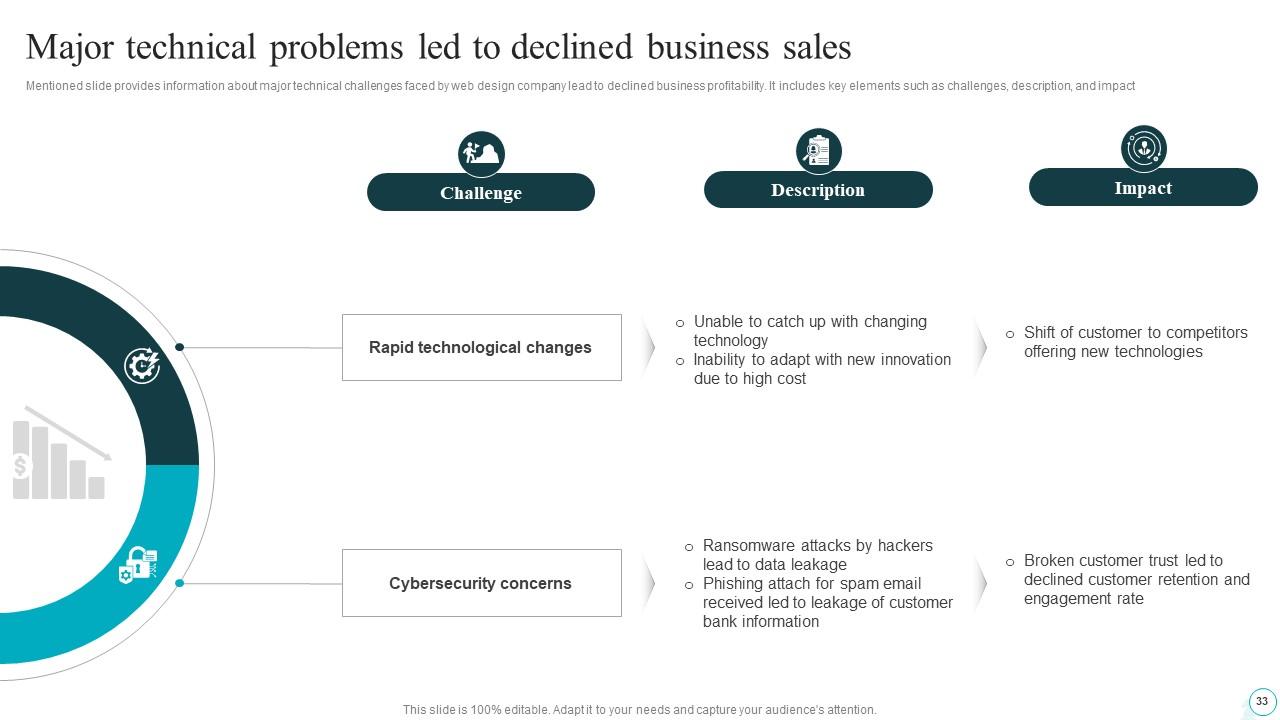
Slide 33: This slide provides information about major technical challenges faced by web design company lead to declined business profitability.
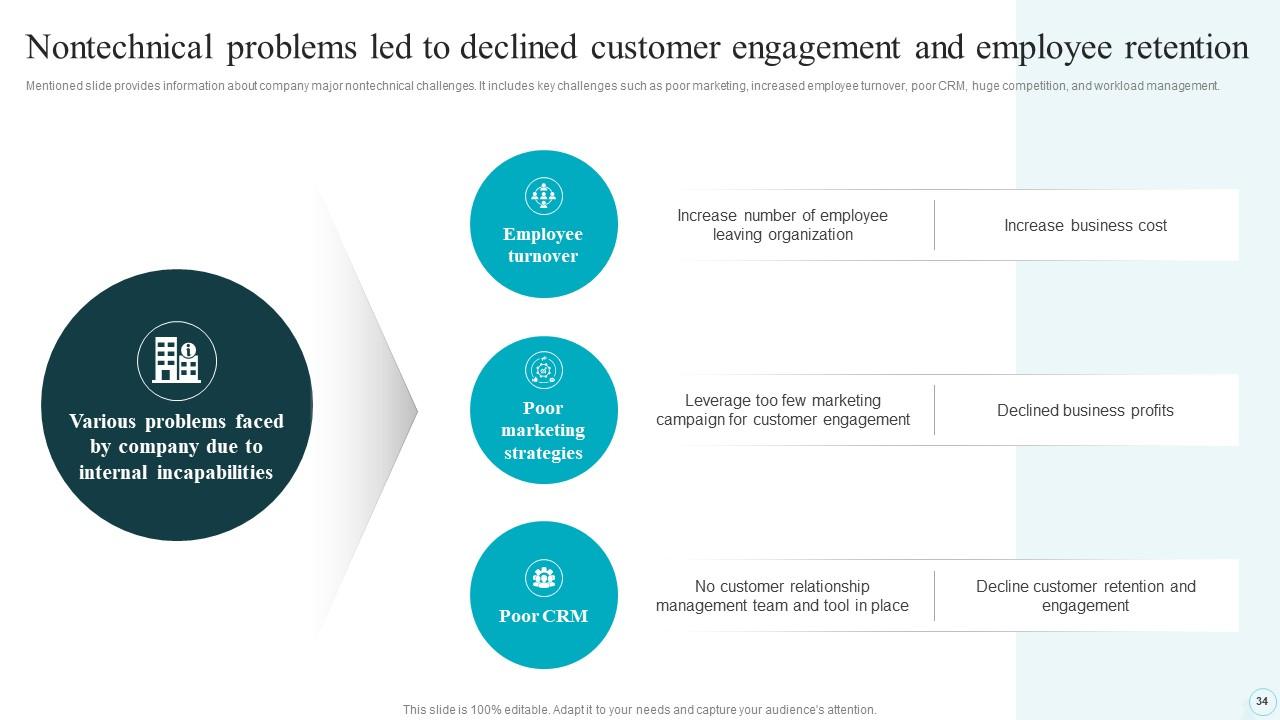
Slide 34: This slide provides information about company major nontechnical challenges.
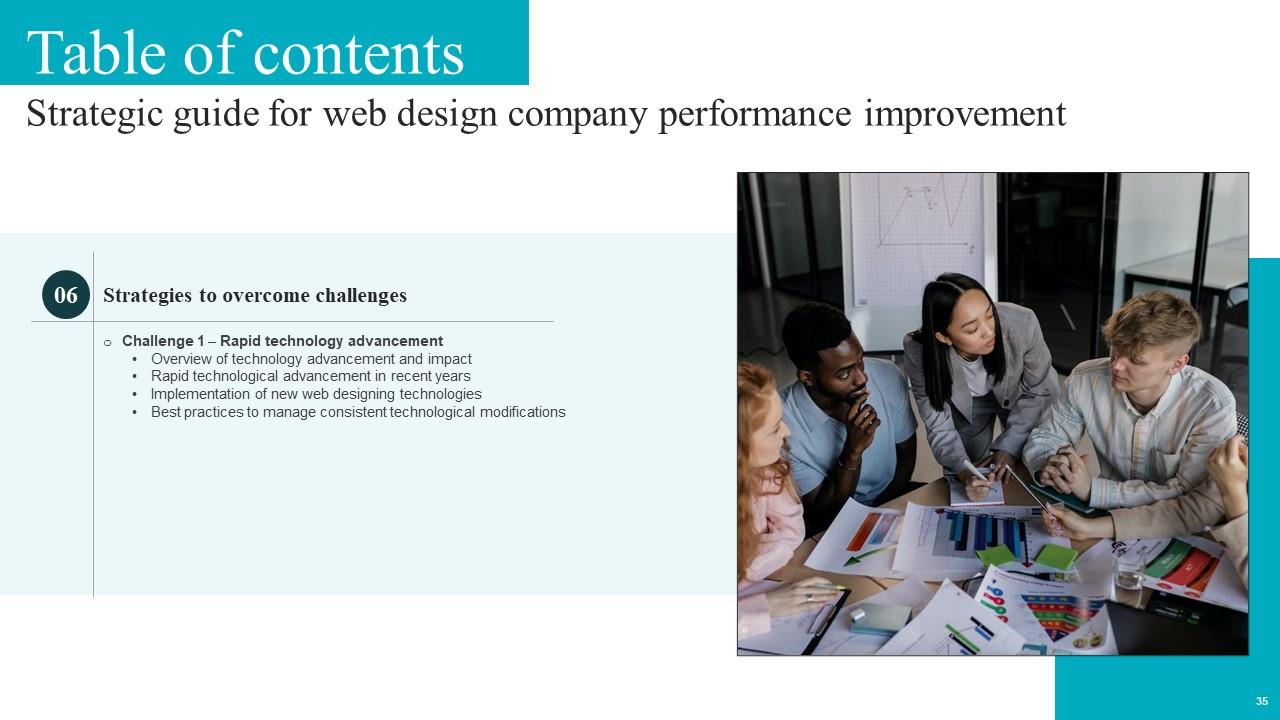
Slide 35: This slide exhibit Table of Content: Challenge 1 – Rapid technology advancement.
Slide 36: This slide provides overview of technological advancement challenge faced by web design company.
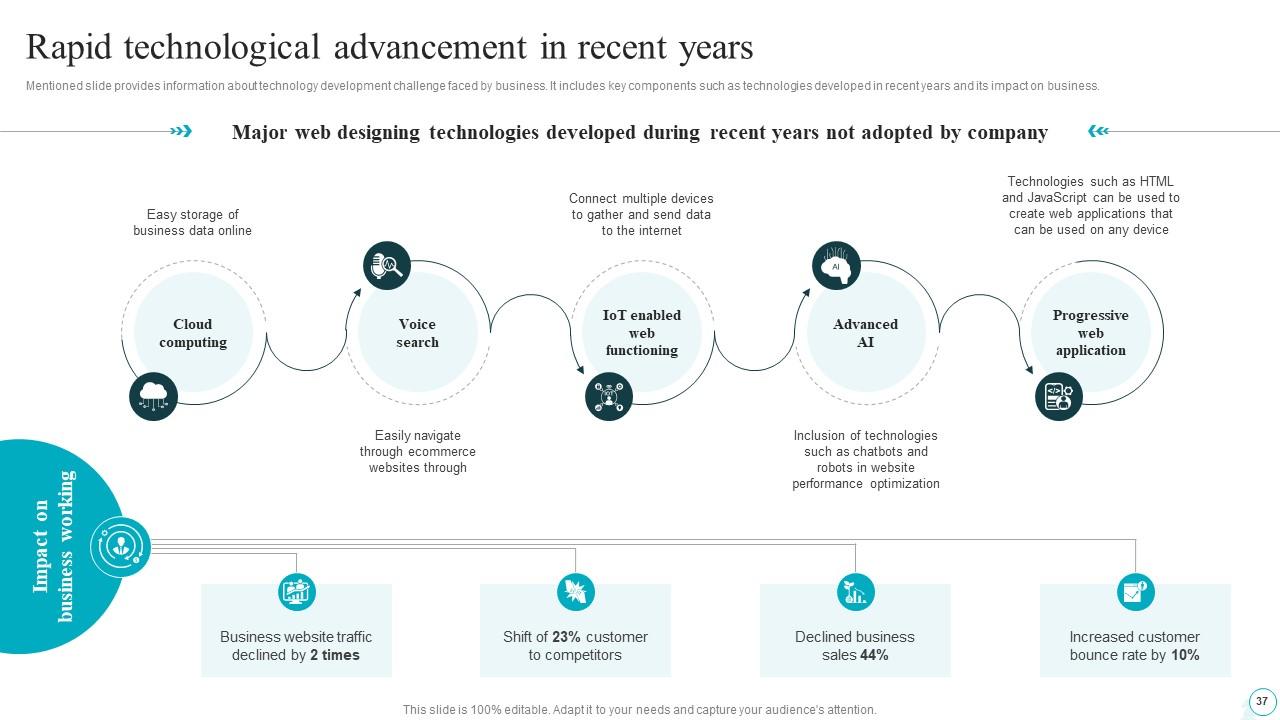
Slide 37: This slide provides information about technology development challenge faced by business.
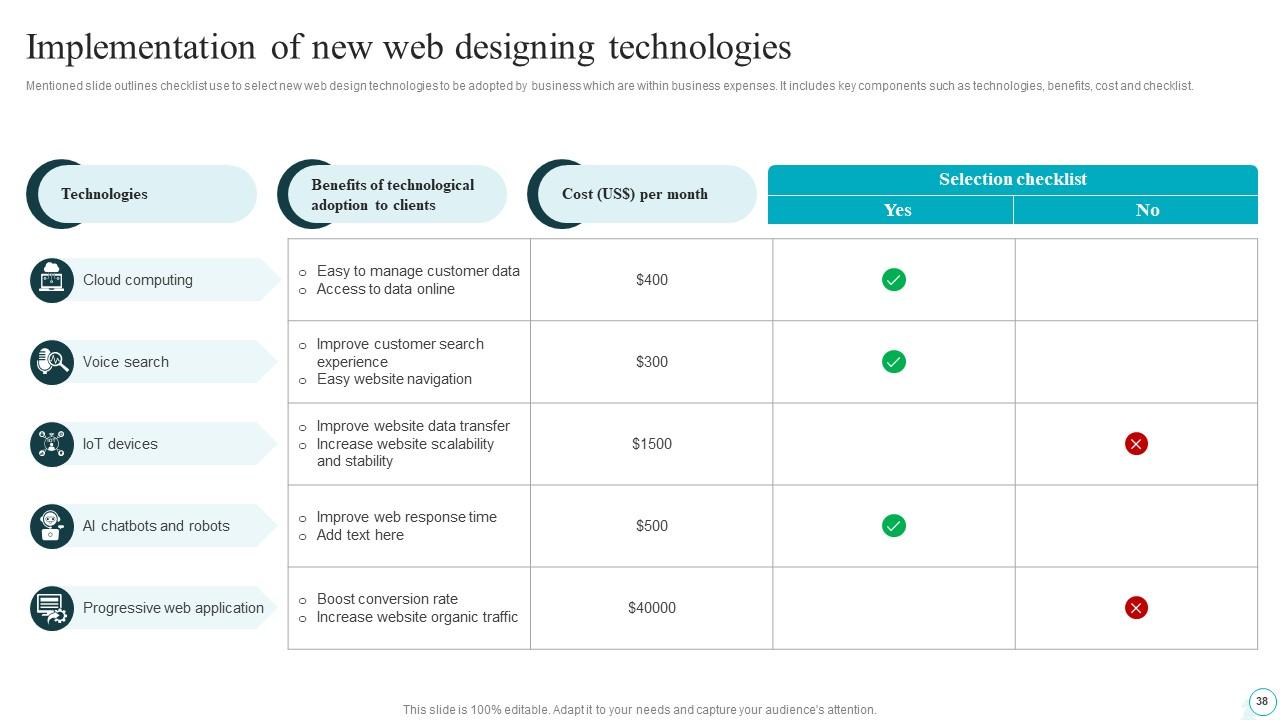
Slide 38: This slide outlines checklist use to select new web design technologies to be adopted by business which are within business expenses.
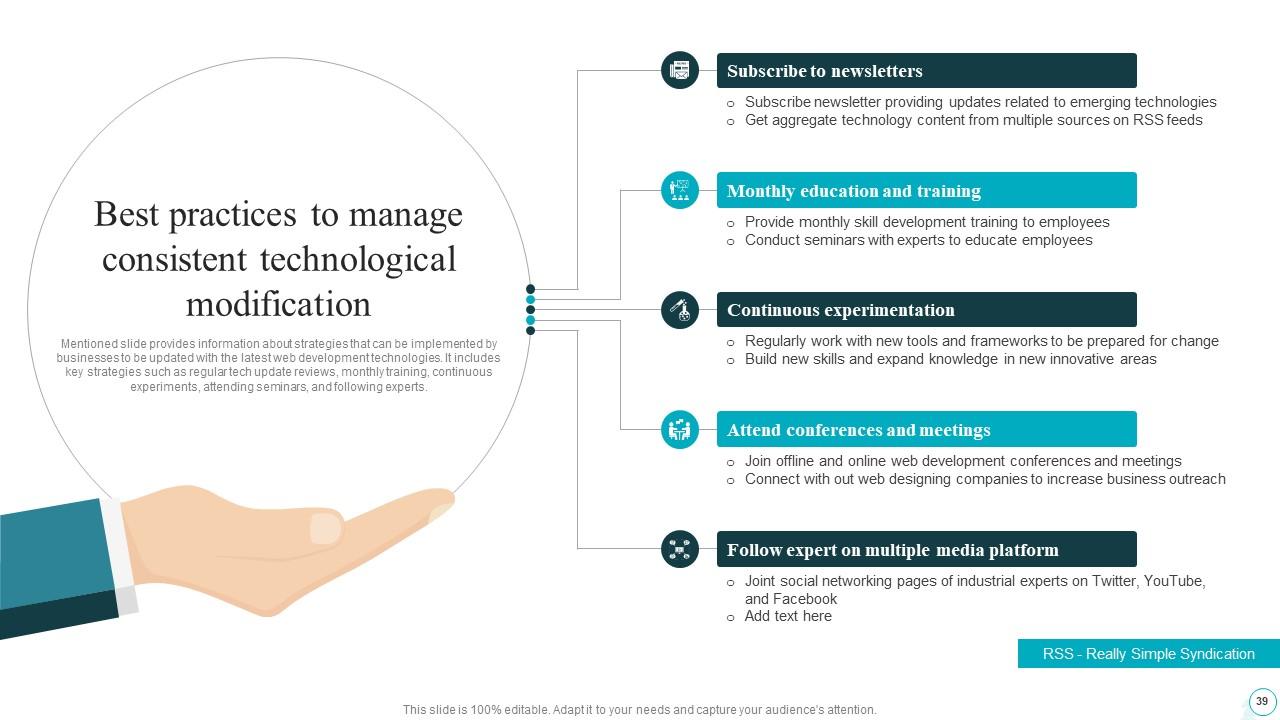
Slide 39: This slide provides information about strategies that can be implemented by businesses to be updated with the latest web development technologies.
Slide 40: This slide exhibit Table of Content: Challenge 2 – Security Issues.
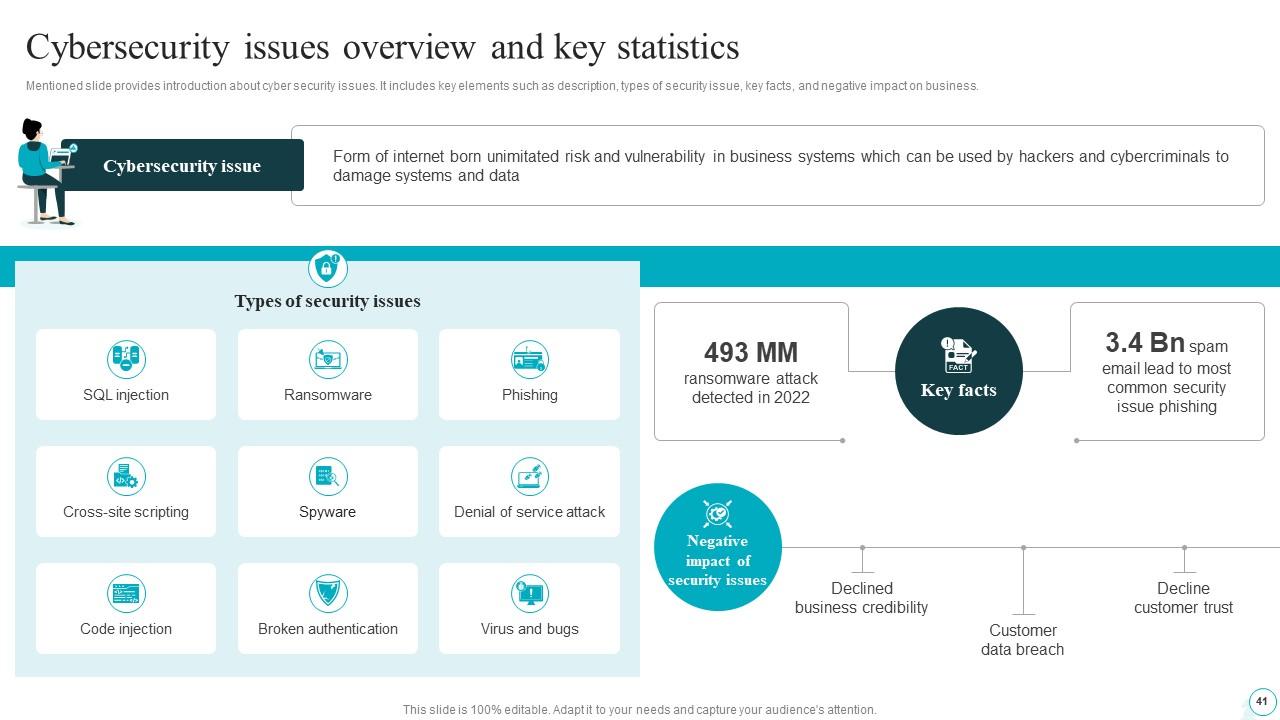
Slide 41: This slide provides introduction about cyber security issues.
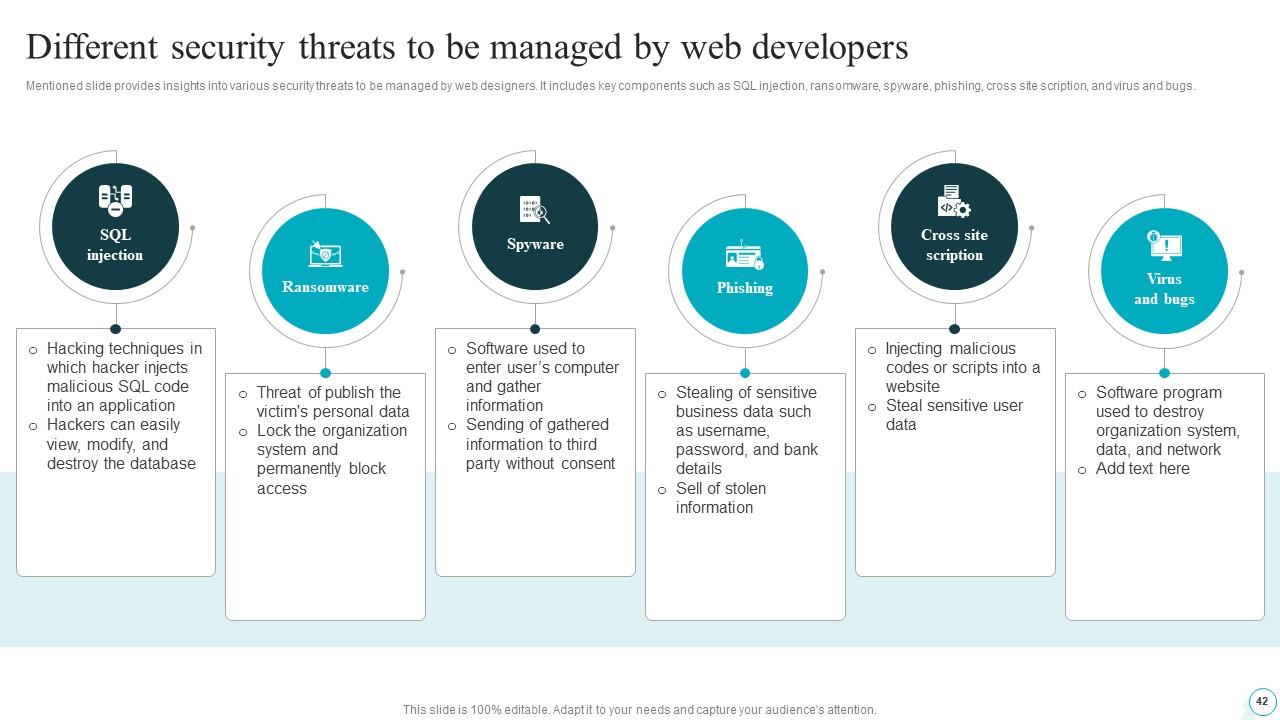
Slide 42: This slide provides insights into various security threats to be managed by web designers.
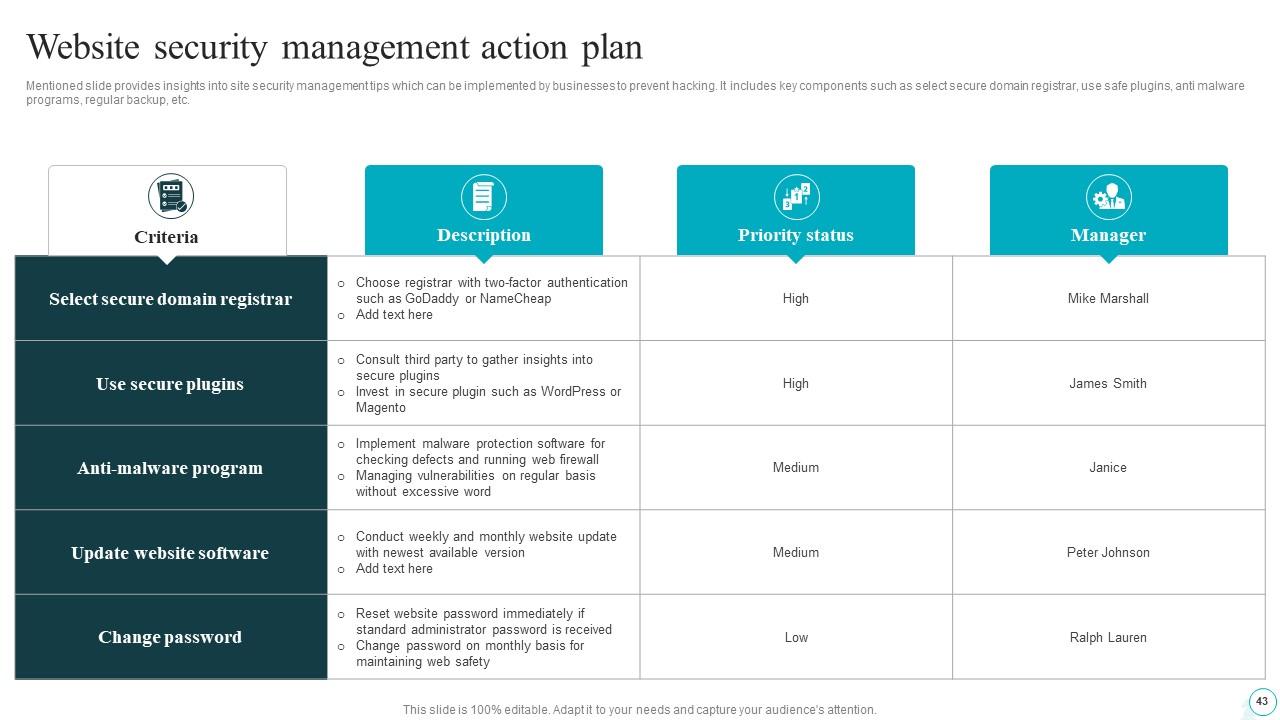
Slide 43: This slide provides insights into site security management tips which can be implemented by businesses to prevent hacking.
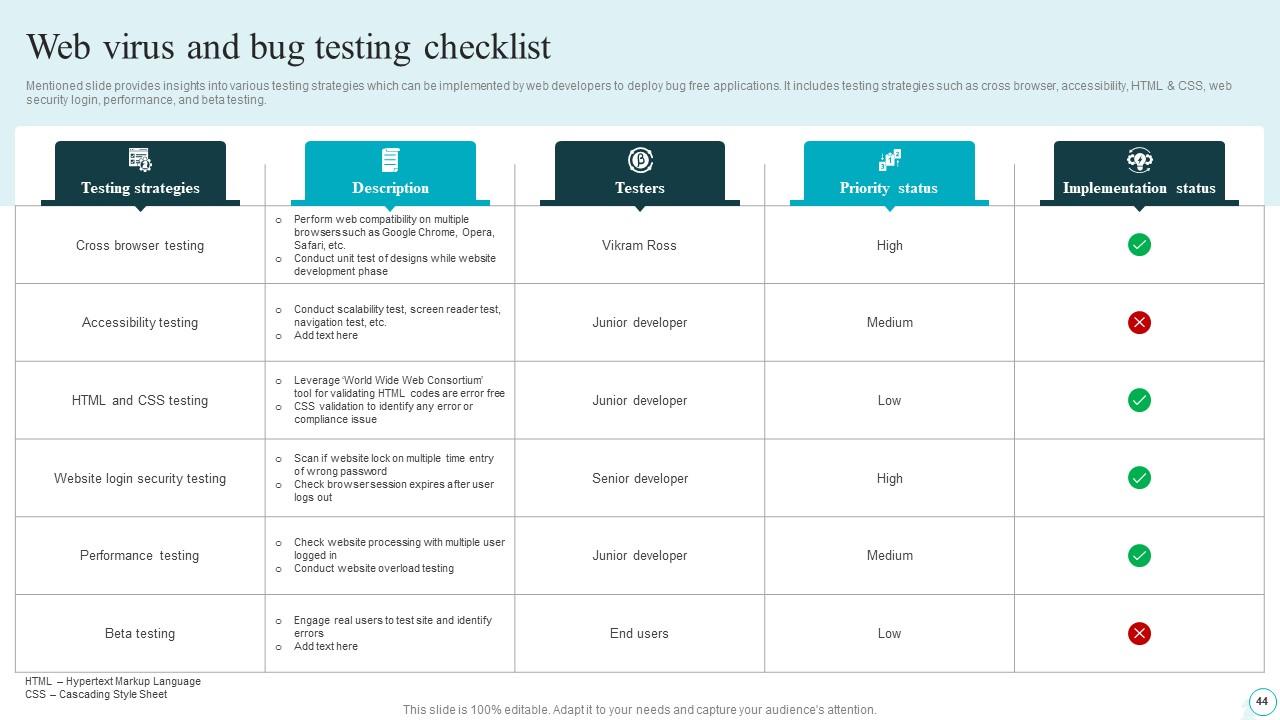
Slide 44: This slide provides insights into various testing strategies which can be implemented by web developers to deploy bug free applications.
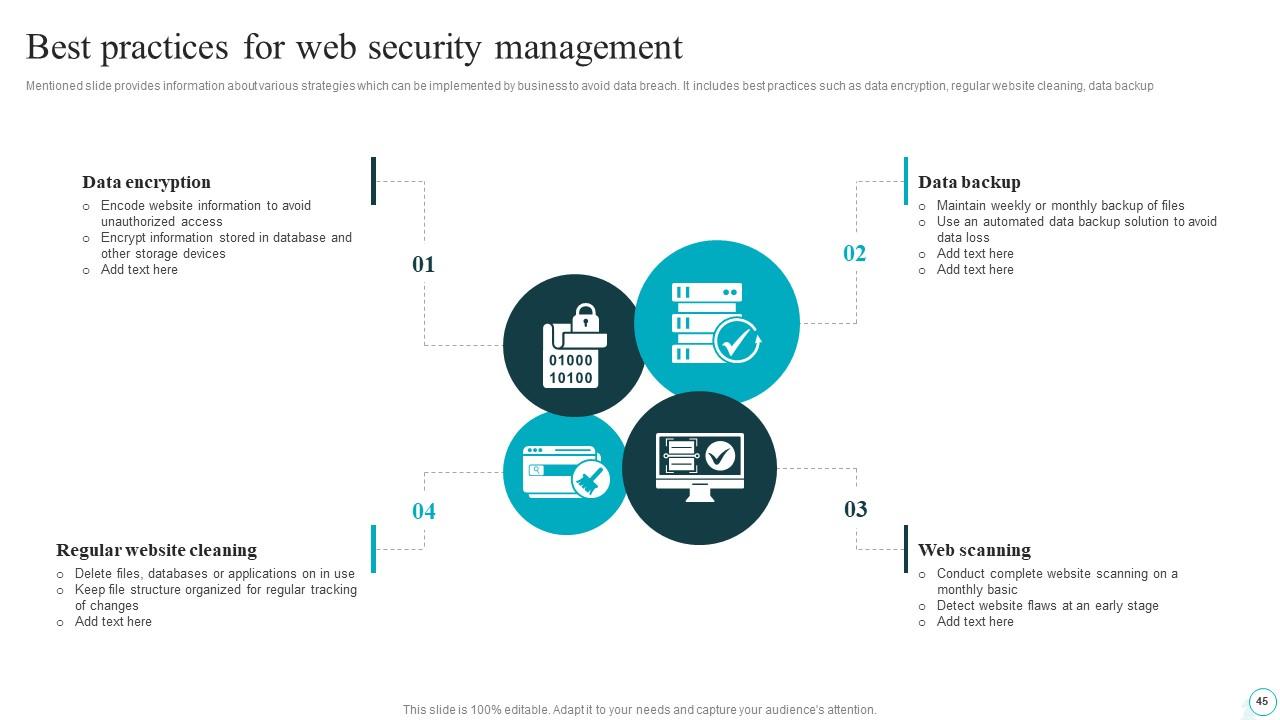
Slide 45: This slide provides information about various strategies which can be implemented by business to avoid data breach.
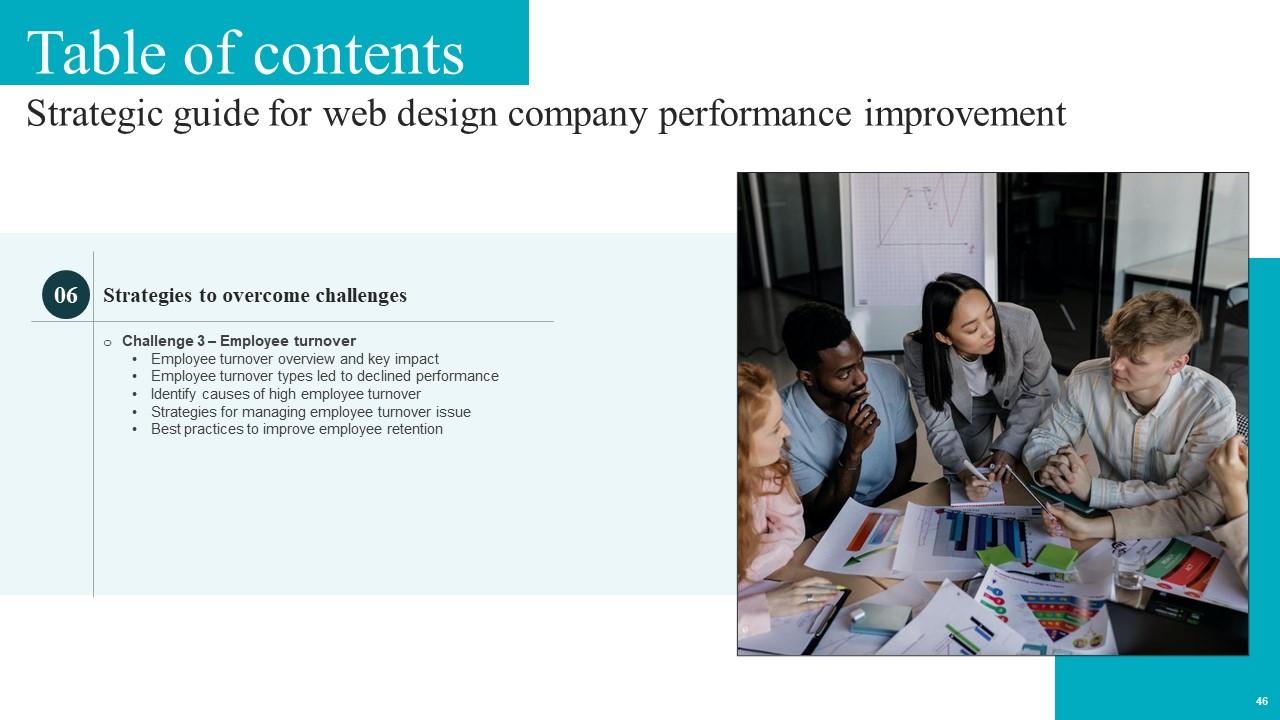
Slide 46: This slide exhibit Table of Content: Challenge 3 – Employee turnover.
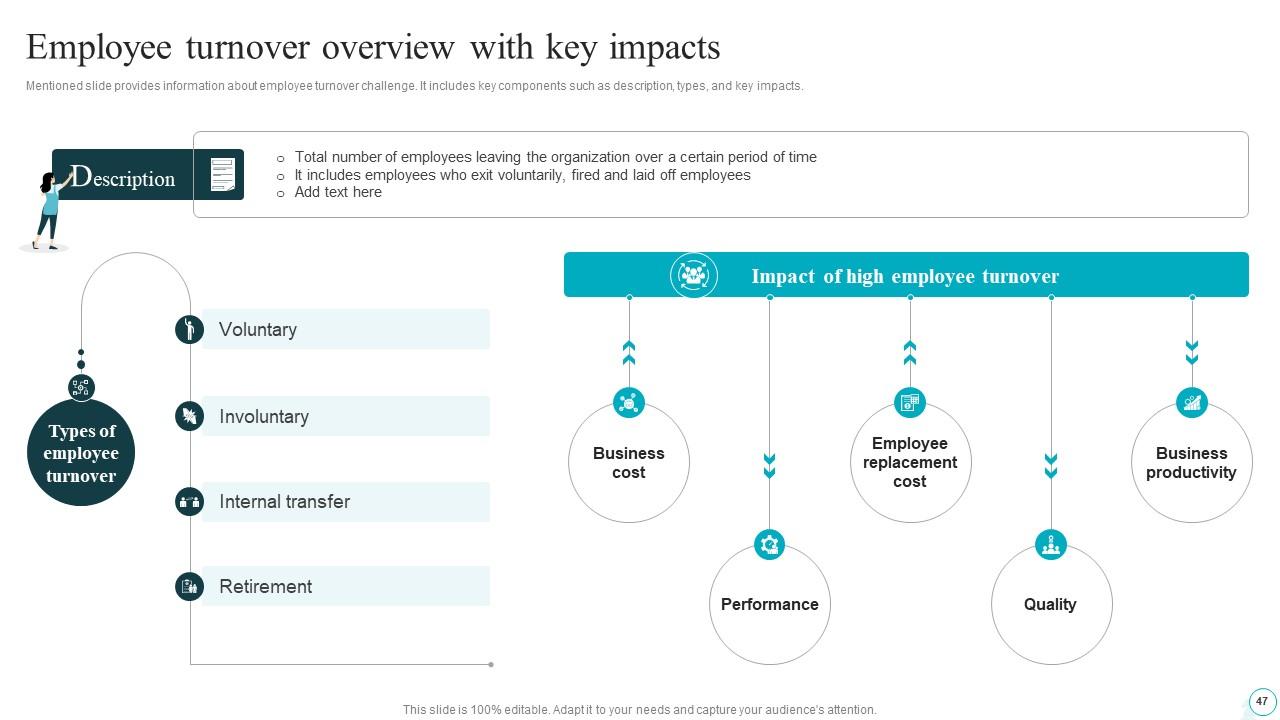
Slide 47: This slide provides information about employee turnover challenge. It includes key components such as description, types, and key impacts.
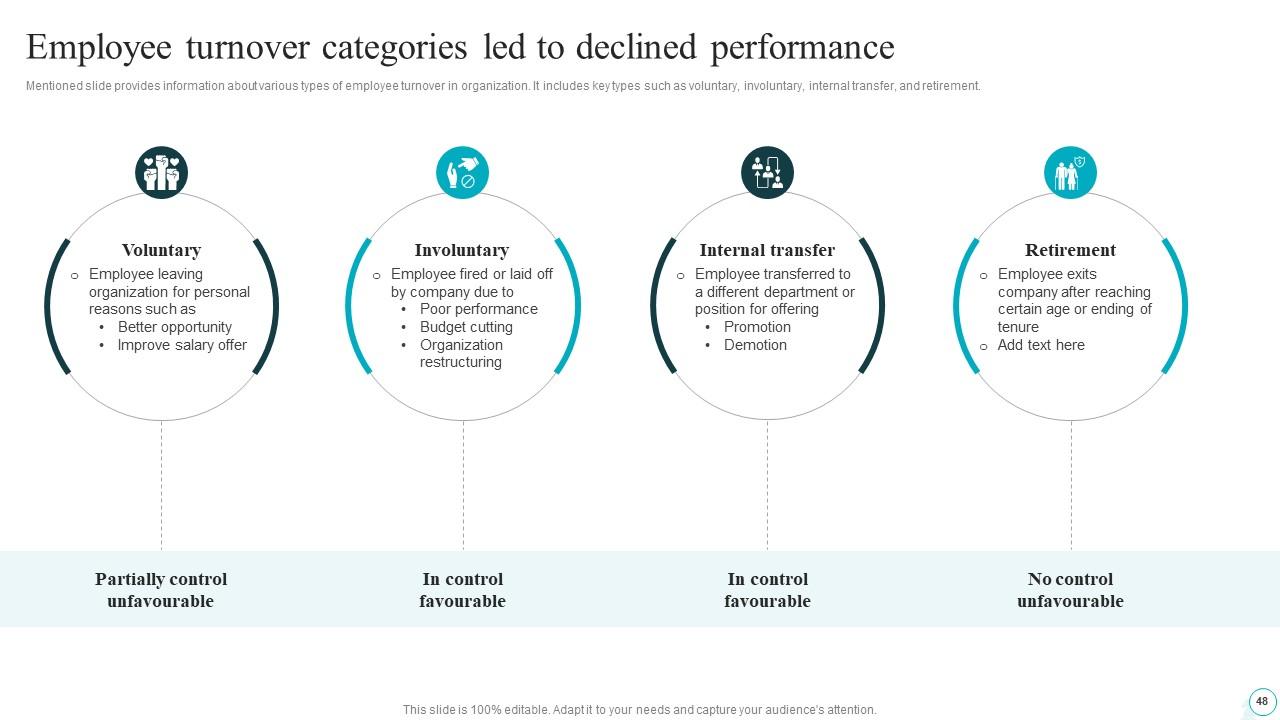
Slide 48: This slide provides information about various types of employee turnover in organization.
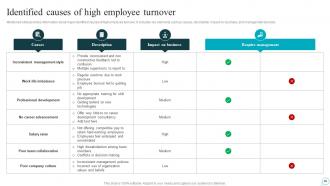
Slide 49: This slide provides information about major identified causes of high employee turnover.
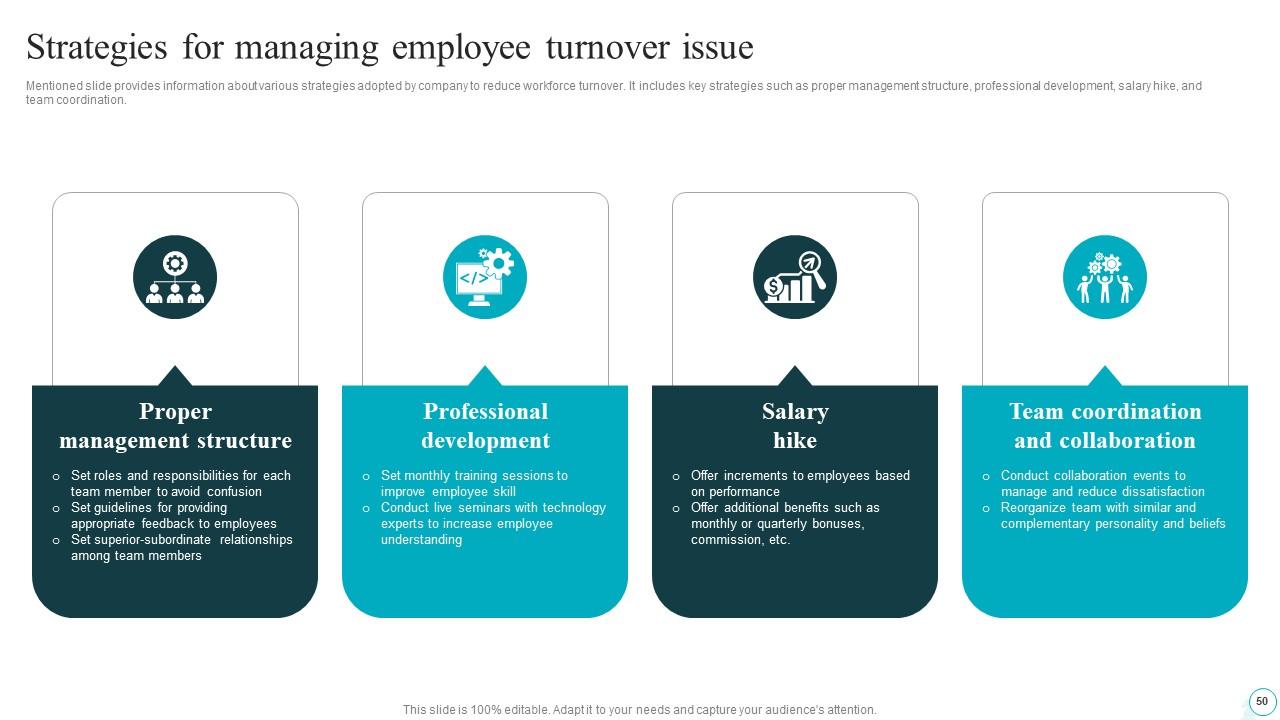
Slide 50: This slide provides information about various strategies adopted by company to reduce workforce turnover.
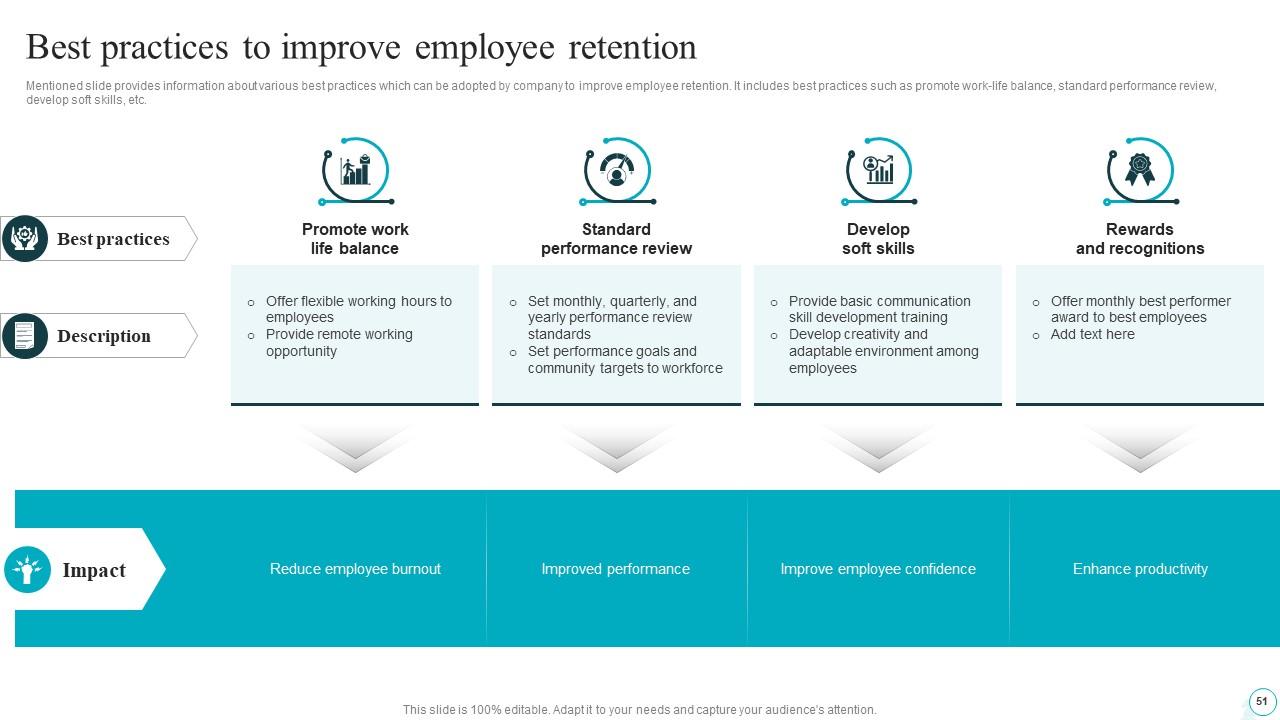
Slide 51: This slide provides information about various best practices which can be adopted by company to improve employee retention.
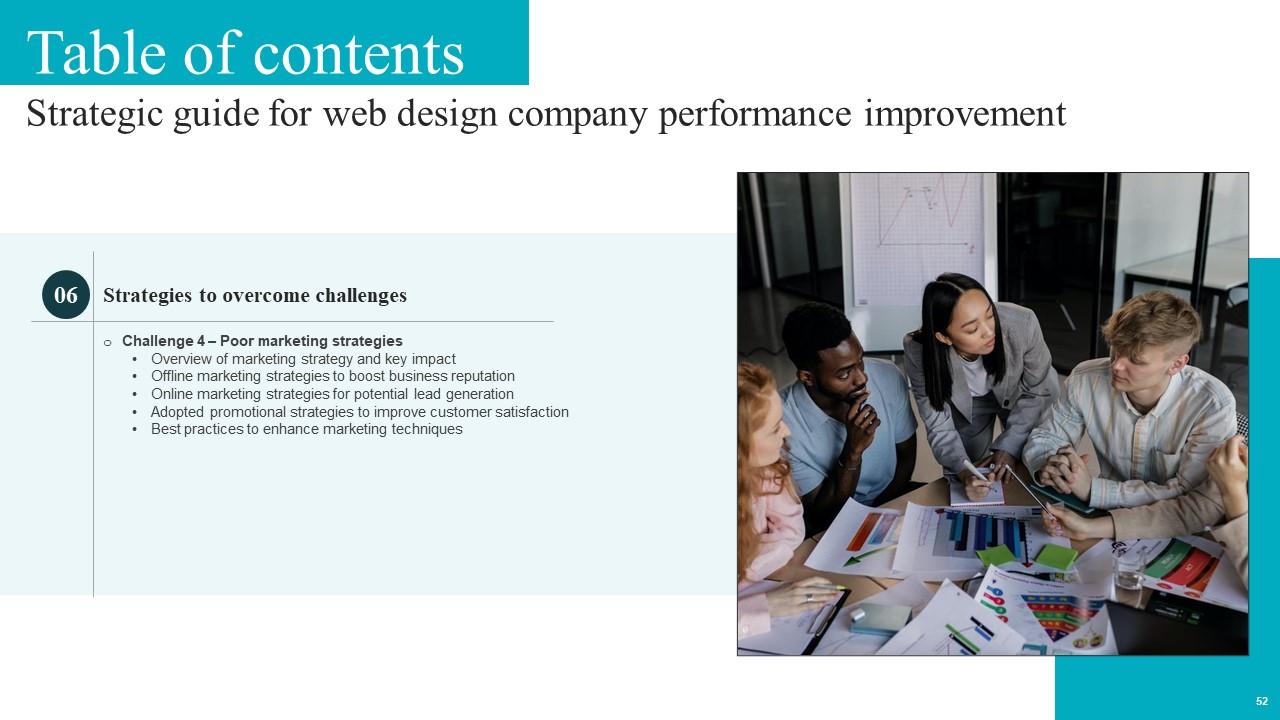
Slide 52: This slide exhibit Table of Content: Challenge 4 – Poor marketing strategies.
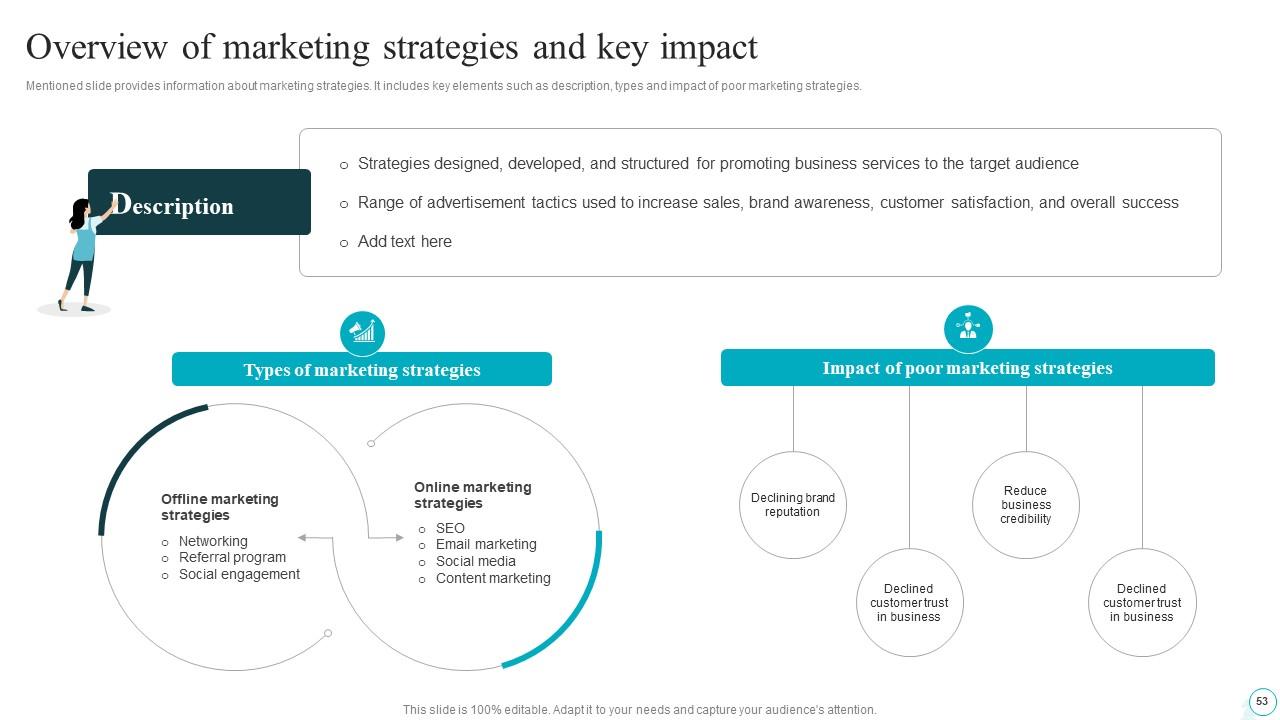
Slide 53: This slide provides information about marketing strategies. It includes key elements such as description, types and impact of poor marketing strategies.
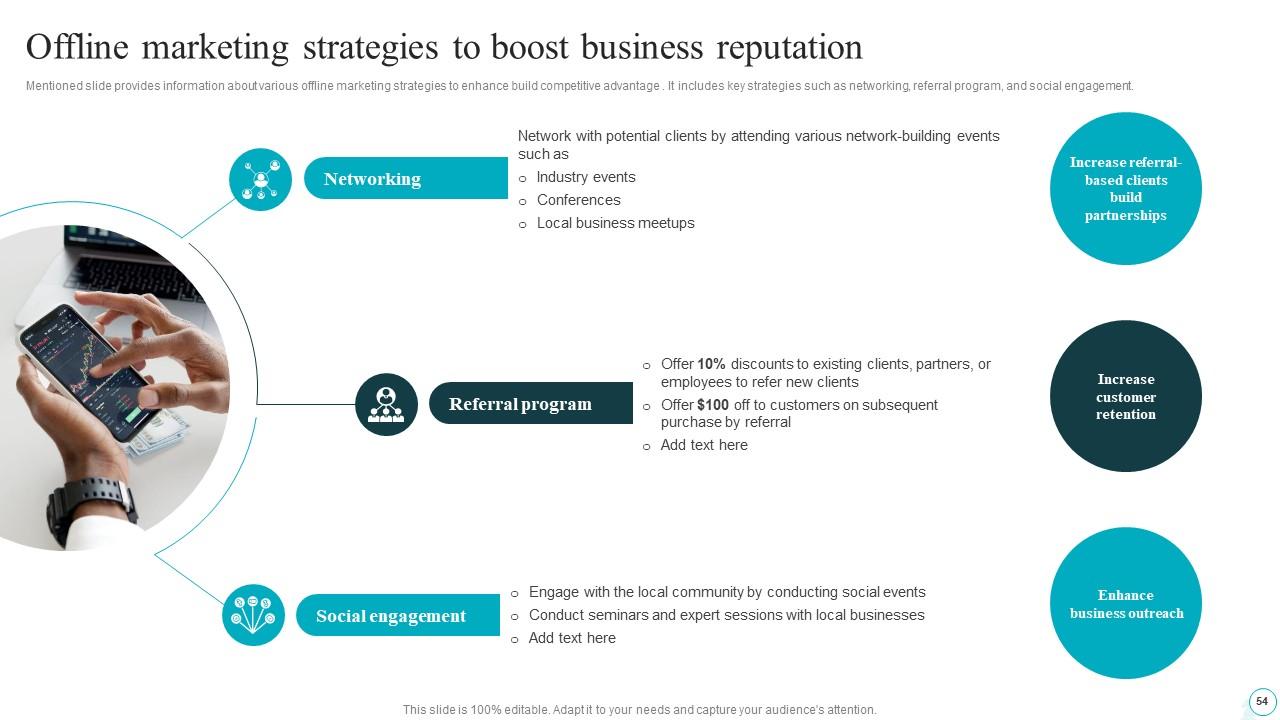
Slide 54: This slide provides information about various offline marketing strategies to enhance build competitive advantage.
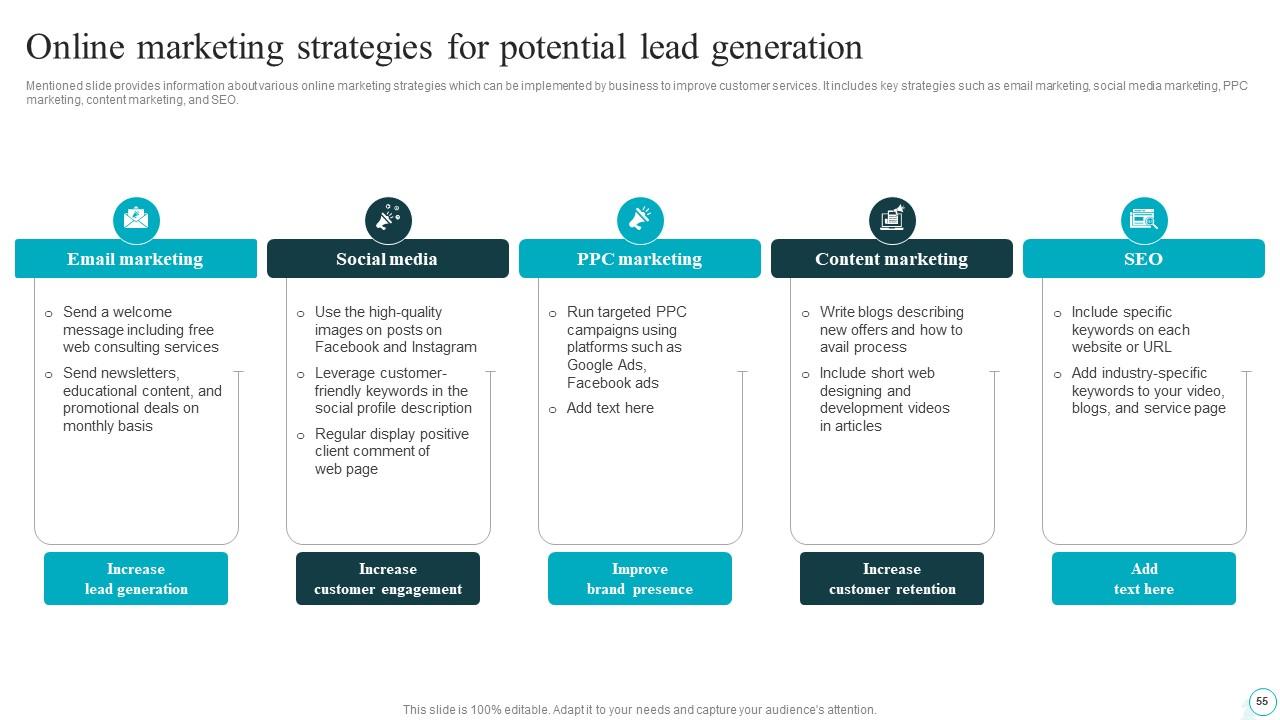
Slide 55: This slide provides information about various online marketing strategies which can be implemented by business to improve customer services.
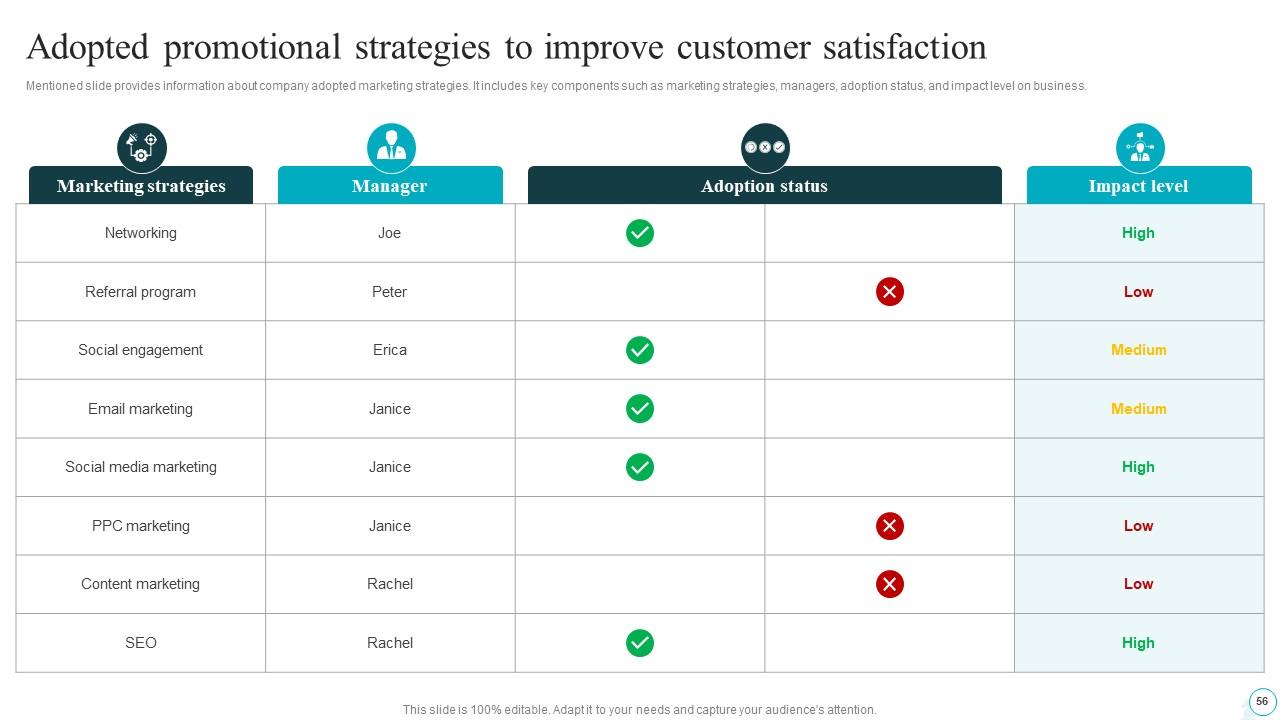
Slide 56: This slide provides information about company adopted marketing strategies.
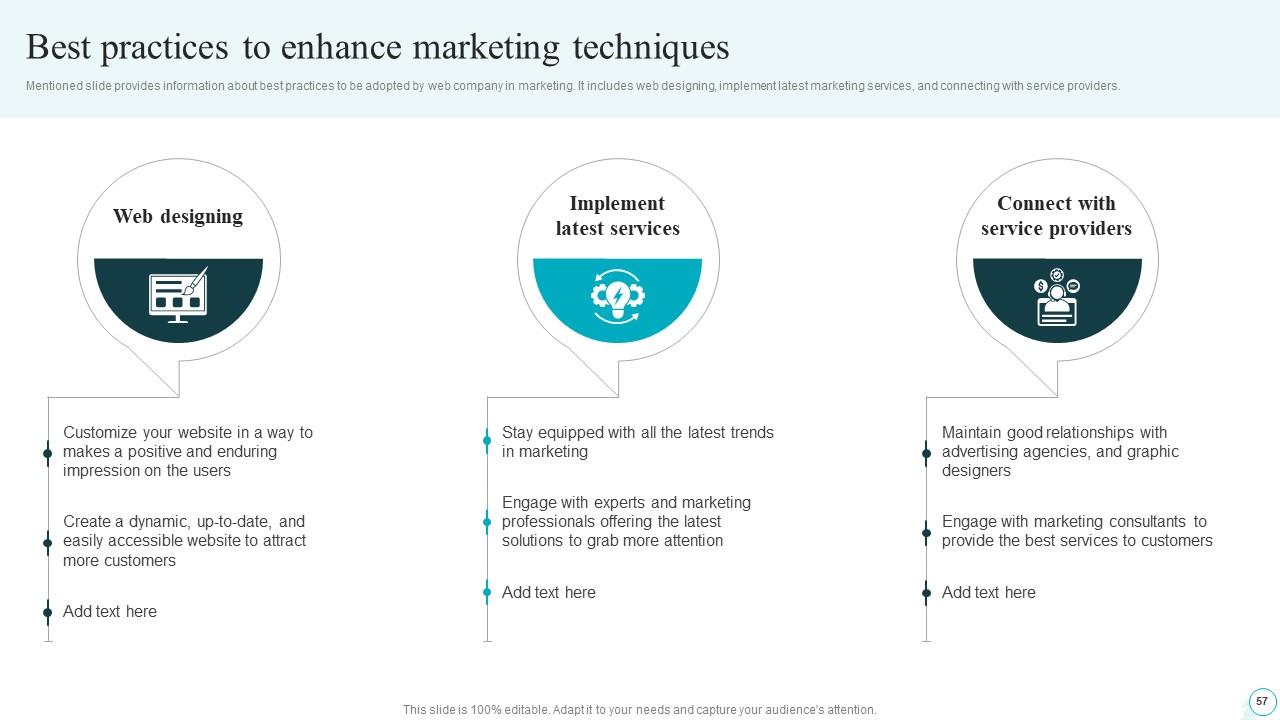
Slide 57: This slide provides information about best practices to be adopted by web company in marketing.
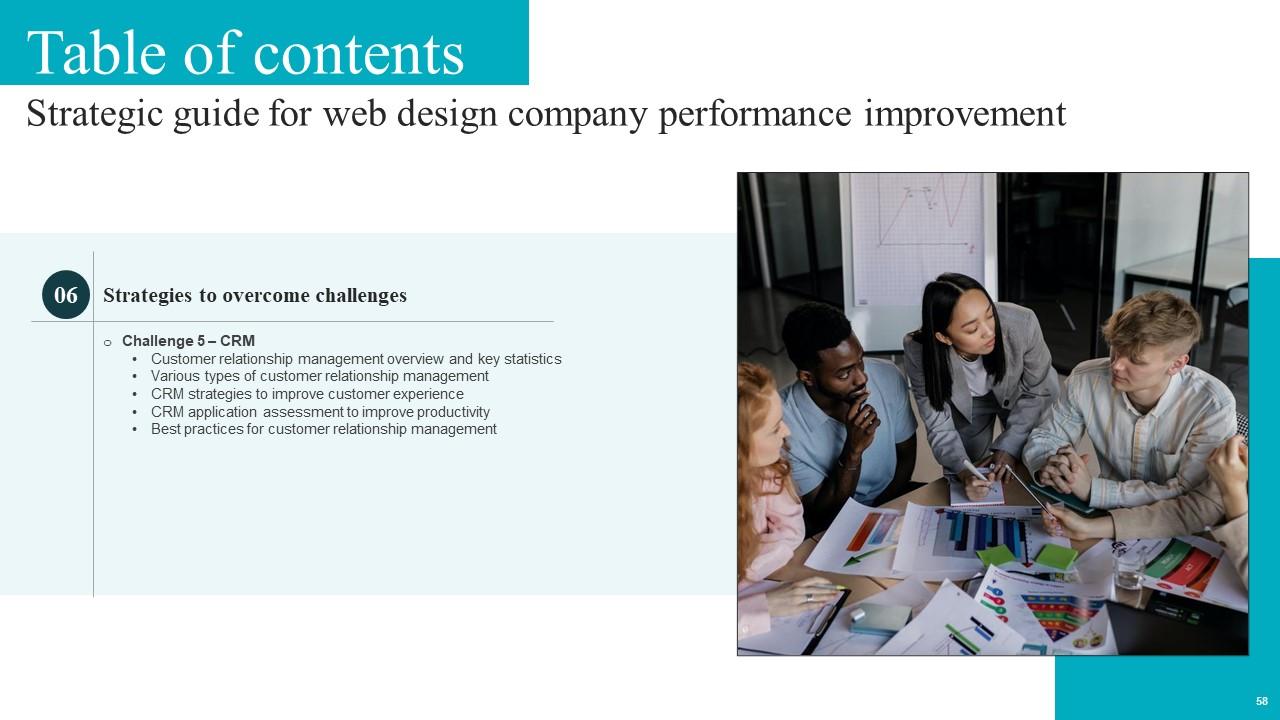
Slide 58: This slide exhibit Table of Content: Challenge 5 – CRM.
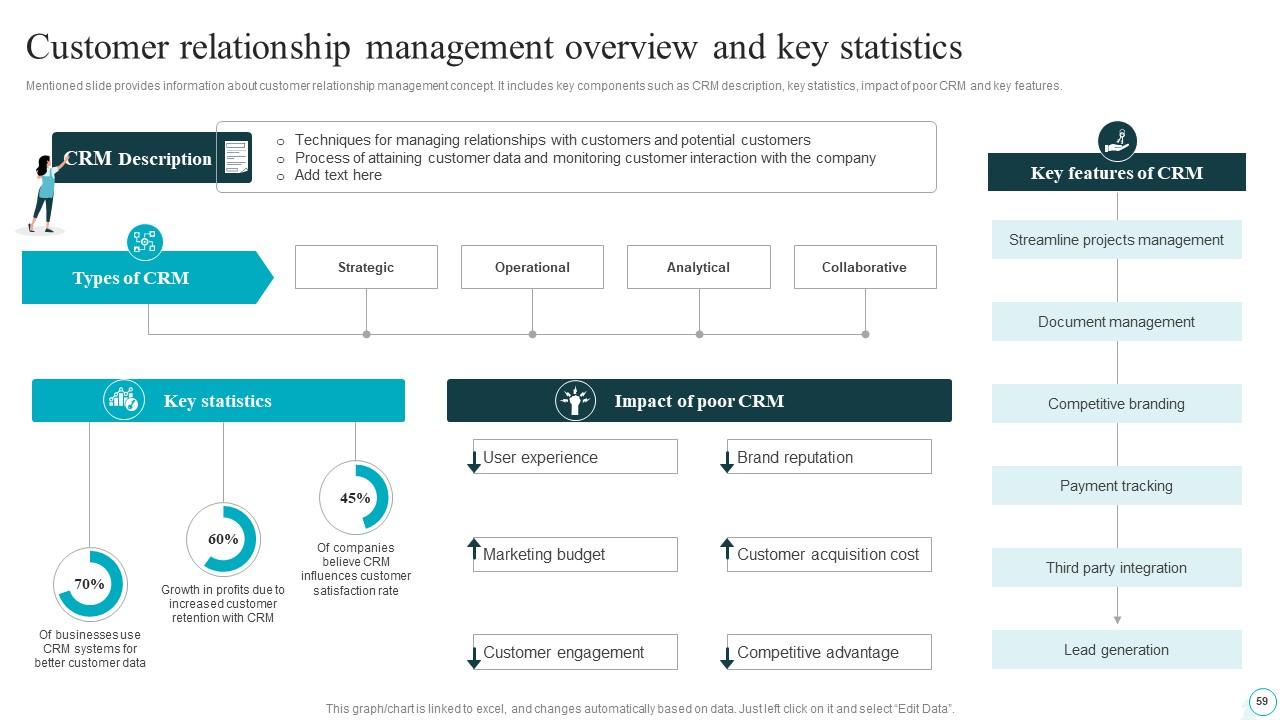
Slide 59: This slide provides information about customer relationship management concept.
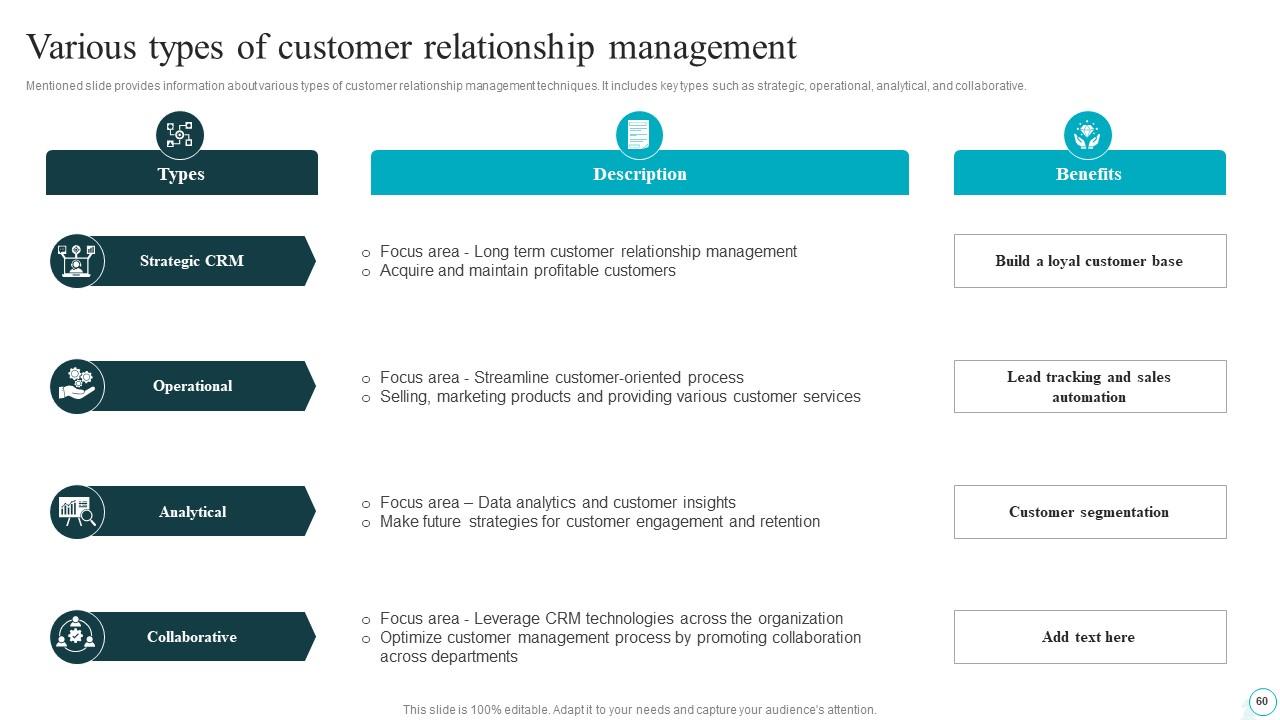
Slide 60: This slide provides information about various types of customer relationship management techniques.
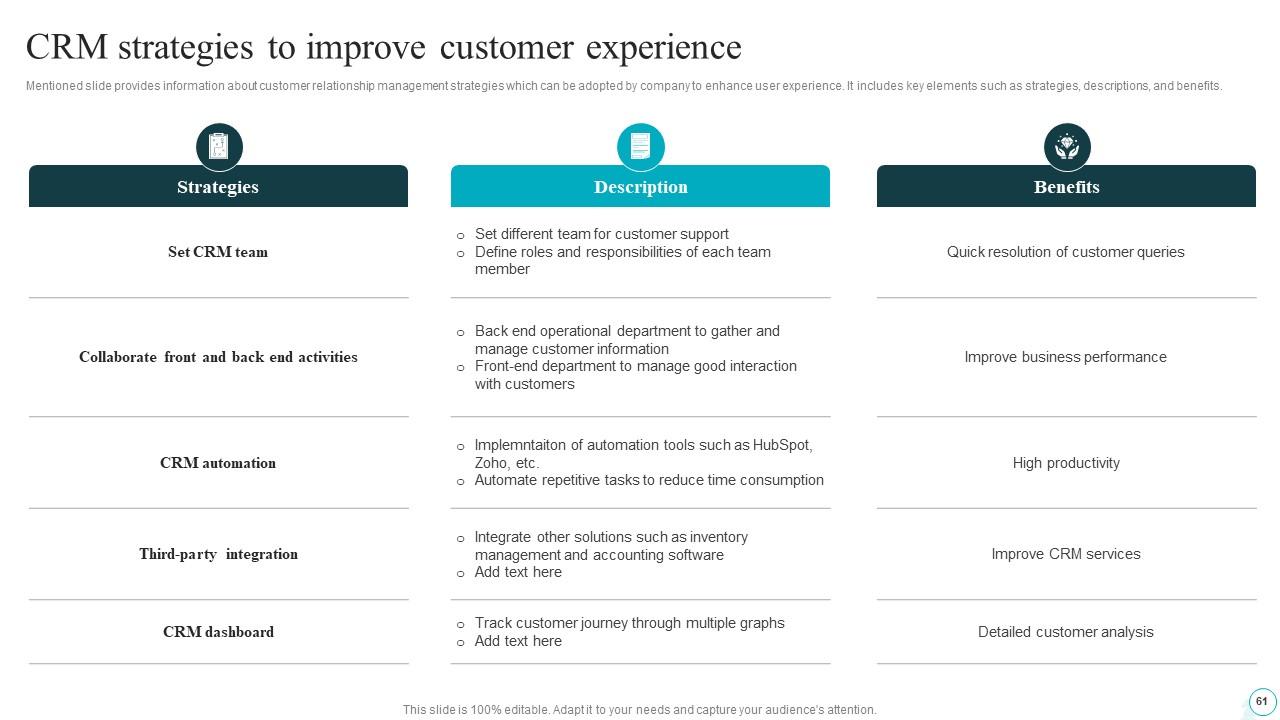
Slide 61: This slide provides information about customer relationship management strategies which can be adopted by company to enhance user experience.
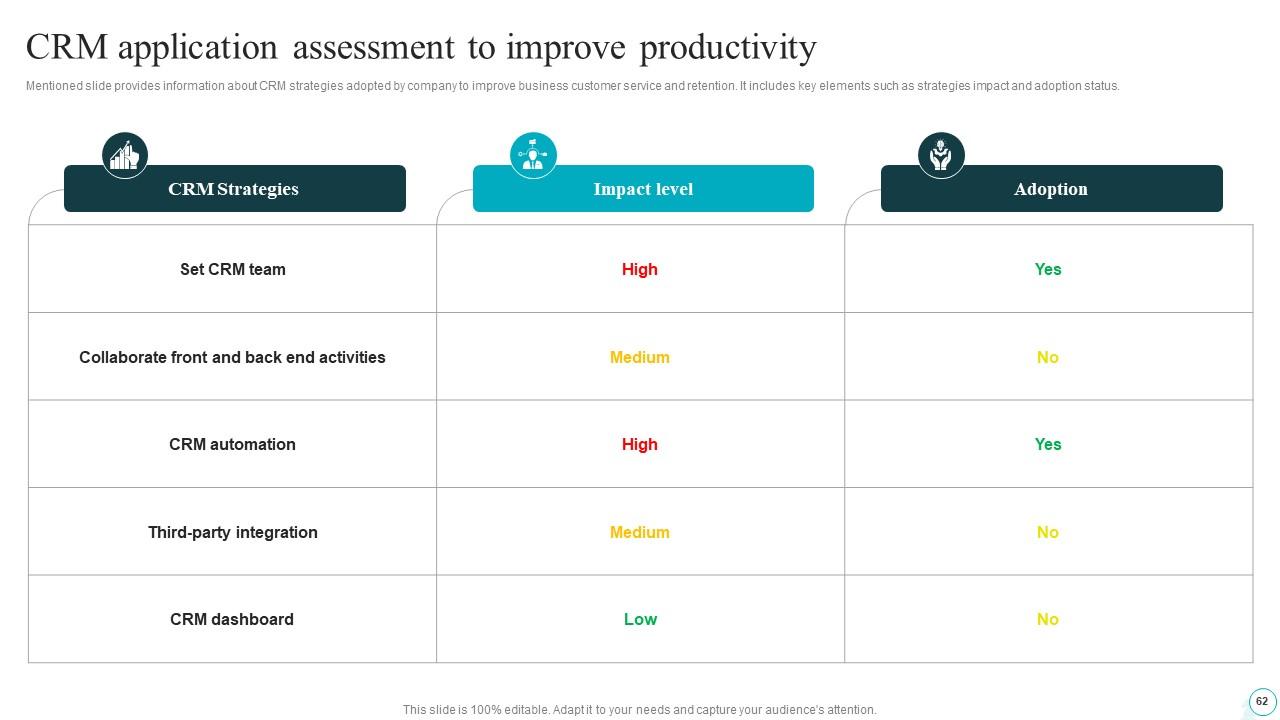
Slide 62: This slide provides information about CRM strategies adopted by company to improve business customer service and retention.
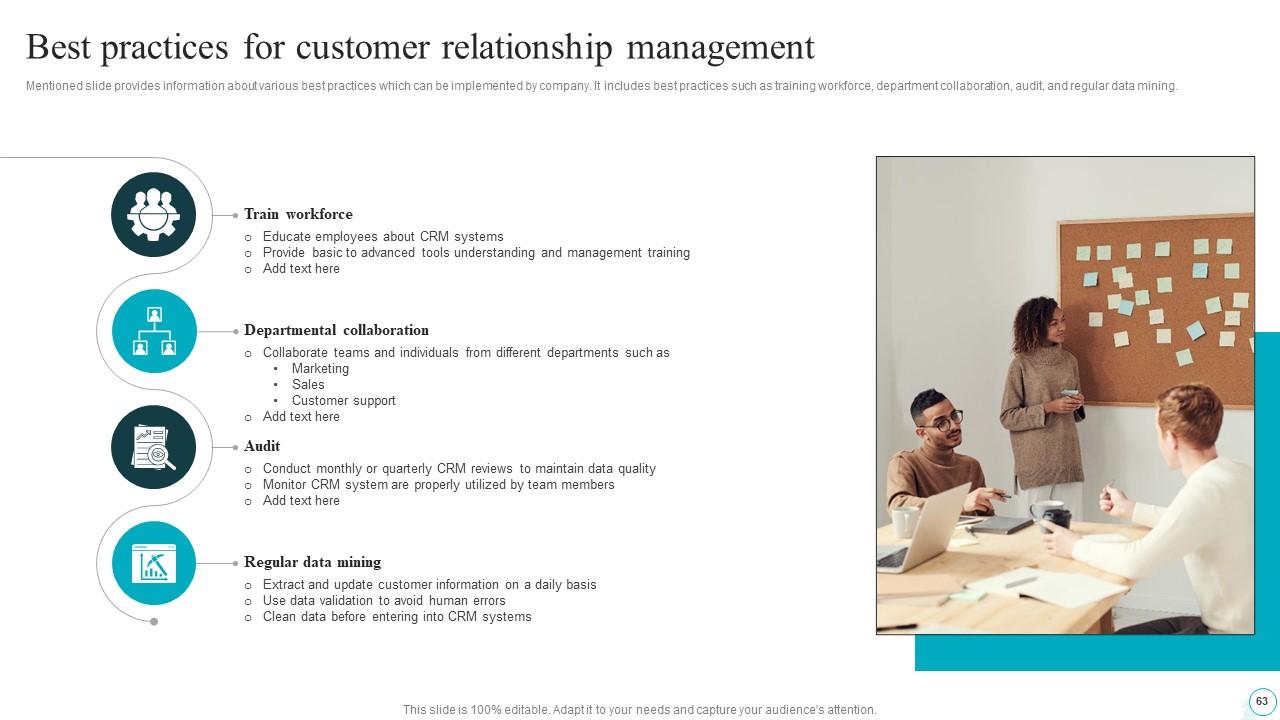
Slide 63: This slide provides information about various best practices which can be implemented by company.
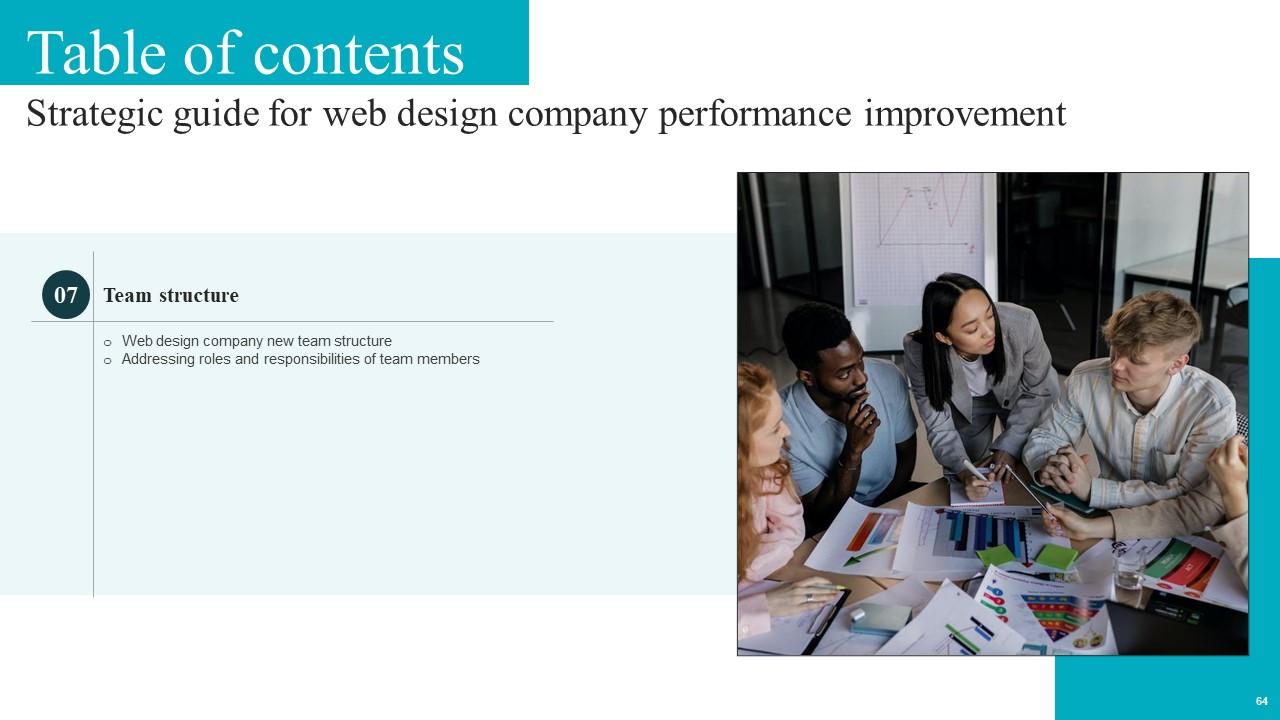
Slide 64: This slide exhibit Table of Content: Team structure.
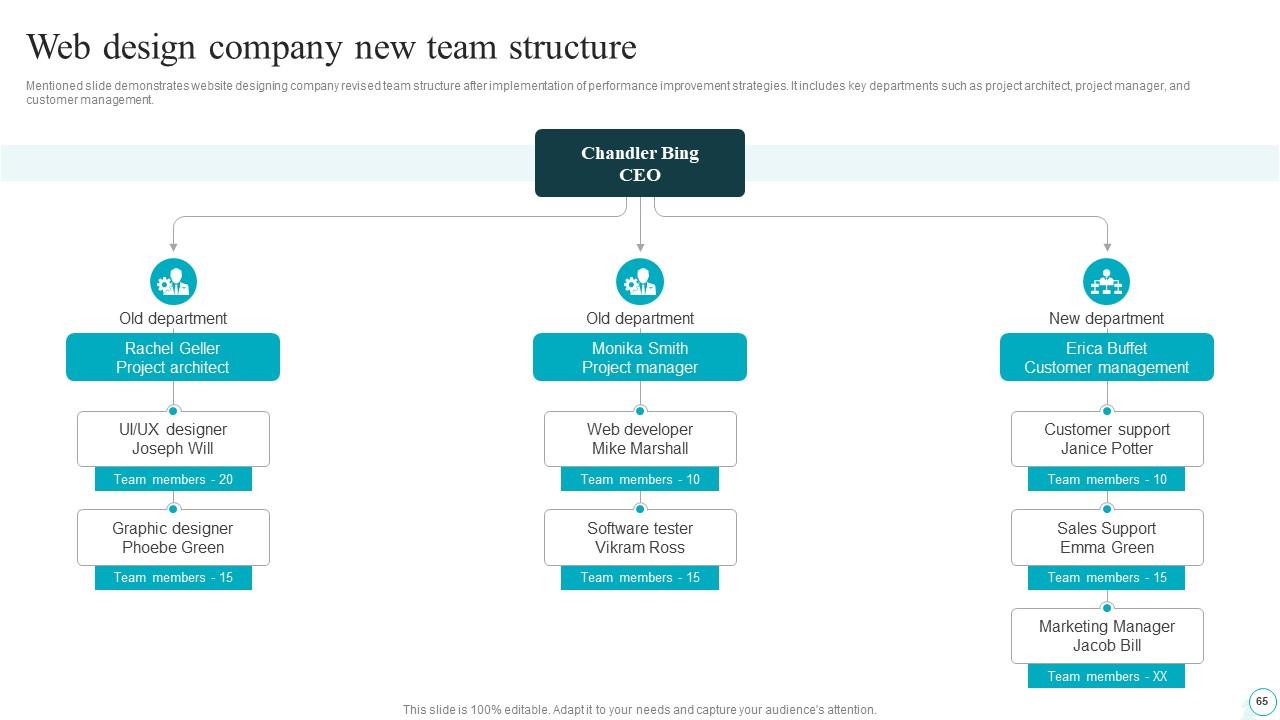
Slide 65: This slide demonstrates website designing company revised team structure after implementation of performance improvement strategies.
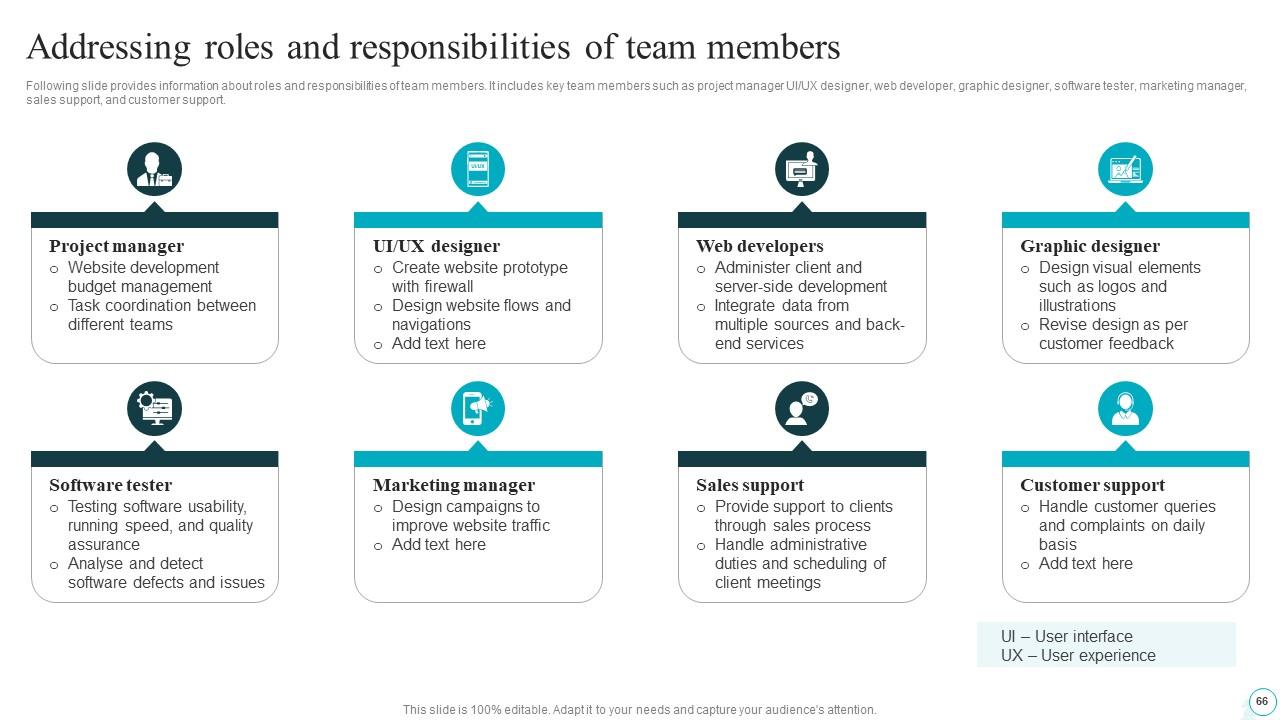
Slide 66: This slide provides information about roles and responsibilities of team members.
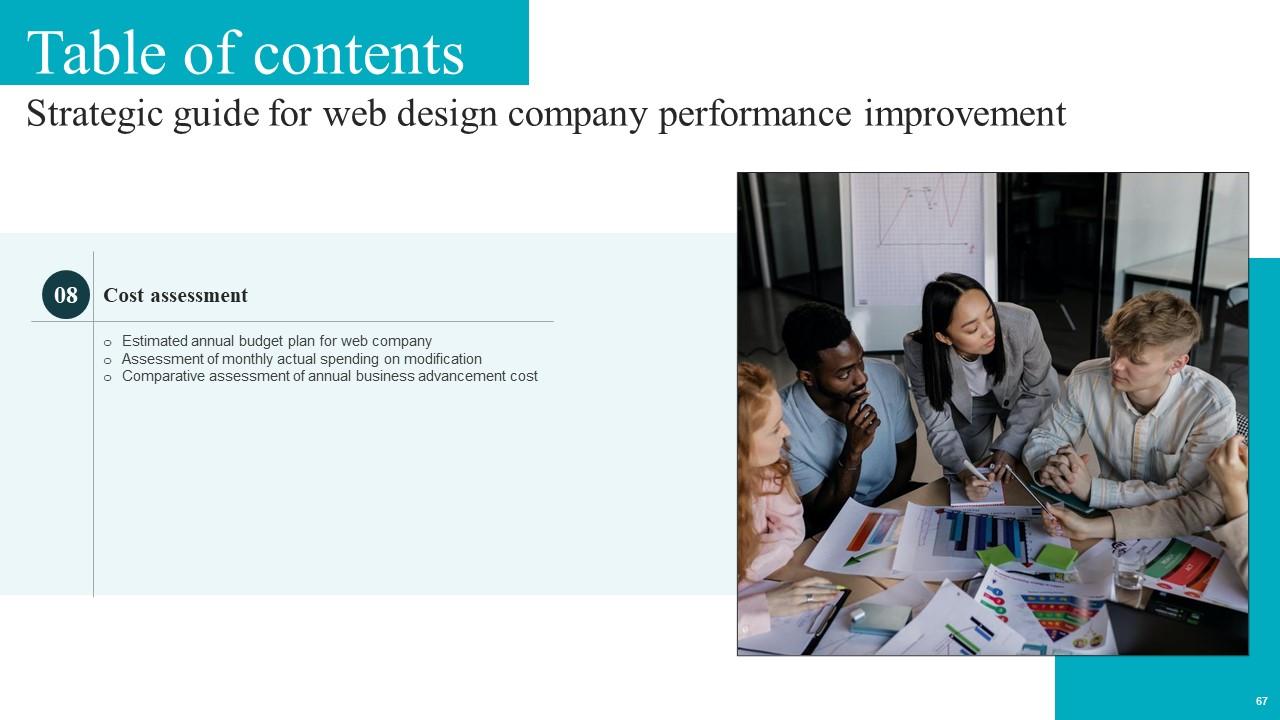
Slide 67: This slide exhibit Table of Content: Cost assessment.
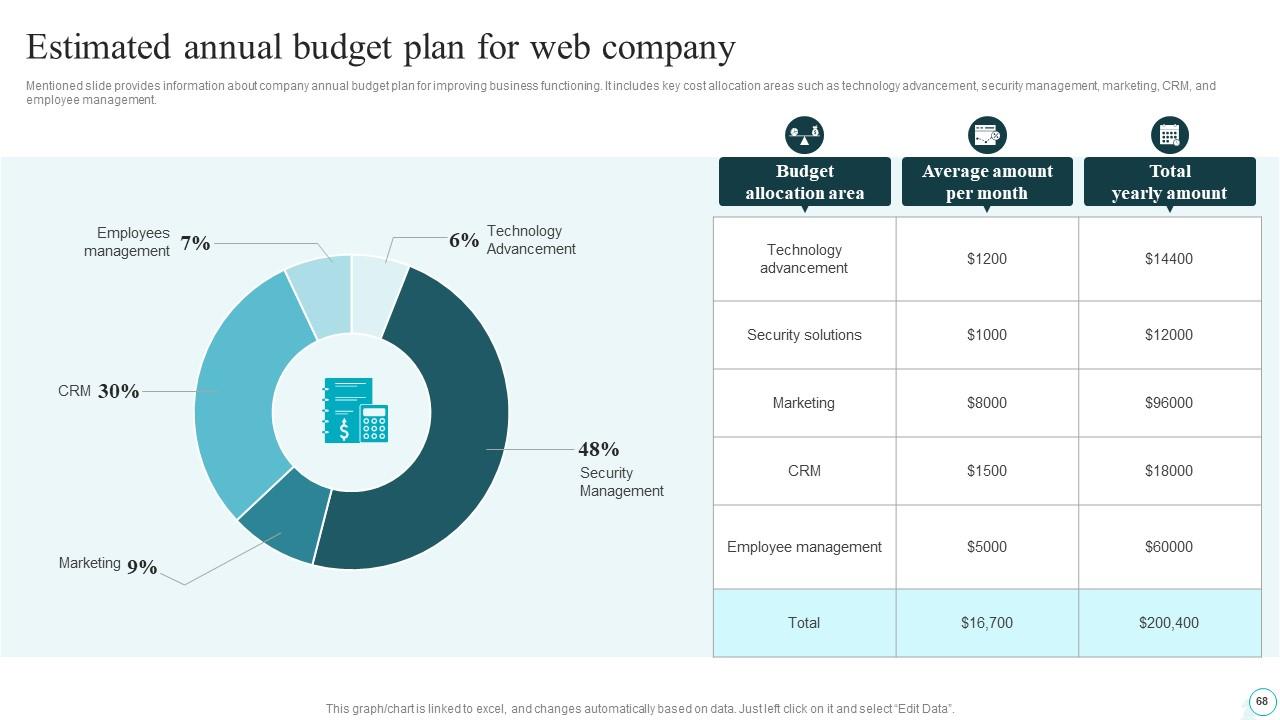
Slide 68: This slide provides information about company annual budget plan for improving business functioning.
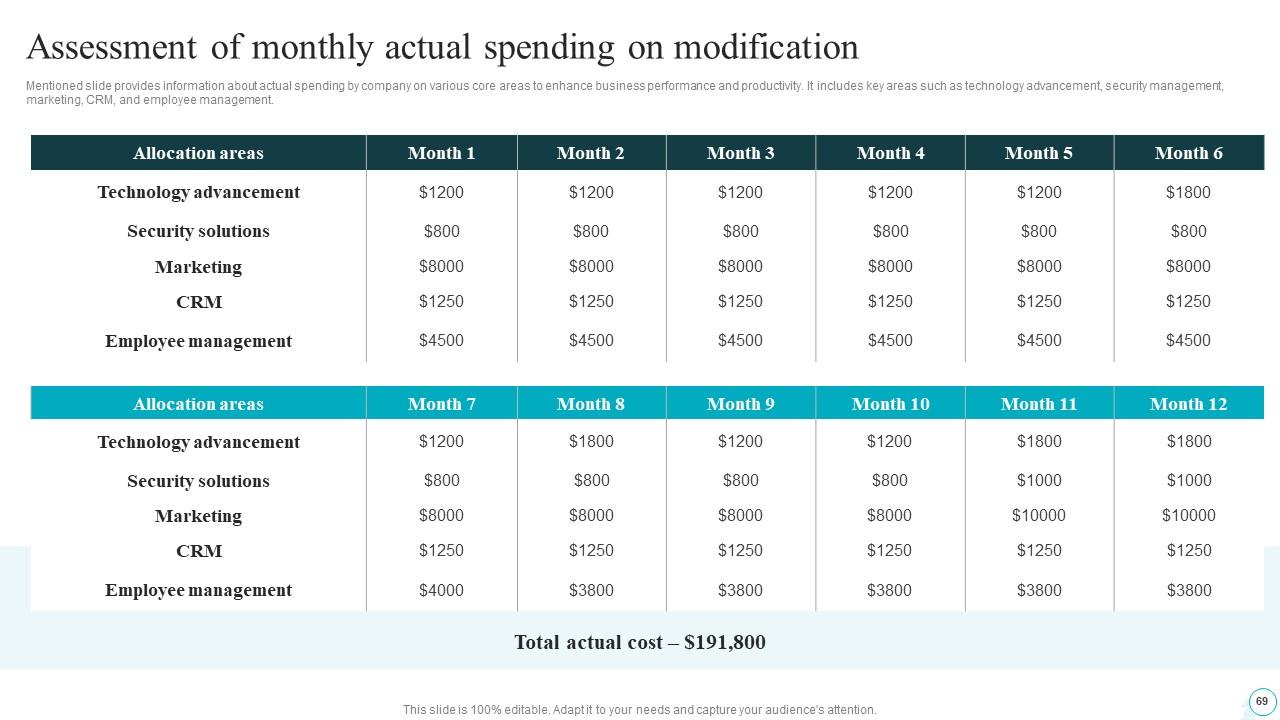
Slide 69: This slide provides information about actual spending by company on various core areas to enhance business performance and productivity.
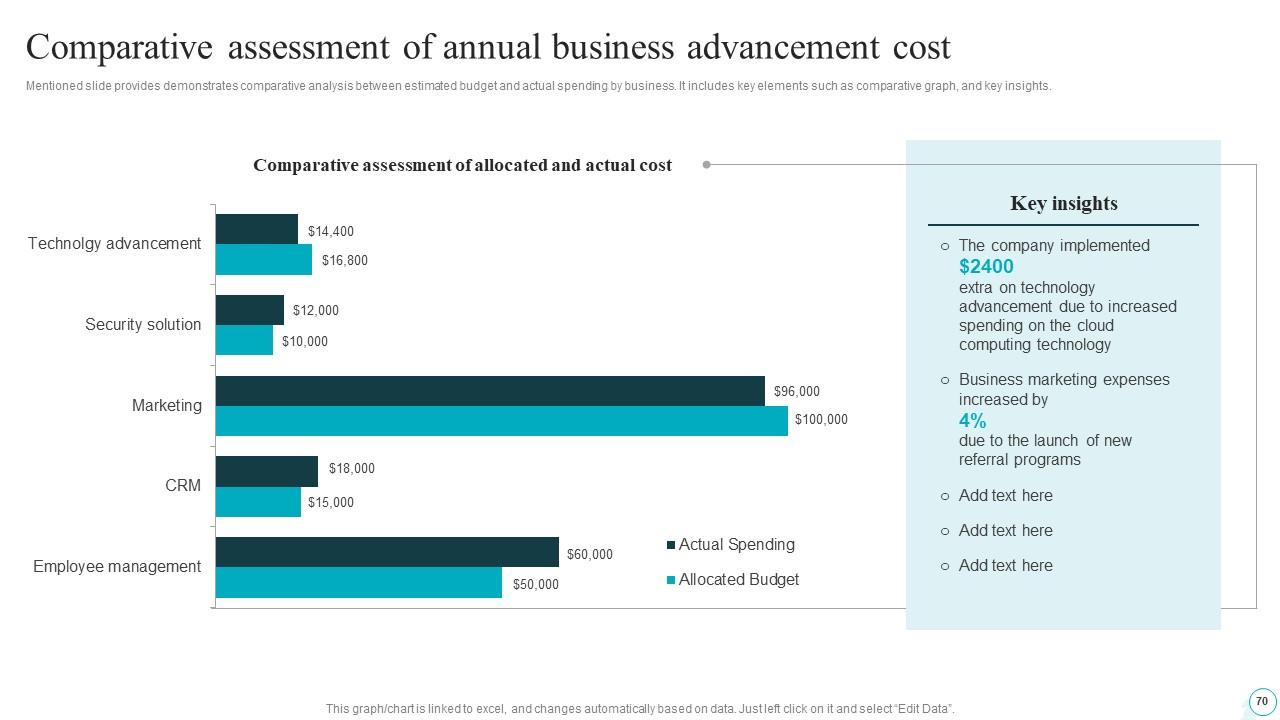
Slide 70: This slide provides demonstrates comparative analysis between estimated budget and actual spending by business.
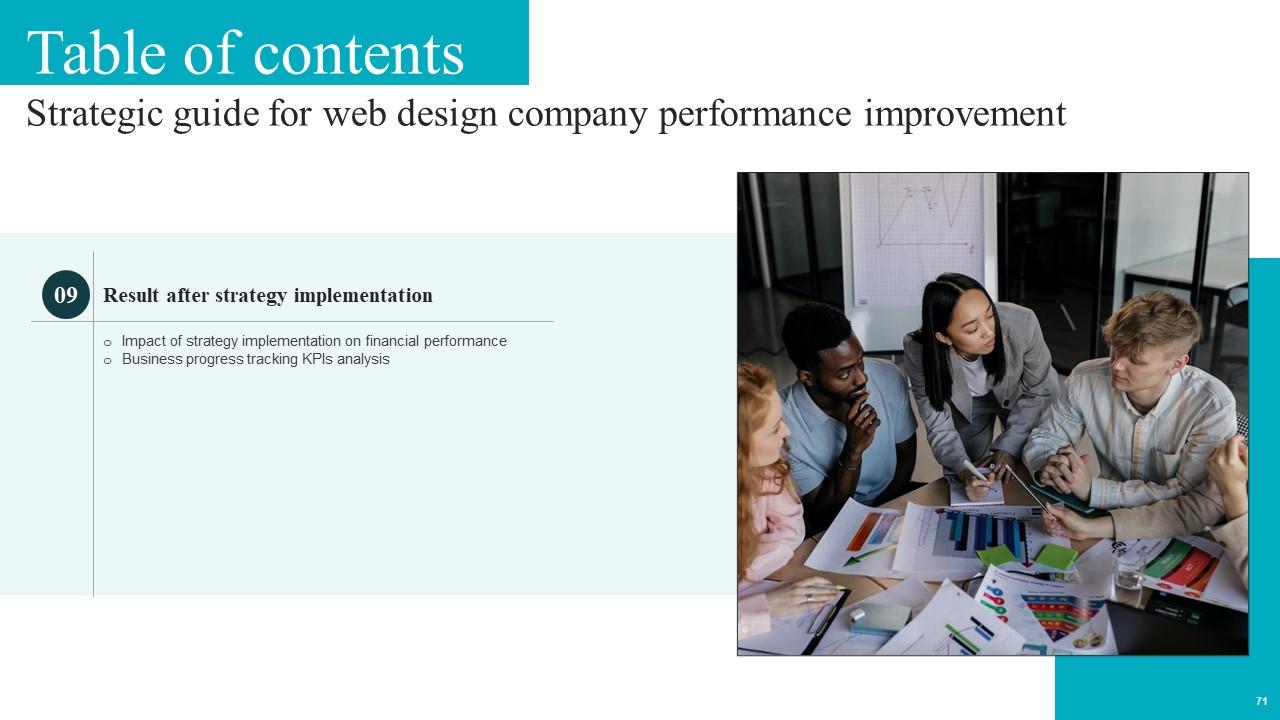
Slide 71: This slide exhibit Table of Content: Result after strategy implementation.
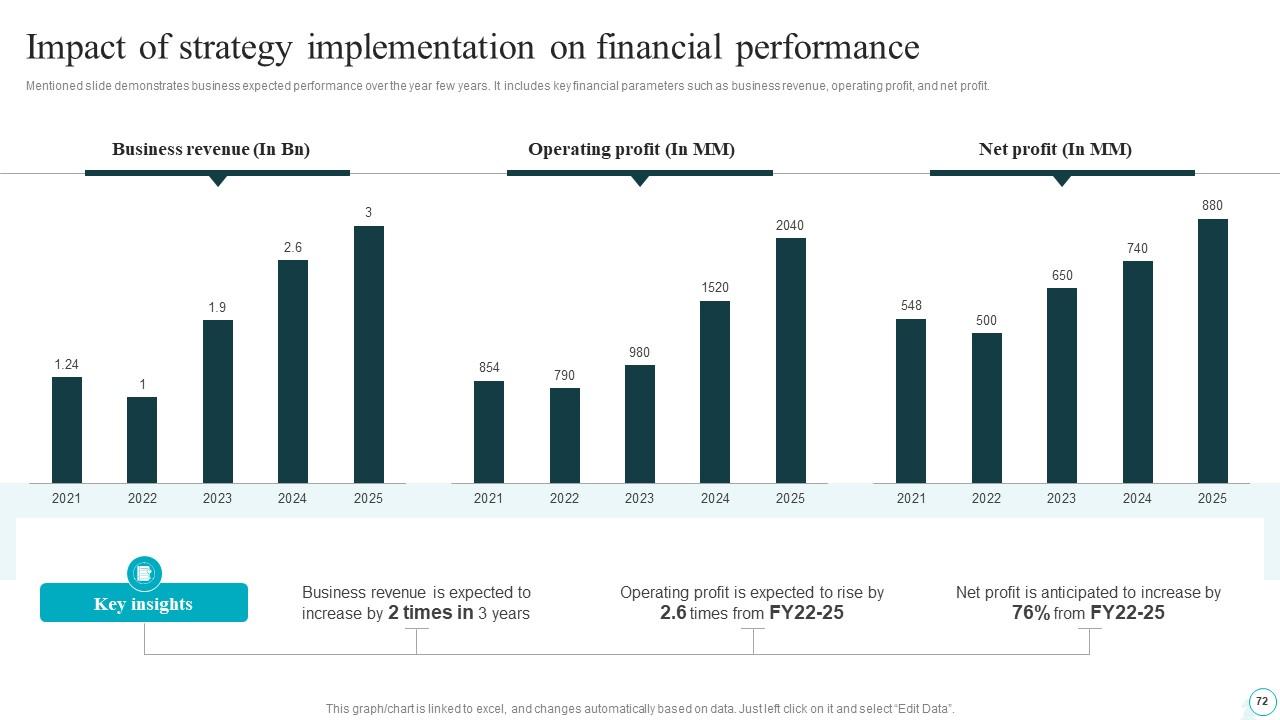
Slide 72: This slide demonstrates business expected performance over the year few years.
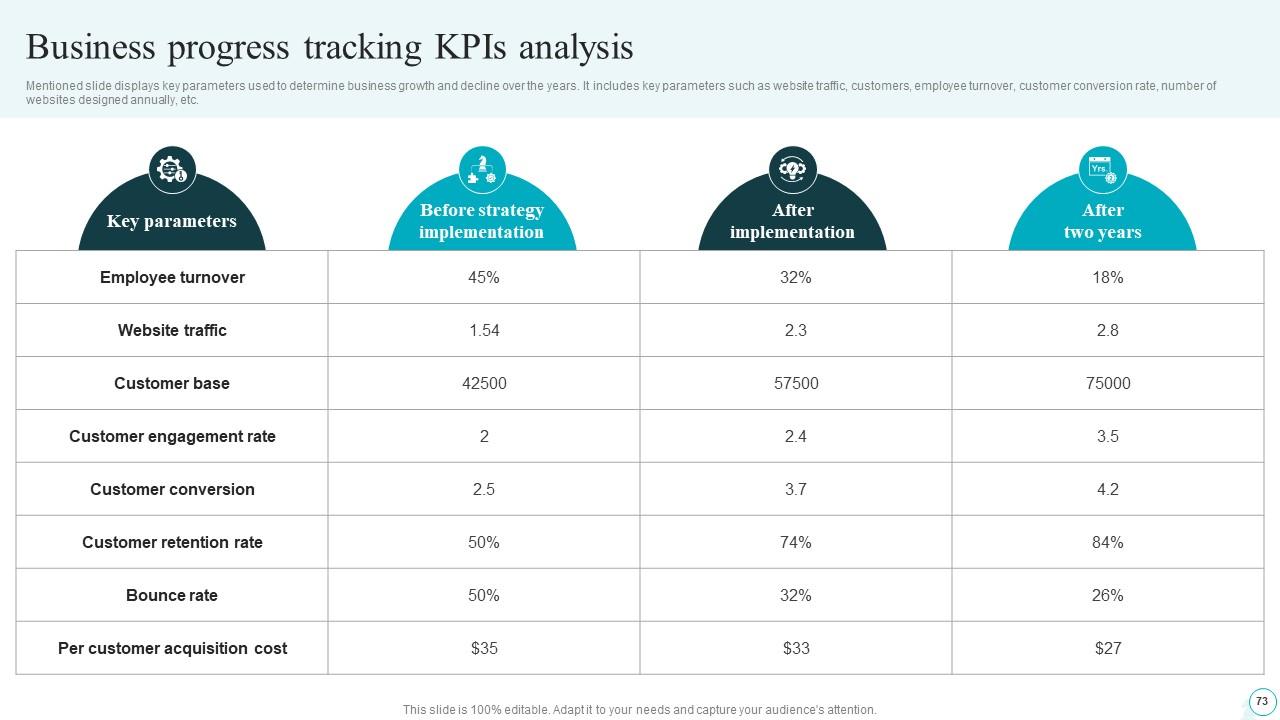
Slide 73: This slide displays key parameters used to determine business growth and decline over the years.
Slide 74: This slide exhibit Table of Content: Impact analysis.
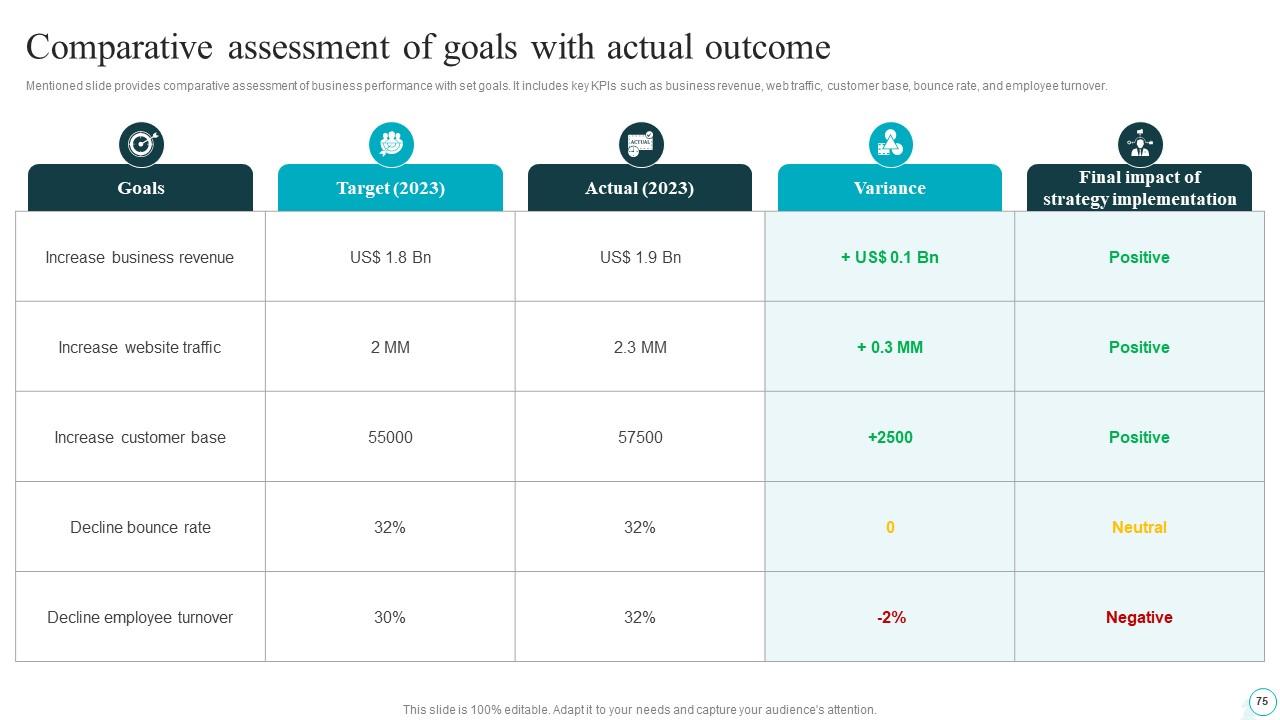
Slide 75: This slide provides comparative assessment of business performance with set goals.
Slide 76: This slide exhibit Table of Content: Case study.
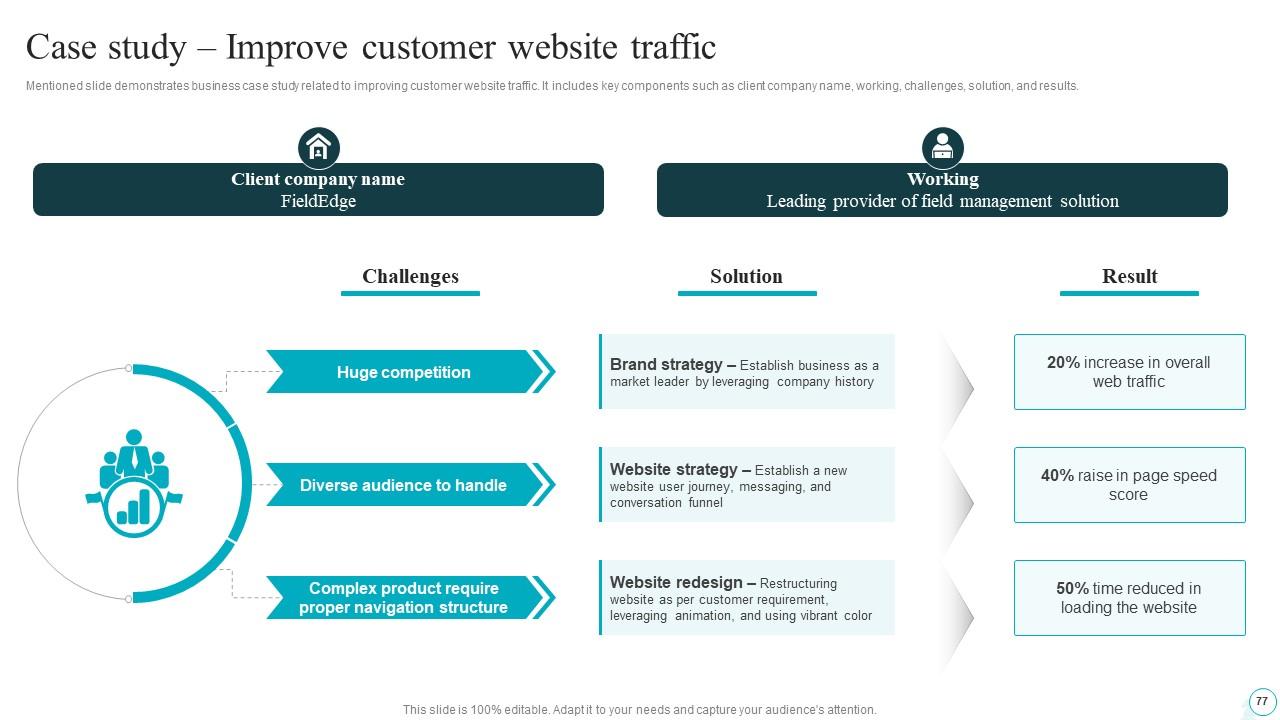
Slide 77: This slide demonstrates business case study related to improving customer website traffic.
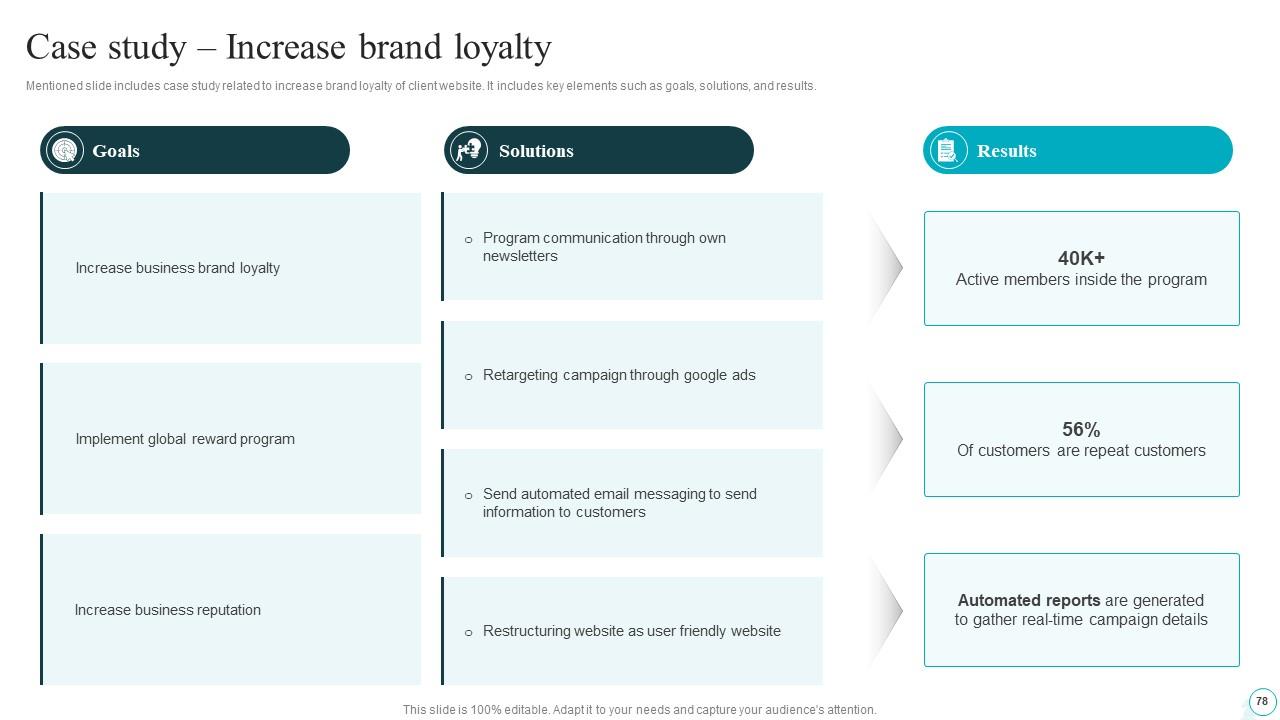
Slide 78: This slide includes case study related to increase brand loyalty of client website.
Slide 79: This slide shows all the icons included in the presentation.
Slide 80: This slide is titled as Additional Slides for moving forward.
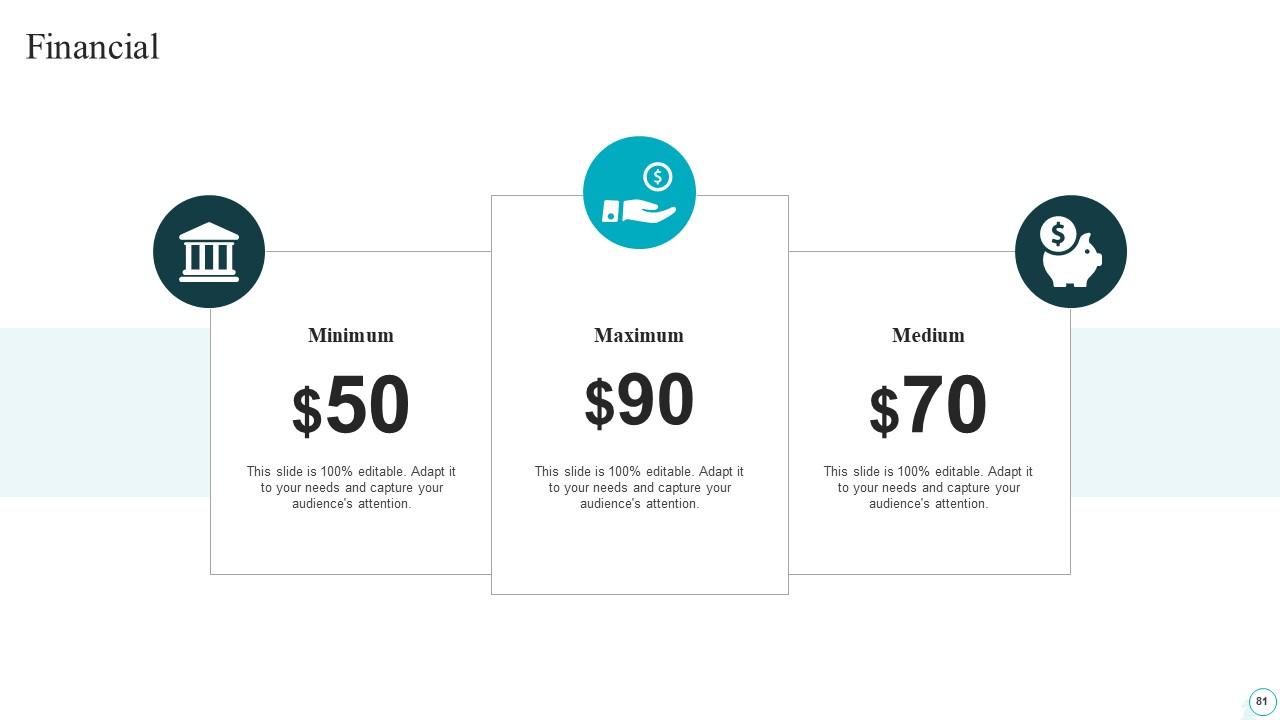
Slide 81: This is a financial slide. Show your finance related stuff here.
Slide 82: This slide showcases Magnifying Glass to highlight, minute details, information, specifications etc.
Slide 83: This slide showcase Venn.
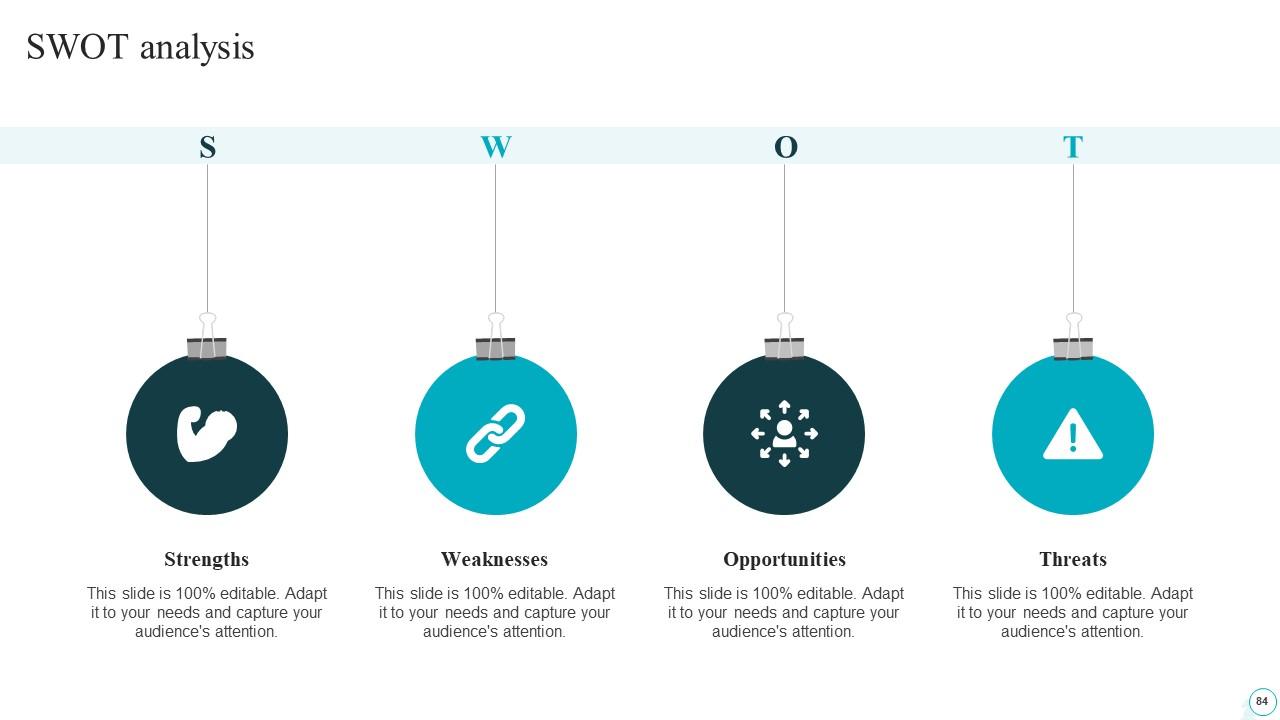
Slide 84: This slide showcase SWOT analysis.
Slide 85: This slide contains Puzzle with related icons and text.
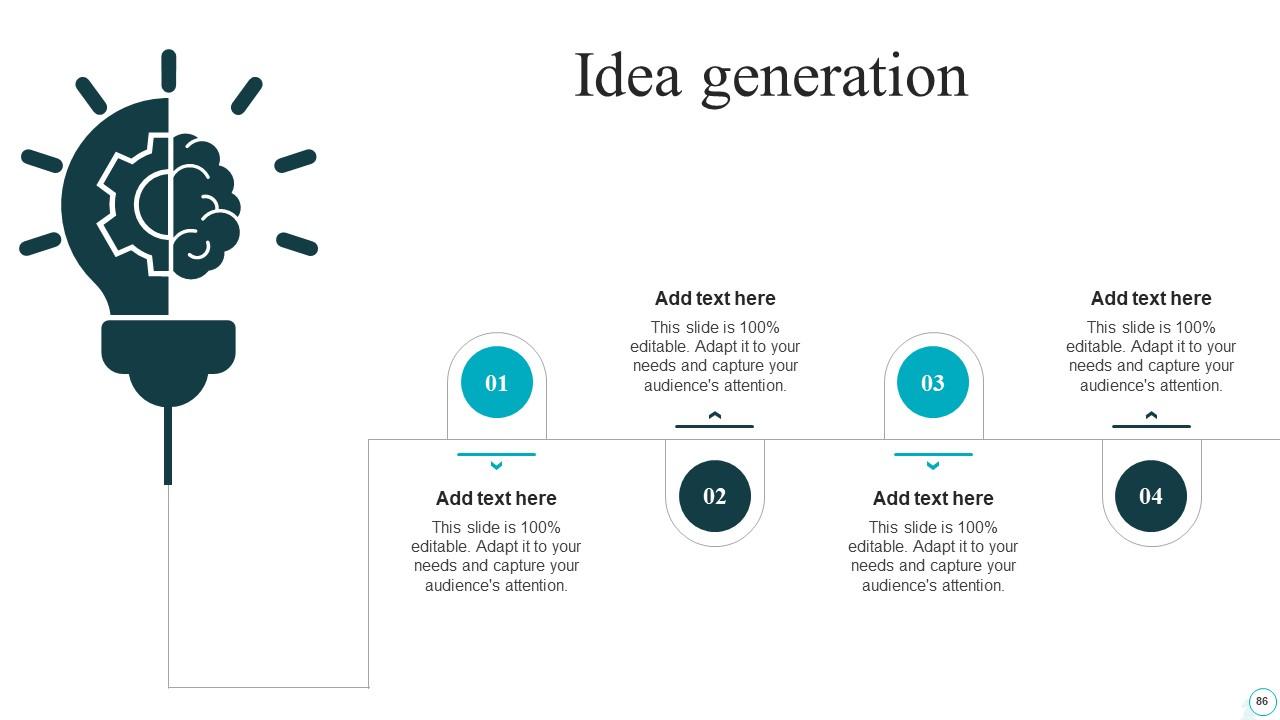
Slide 86: This is an Idea Generation slide to state a new idea or highlight information, specifications etc.
Slide 87: This is a Thank You slide with address, contact numbers and email address.
Strategic Guide For Web Design Company Performance Improvement Powerpoint Presentation Slides with all 96 slides:
Use our Strategic Guide For Web Design Company Performance Improvement Powerpoint Presentation Slides to effectively help you save your valuable time. They are readymade to fit into any presentation structure.
-
I really liked their customized design services. I got my desired template made by their expert team. Thank You!
-
SlideTeam is very efficient when it comes to saving time. I am happy that I chose them for my presentation.


