


Strategies to overcome the challenge of declining financials of a zoo complete deck


Try Before you Buy Download Free Sample Product
 Impress Your
 Audience
Editable
of Time


Our Strategies To Overcome The Challenge Of Declining Financials Of A Zoo Complete Deck are topically designed to provide an attractive backdrop to any subject. Use them to look like a presentation pro.
Deliver an informational PPT on various topics by using this Strategies To Overcome The Challenge Of Declining Financials Of A Zoo Complete Deck. This deck focuses and implements best industry practices, thus providing a birds eye view of the topic. Encompassed with fourty six slides, designed using high quality visuals and graphics, this deck is a complete package to use and download. All the slides offered in this deck are subjective to innumerable alterations, thus making you a pro at delivering and educating. You can modify the color of the graphics, background, or anything else as per your needs and requirements. It suits every business vertical because of its adaptable layout.
People who downloaded this PowerPoint presentation also viewed the following :
Content of this Powerpoint Presentation
Slide 1: This slide is titled “Strategies To Overcome The Challenge Of Declining Financials of A Zoo.” State your company name and get started.
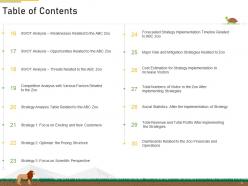
Slide 2: This slide is titled “Table of Contents.” It shows the Most Favoured Entertainment Attraction In USA, Market Size of Theme Park Industry, Total Numbers of Visitor in the Zoo, etc.
Slide 3: This slide is titled “Table of Contents.” It shows SWOT Analysis – Weaknesses Related to the ABC Zoo, SWOT Analysis – Opportunities Related to the ABC Zoo, SWOT Analysis – Threats Related to the ABC Zoo, etc.
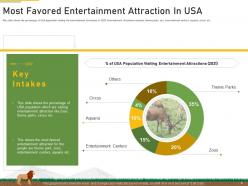
Slide 4: This slide is titled “Most Favored Entertainment Attraction in USA.” It shows the percentage of the US population who are visiting entertainment attractions like Zoos, theme parks, circuses, etc.
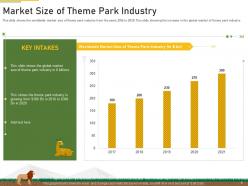
Slide 5: This slide is titled “Market Size of Theme Park Industry.” It shows the worldwide market size of the theme park industry from the years 2016 to 2020.
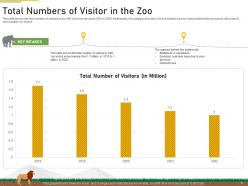
Slide 6: This slide is titled “Total Numbers of Visitors in the Zoo.” It shows the total number of visitors to the ABC Zoo from the years 2016 to 2020. Additionally, the company provides the key intakes such as the reason behind the increase or decrease of the total number of visitors.
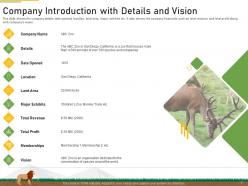
Slide 7: This slide is titled “Company Introduction with Details and Vision.” It shows the company details date opened, location, land area, major exhibits, etc. It also shows the company’s financials such as total revenue and total profit along with the company’s vision.
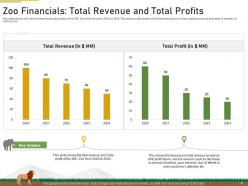
Slide 8: This slide is titled “Zoo Financials: Total Revenue and Total Profits.” It shows the total revenue and total profits of the ABC Zoo from the years 2016 to 2020, total revenue and total profit of the ABC Zoo from 2020 to 2024, etc.
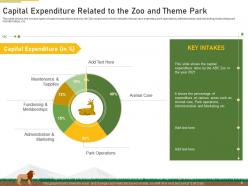
Slide 9: This slide is titled “Capital Expenditure Related to the Zoo and Theme Park.” It shows the various types of capital expenditure done by the Zoo corporation which includes animal care expenses, park operations, administration and marketing, fundraising and memberships, etc.
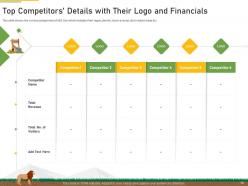
Slide 10: This slide is titled “Top Competitors’ Details with Their Logo and Financials.” It shows the various competitors of ABC Zoo which include their logos, details, total revenue, total visitors base, etc.
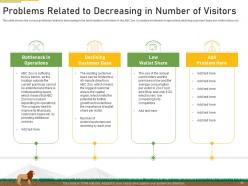
Slide 11: This slide is titled “Problems Related to Decreasing in Number of Visitors.” It shows the various problems related to decreasing in the total numbers of visitors to the ABC Zoo. It includes bottlenecks in operations, a declining customer base, low wallet shares, etc.
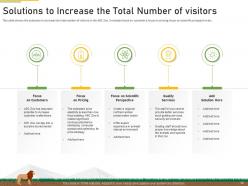
Slide 12: This slide is titled “Solutions to Increase the Total Number of visitors.” It shows the solutions to increase the total number of visitors to the ABC Zoo. It includes a focus on customers, pricing, scientific perspective, etc.
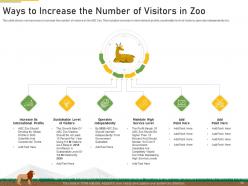
Slide 13: This slide is titled “Ways to Increase the Number of Visitors in the Zoo.” It shows various ways to increase the number of visitors to the ABC Zoo. This includes an increase in international profile, sustainable level of visitors, operating independently, etc.
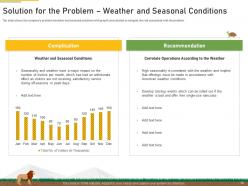
Slide 14: This slide is titled “Solution for the Problem – Weather and Seasonal Conditions.” It shows the company’s problem (weather and seasonal condition with graph) and solution to mitigate the risk associated with the problem.
Slide 15: This slide is titled “Solution for the Problem - Reduction in Government Subsidies.” It shows the company’s problem (reduction in government subsidies) and solutions to mitigate the risk associated with the problem.
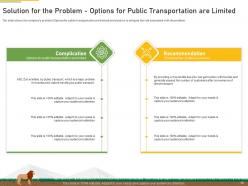
Slide 16: This slide is titled “Solution for the Problem - Options for Public Transportation are Limited.” It shows the company’s problem (Options for public transportation are limited) and solutions to mitigate the risk associated with the problem.
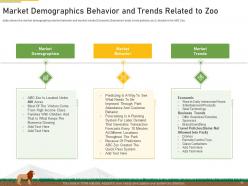
Slide 17: This slide is titled “Market Demographics Behaviour and Trends Related to Zoo.” It shows the market demographics, market behavior, and market trends (Economic, Business trends, travel policies, etc.) related to the ABC Zoo.
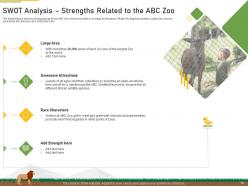
Slide 18: This slide is titled “SWOT Analysis – Strengths Related to the ABC Zoo.” It shows the key strong points of the ABC Zoo which provides it an edge over its peers. Major Strengths include the large size of the area, awesome attractions, rare characters, etc.
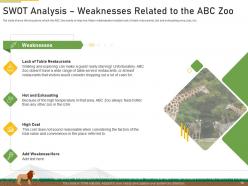
Slide 19: This slide is titled “SWOT Analysis – Weaknesses Related to the ABC Zoo.” It shows the key points which the ABC Zoo needs to improve. Major weaknesses include lack of table restaurants, hot and exhausting areas, cost, etc.
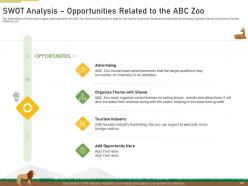
Slide 20: This slide is titled “SWOT Analysis – Opportunities Related to the ABC Zoo.” It shows the key future opportunity points for the ABC Zoo, which will be a positive sign for the Zoo for its growth. Major points include Advertising, Organizing themes with shows, the tourism industry, etc.
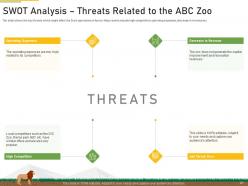
Slide 21: This slide is titled “SWOT Analysis – Threats Related to the ABC Zoo.” It shows the key threats which might affect the Zoo’s operations in the future. Major points include high competition, operating expenses, decrease in revenue, etc.
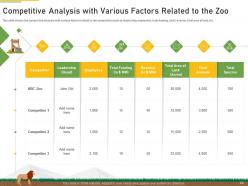
Slide 22: This slide is titled “Competitive Analysis with Various Factors Related to the Zoo.” It shows the competitive analysis with various factors related to the competitors such as leadership, employees, total funding, total revenue, the total area of land, etc.
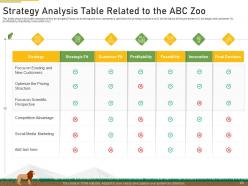
Slide 23: This slide is titled “Strategy Analysis Table Related to the ABC Zoo.” It shows the table analysis of key strategies (Focus on existing and new customers, optimize the pricing structure, etc.) on the basis of key parameters (strategic and customer fit, profitability, feasibility, innovation, etc).
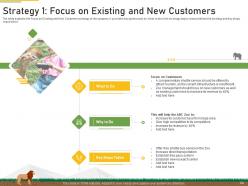
Slide 24: This slide is titled “Strategy 1: Focus on Existing and New Customers.” It explains the Focus on Existing and New Customers strategy of the company. It provides key points such as what to do in the strategy, the major reason behind the strategy, etc
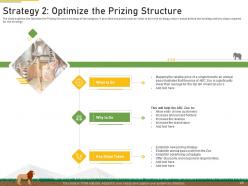
Slide 25: This slide is titled “Strategy 2: Optimize the Pricing Structure.” It explains the Optimize the Prizing Structure strategy of the company. It provides key points such as what to do in the strategy, the major reason behind the strategy, and key steps required for the strategy.
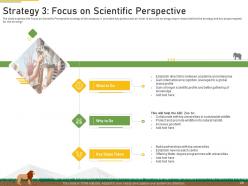
Slide 26: This slide is titled “Strategy 3: Focus on Scientific Perspective.” It explains the Focus on Scientific Perspective strategy of the company. It provides key points such as what to do in the strategy, the major reason behind the strategy, and key steps required for the strategy.
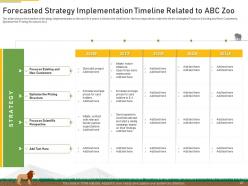
Slide 27: This slide is titled “Forecasted Strategy Implementation Timeline Related to ABC Zoo.” It shows the timeline of strategy implementation in the next five years. It shows the timeline for the key steps taken under the three strategies (Focus on Existing and New Customers, Optimize the Pricing Structure, etc.)
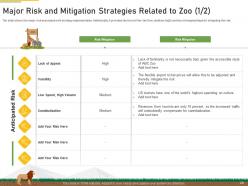
Slide 28: This slide is titled “Major Risk and Mitigation Strategies Related to Zoo (1/2).” It shows the major risk associated with strategy implementation. Additionally, it provides the level of the risk (low, medium, high) and key strategies/steps for mitigating the risk.
Slide 29: This slide is titled “Major Risk and Mitigation Strategies Related to Zoo (2/2).”
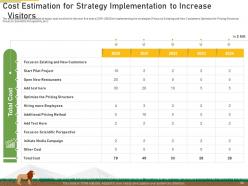
Slide 30: This slide is titled “Cost Estimation for Strategy Implementation to Increase Visitors.” It shows the estimation of major costs involved in the next five years (2019-2023) for implementing the strategies (Focus on Existing and New Customers, Optimize the Pricing Structure, Focus on Scientific Perspective, etc).
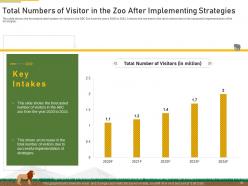
Slide 31: This slide is titled “Total Numbers of Visitors in the Zoo After Implementing Strategies.” It shows the forecasted total number of visitors to the ABC Zoo from the years 2020 to 2024. It shows the increase in the total number of visitors due to the successful implementation of the strategies.
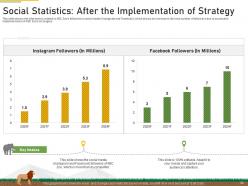
Slide 32: This slide is titled “Social Statistics: After the Implementation of Strategy.” It shows the information related to ABC Zoo’s followers in social media (Instagram and Facebook), which shows an increase in the total number of followers due to the successful implementation of ABC Zoo’s strategies.
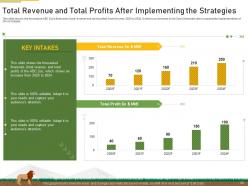
Slide 33: This slide is titled “Total Revenue and Total Profits After Implementing the Strategies.” It shows the forecasted ABC Zoo’s financials (total revenue and total profits) from the year 2020 to 2024. It shows an increase in the Zoo’s finances due to the successful implementation of the strategies.
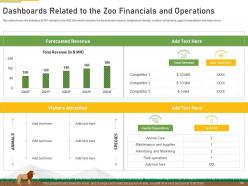
Slide 34: This slide is titled “Dashboards Related to the Zoo Financials and Operations.” It shows the dashboard/ KPI related to the ABC Zoo which includes the forecasted revenue, competitors' details, visitors' attractions, capital expenditure, and many more.
Slide 35: This slide is titled “Icon Slide for Strategies to Overcome the Challenge of Declining Financials of a Zoo.”
Slide 36: This slide is titled “Additional Slides.”
Slide 37: This slide is titled “About Us.” It contains the information about the company aka the ‘About Us’ section. This includes the Value Clients, the Target Audience, and Preferred by Many.
Slide 38: This slide is titled “Our Mission.” It provides the Mission for the entire company. This includes the vision, the mission, and the goal.
Slide 39: This slide is titled “Timeline.” It shows a 5-year timeline for your product.
Slide 40: This slide is titled “30 60 90 Days Plan.” Set goals for these important intervals.
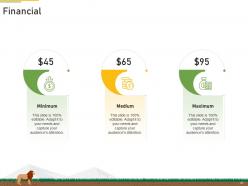
Slide 41: This slide is titled “Financial.” It shows a bar graph that compares 3 products’ sales over a timeline of financial years.
Slide 42: This slide is titled “Bar Chart.” It compares 3 products’ sales over a timeline of financial years.
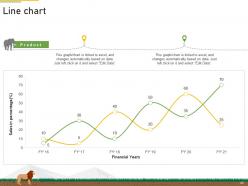
Slide 43: The slide is titled “Line Chart.” This graph/chart is linked to excel and changes automatically based on data. Just left-click on it and select “Edit Data”.
Slide 44: The slide is titled “Our Team.” It shows the members of the company team with their name, designation, and photo.
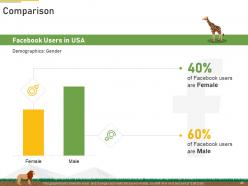
Slide 45: The slide is titled “Comparison.” It presents the Comparison between the percentages of male and female Facebook users.
Slide 46: This is a Thank You slide where details such as the address, contact number, and email address are added.
Strategies to overcome the challenge of declining financials of a zoo complete deck with all 46 slides:
Use our Strategies To Overcome The Challenge Of Declining Financials Of A Zoo Complete Deck to effectively help you save your valuable time. They are readymade to fit into any presentation structure.


Most Relevant Reviews
-
Qualitative and comprehensive slides.
-
Great experience, I would definitely use your services further.
-
Informative presentations that are easily editable.
-
Illustrative design with editable content. Exceptional value for money. Highly pleased with the product.
-
Easily Understandable slides.