Supply chain management architecture powerpoint presentation slides
Our Supply Chain Management Architecture Powerpoint Presentation Slides are topically designed to provide an attractive backdrop to any subject. Use them to look like a presentation pro.
Our Supply Chain Management Architecture Powerpoint Presentation Slides are topically designed to provide an attractive bac..
- Google Slides is a new FREE Presentation software from Google.
- All our content is 100% compatible with Google Slides.
- Just download our designs, and upload them to Google Slides and they will work automatically.
- Amaze your audience with SlideTeam and Google Slides.
-
Want Changes to This PPT Slide? Check out our Presentation Design Services
- WideScreen Aspect ratio is becoming a very popular format. When you download this product, the downloaded ZIP will contain this product in both standard and widescreen format.
-

- Some older products that we have may only be in standard format, but they can easily be converted to widescreen.
- To do this, please open the SlideTeam product in Powerpoint, and go to
- Design ( On the top bar) -> Page Setup -> and select "On-screen Show (16:9)” in the drop down for "Slides Sized for".
- The slide or theme will change to widescreen, and all graphics will adjust automatically. You can similarly convert our content to any other desired screen aspect ratio.
Compatible With Google Slides

Get This In WideScreen
You must be logged in to download this presentation.
PowerPoint presentation slides
Presenting Succession Planning Model For Talent Development. This slideshow is easy to download and can be presented in standard screen(14:6) and widescreen (16:9) ratios. Edit the font style, font color, and other components. This PPT compatible with Google slides. This PPT can be transformed into numerous documents or image formats like PDF or JPEG. High-quality graphics ensure that the picture quality is maintained.
People who downloaded this PowerPoint presentation also viewed the following :
Content of this Powerpoint Presentation
Slide 1: This slide introduces Supply Chain Management Architecture. State Your Company Name and begin.
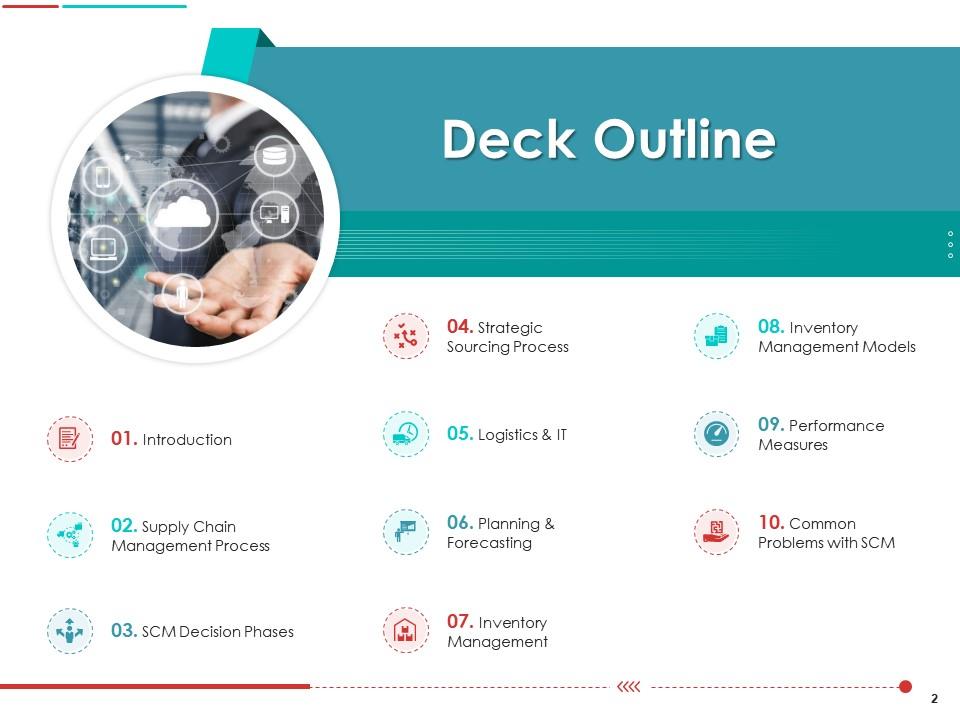
Slide 2: This slide shows Deck Outline for the presentation.
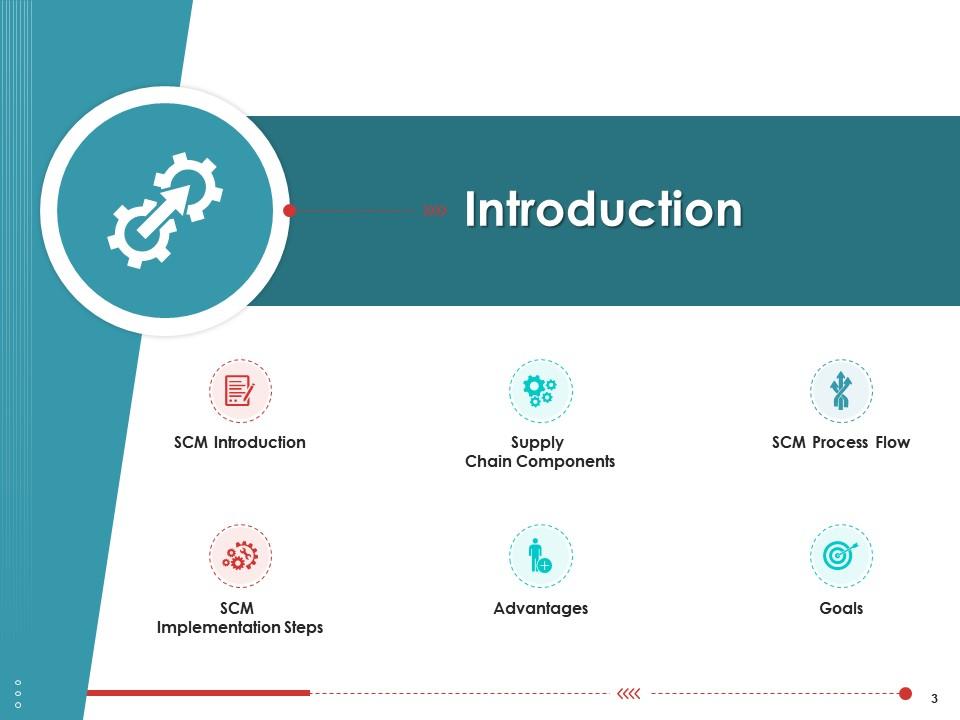
Slide 3: This slide presents Table of Content highlighting Introduction.
Slide 4: This slide shows Introduction describing- Shopper, Supplier, Manufacturer, etc.
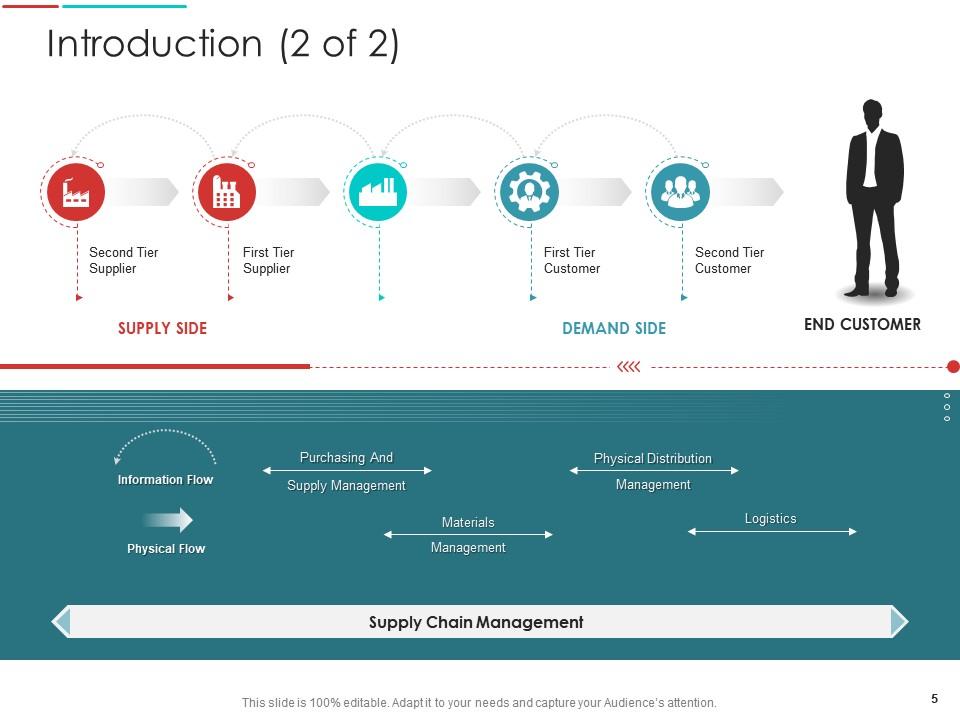
Slide 5: This is another slide showing Introduction describing- Physical Distribution Management, Materials Management, etc.
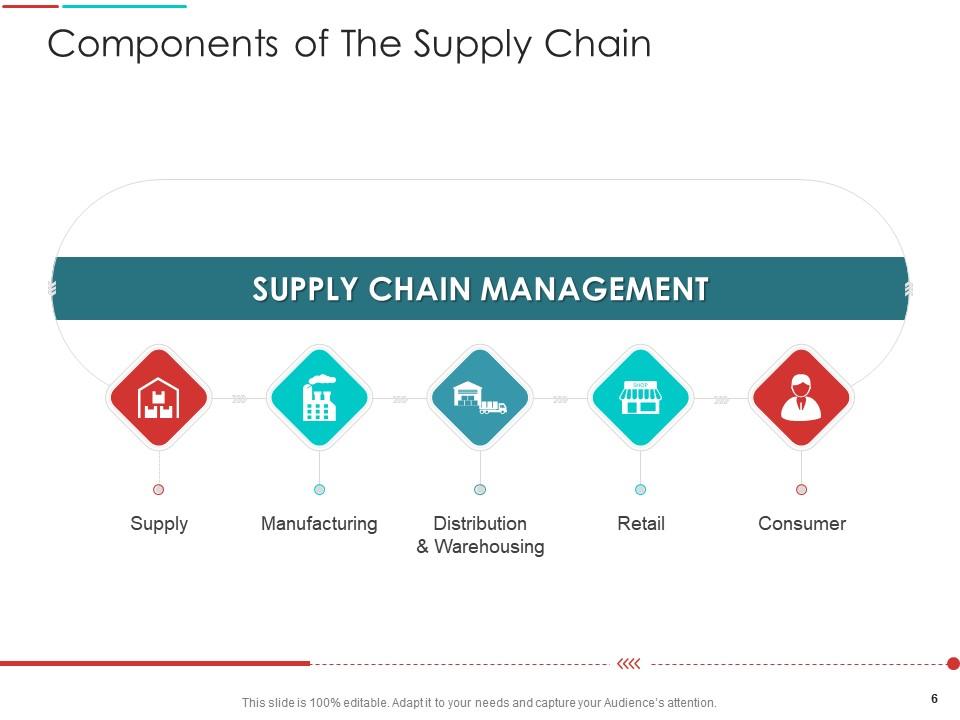
Slide 6: This slide shows Components of The Supply Chain.
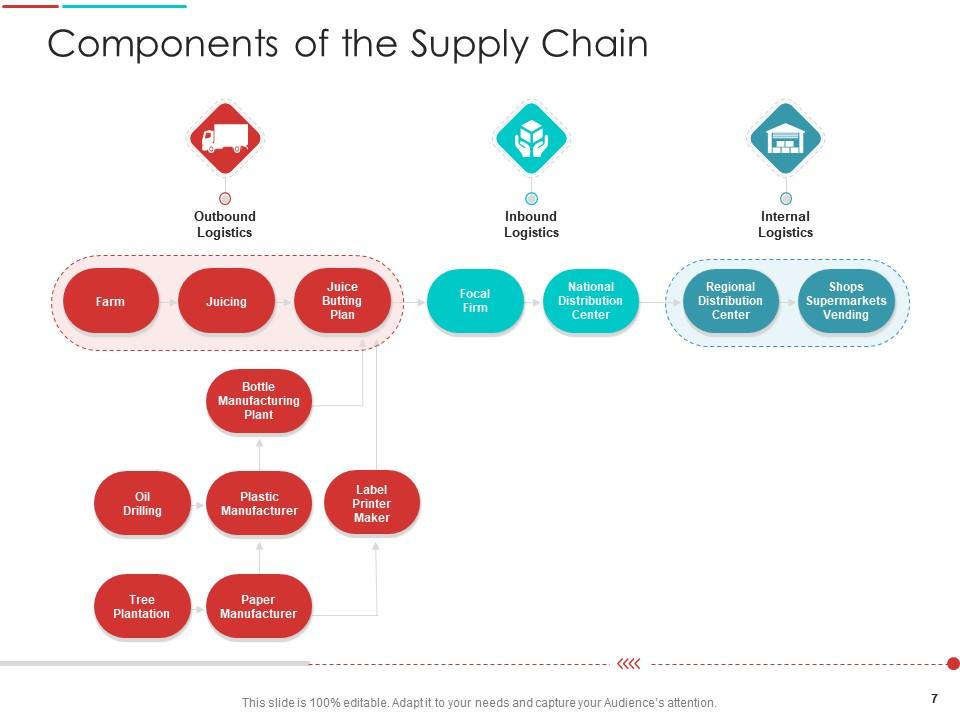
Slide 7: This is another slide showing Components of the Supply Chain.
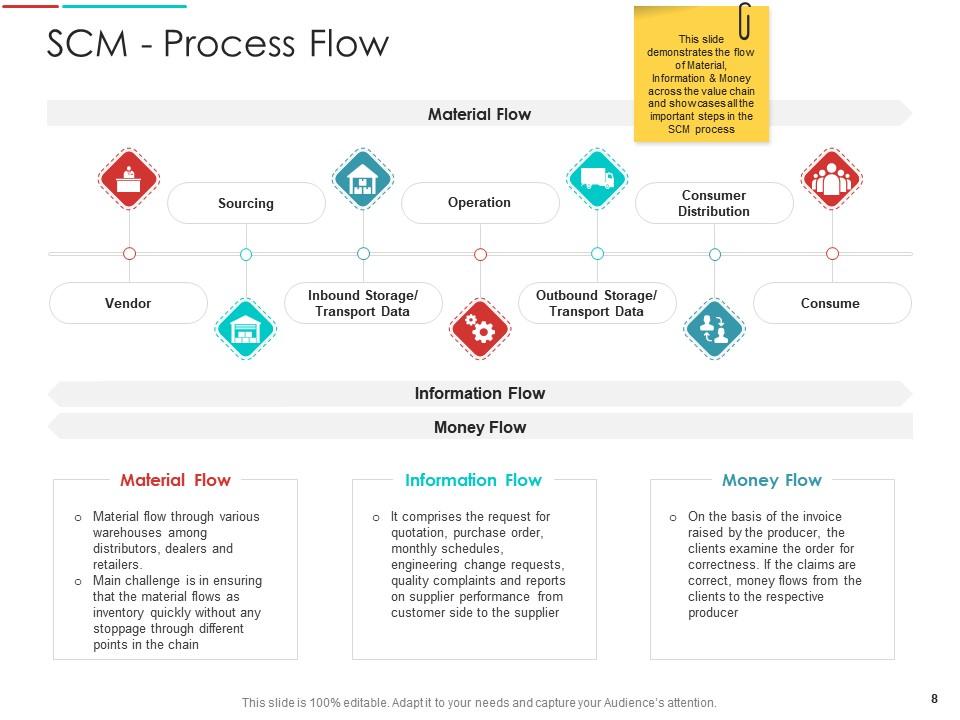
Slide 8: This slide demonstrates the flow of Material, Information & Money across the value chain.
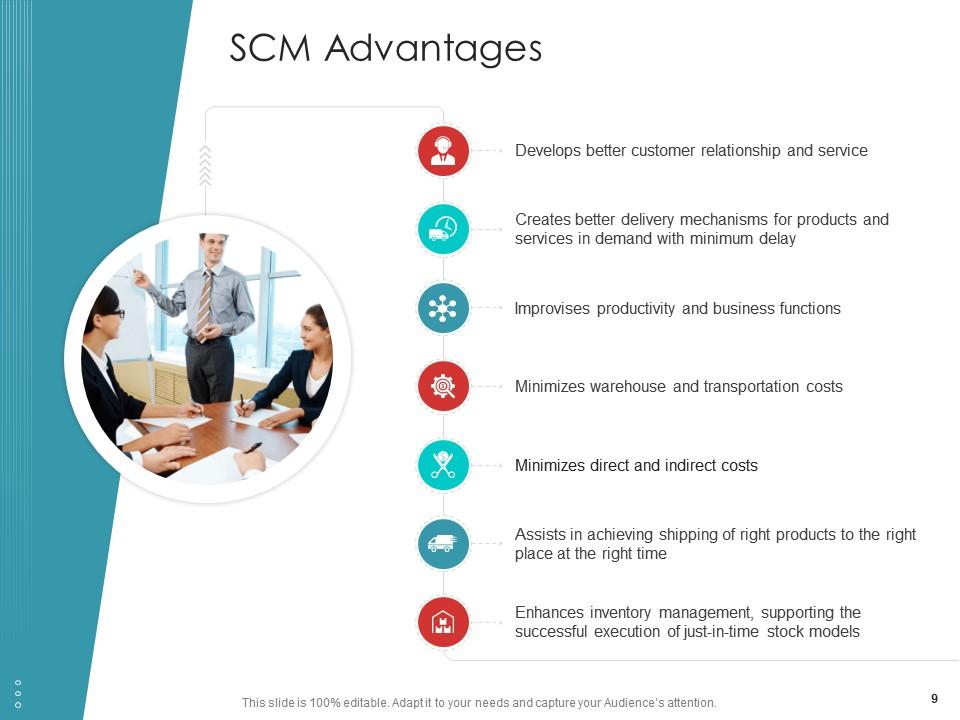
Slide 9: This slide shows SCM Advantages for products and services in demand with minimum delay.
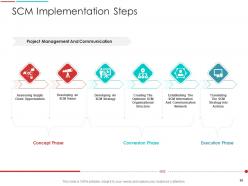
Slide 10: This slide displays SCM Implementation Steps describing- Concept Phase, Conversion Phase, Execution Phase, etc.
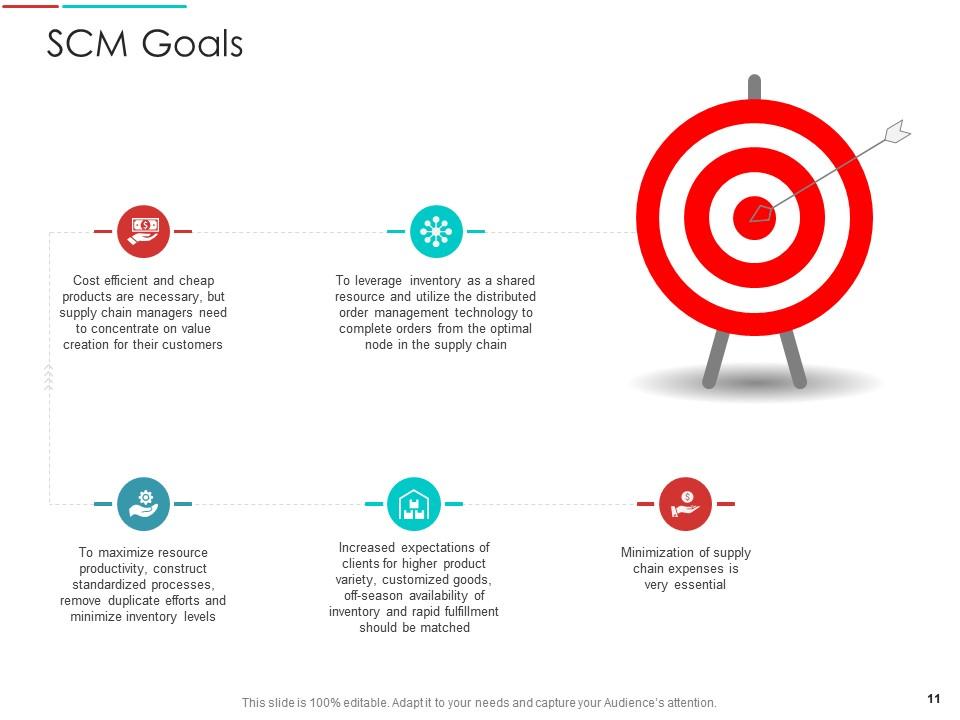
Slide 11: This slide shows SCM Goals to leverage inventory as a shared resource and utilize the distributed order management technology.
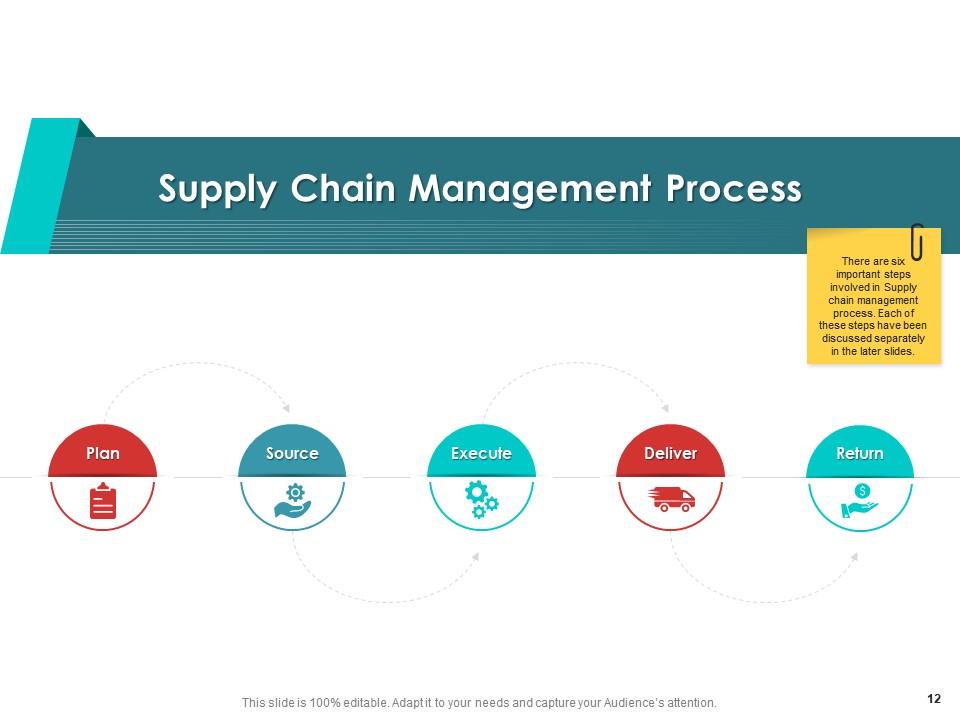
Slide 12: This slide shows Supply Chain Management Process.
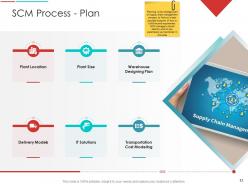
Slide 13: This slide presents SCM Process - Plan.
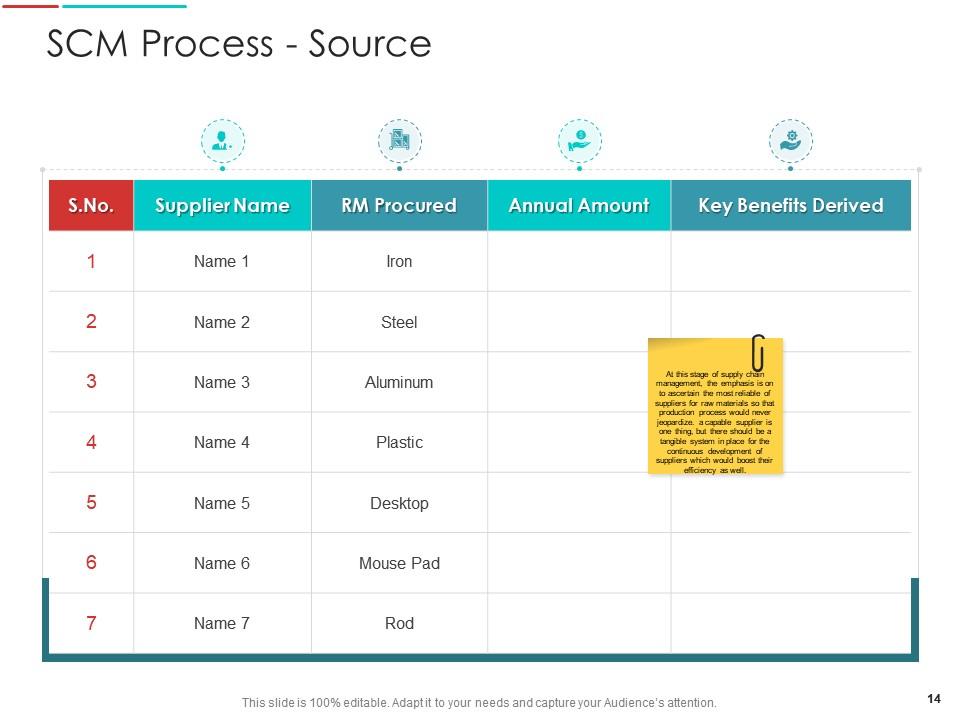
Slide 14: This slide shows SCM Process - Source.
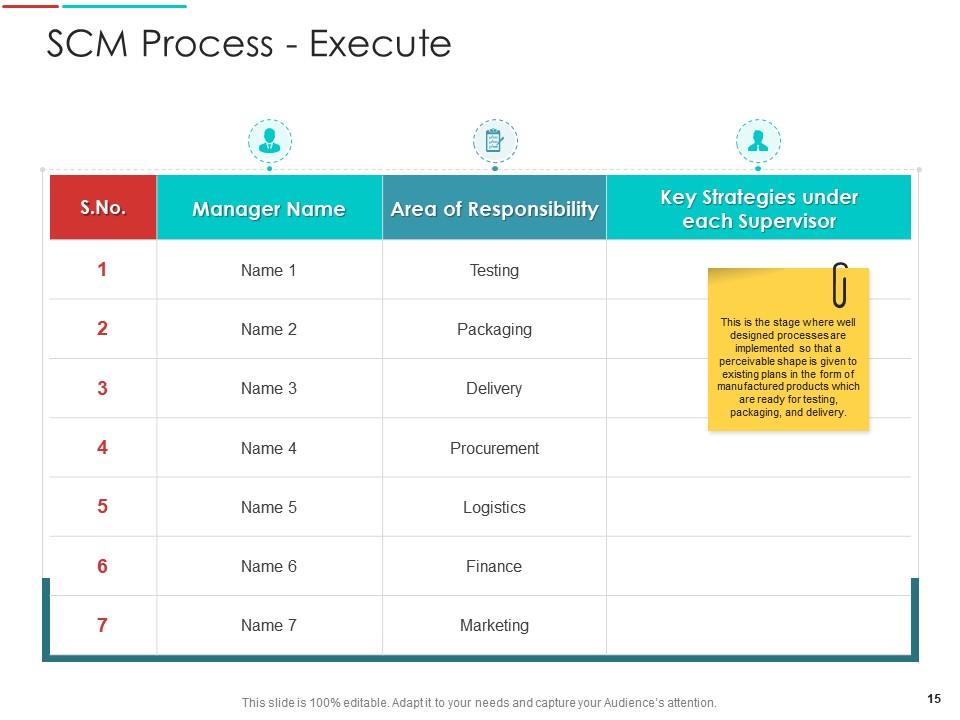
Slide 15: This slide displays SCM Process - Execute.
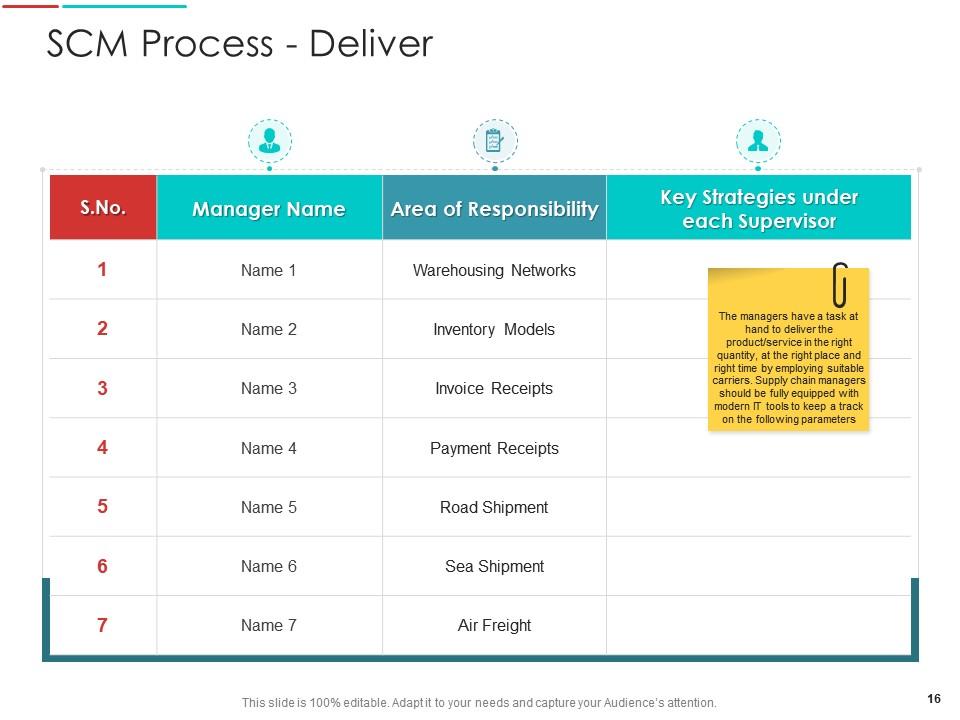
Slide 16: This slide shows SCM Process - Deliver.
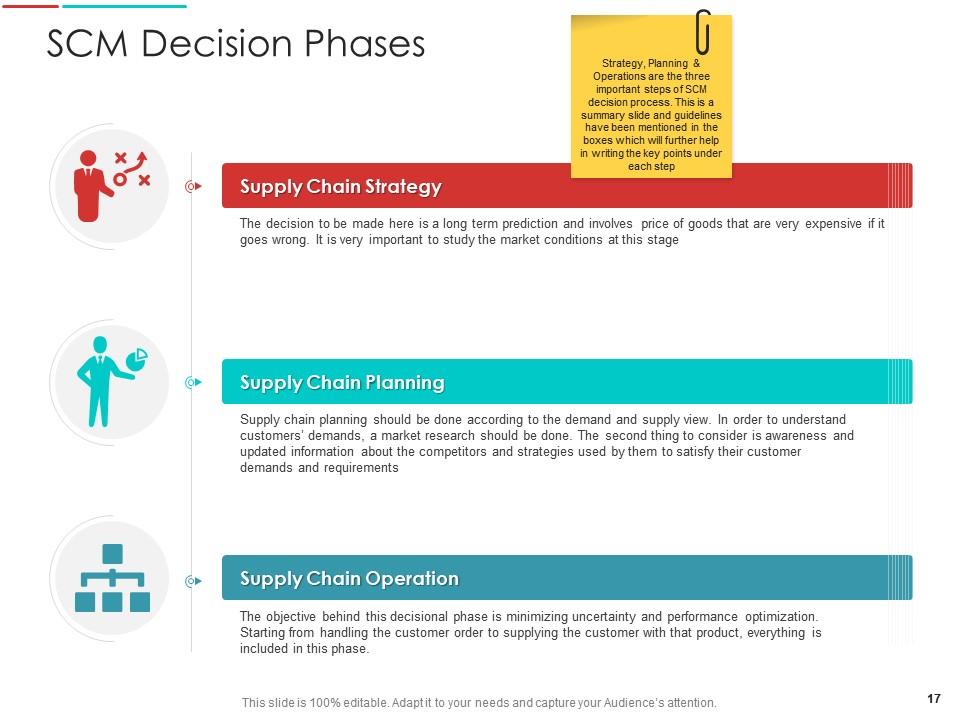
Slide 17: This slide shows SCM Decision Phases describing- Supply Chain Strategy, Supply Chain Planning, Supply Chain Operation, etc.
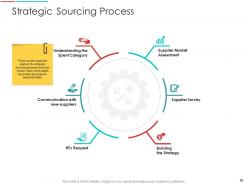
Slide 18: This slide presents Strategic Sourcing Process describing- Supplier Market Assessment, Supplier Survey, Building the Strategy, etc.
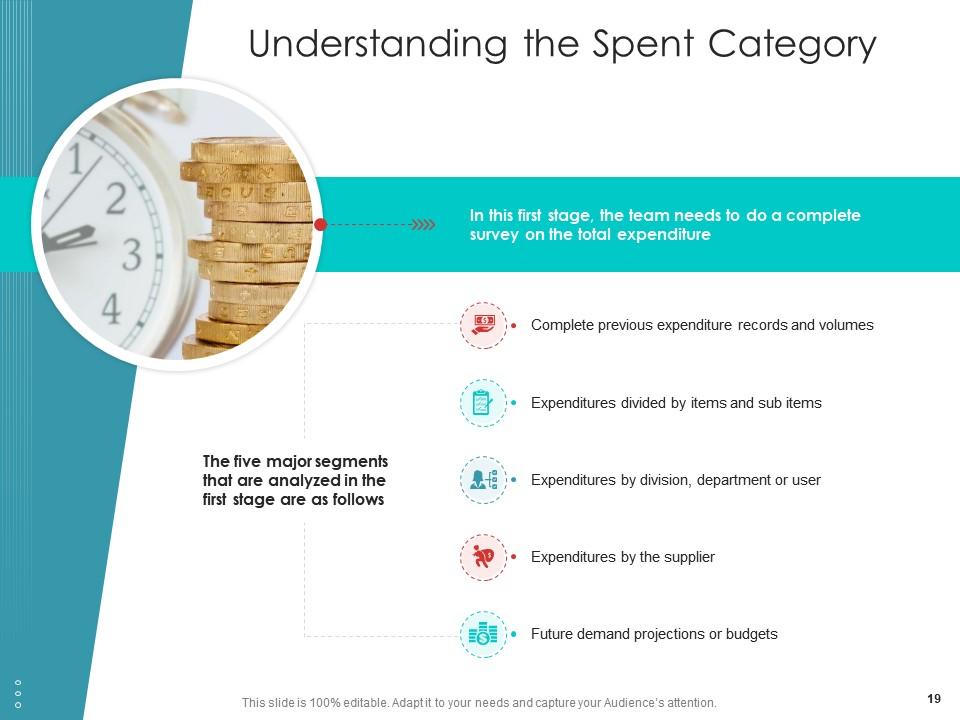
Slide 19: This slide shows Understanding the Spent Category.
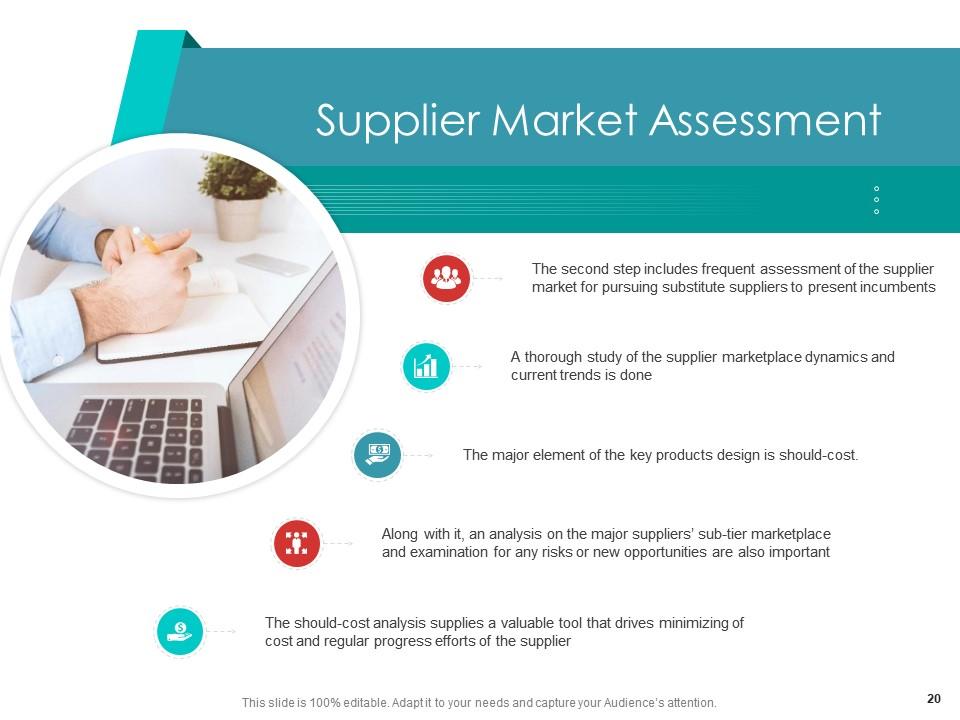
Slide 20: This slide displays Supplier Market Assessment.
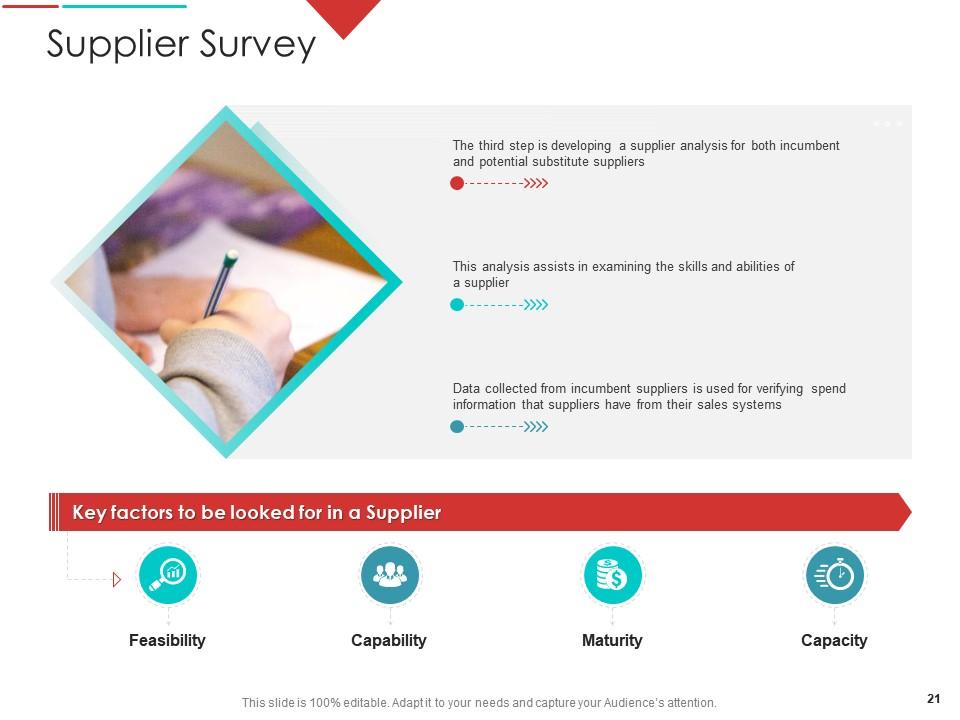
Slide 21: This slide shows Supplier Survey describing- Feasibility, Capability, Maturity, etc.
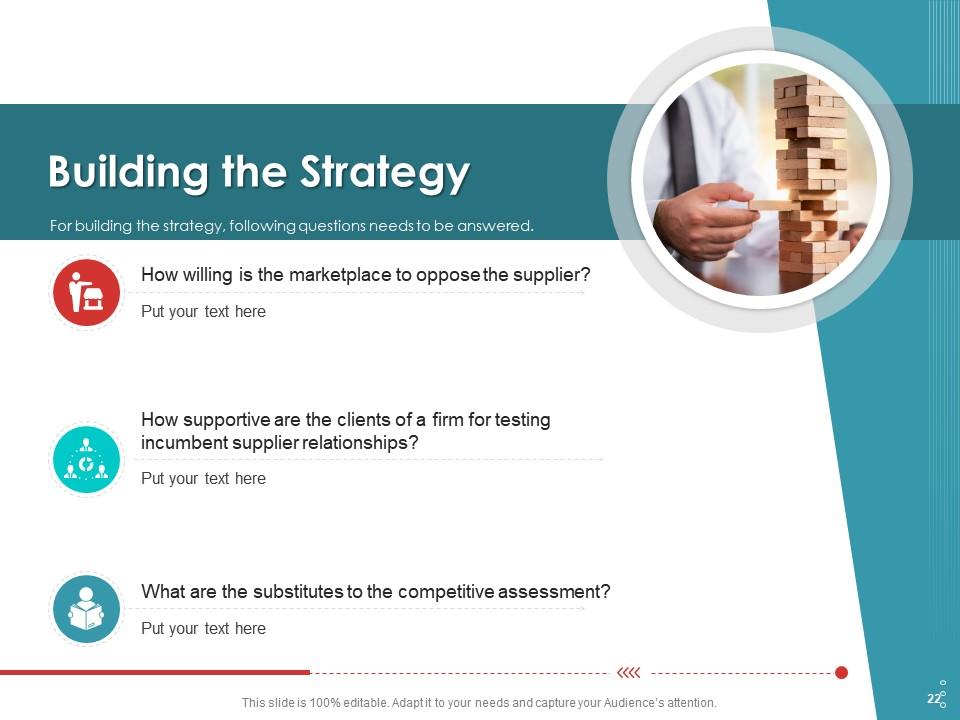
Slide 22: This slide shows Building the Strategy.
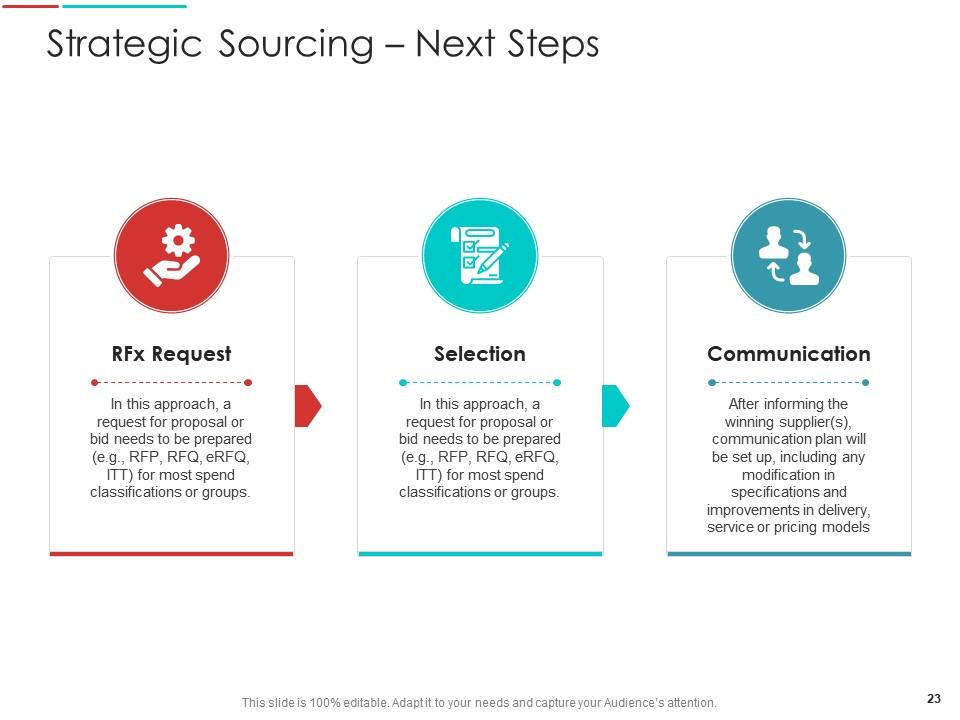
Slide 23: This slide presents Strategic Sourcing – Next Steps.
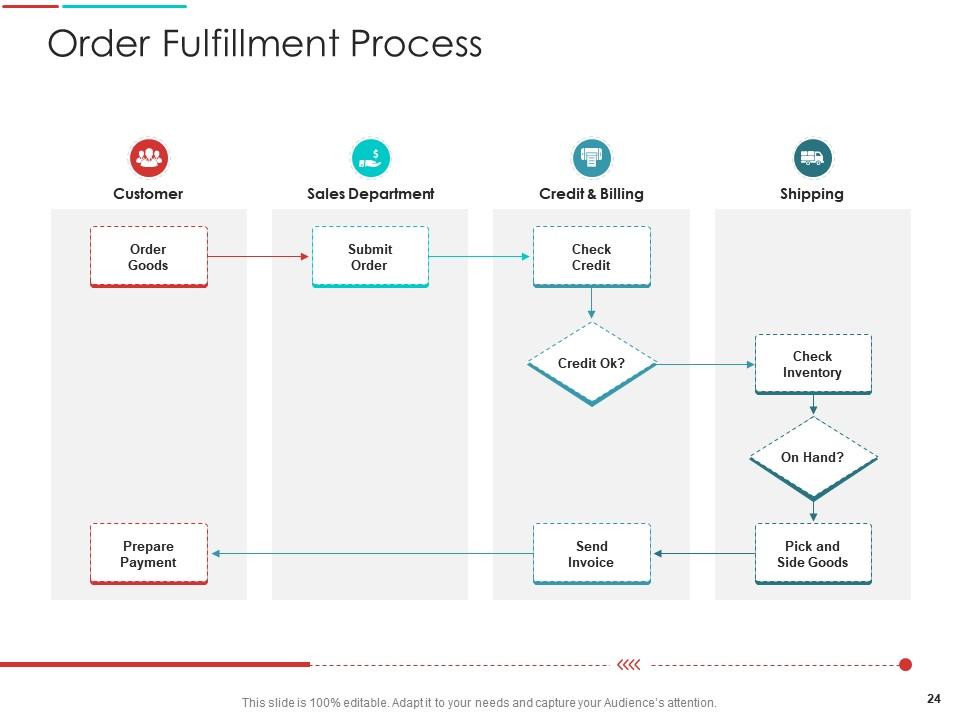
Slide 24: This slide shows Order Fulfillment Process.
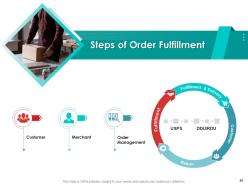
Slide 25: This slide displays Steps of Order Fulfillment.
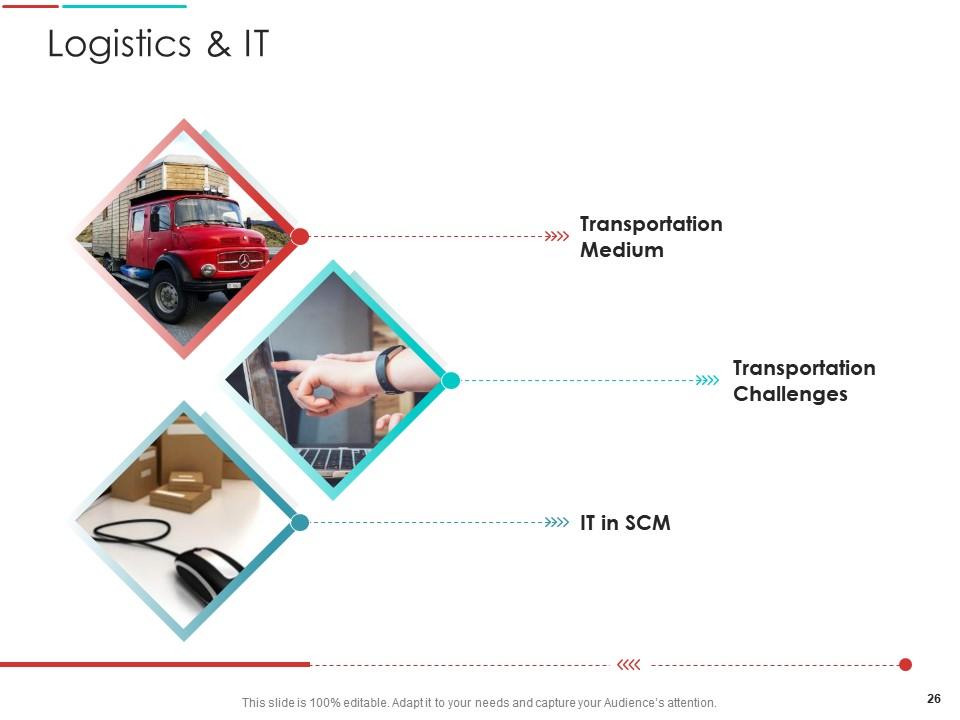
Slide 26: This slide shows Logistics & IT describing- Transportation Medium, IT in SCM, Transportation Challenges, etc.
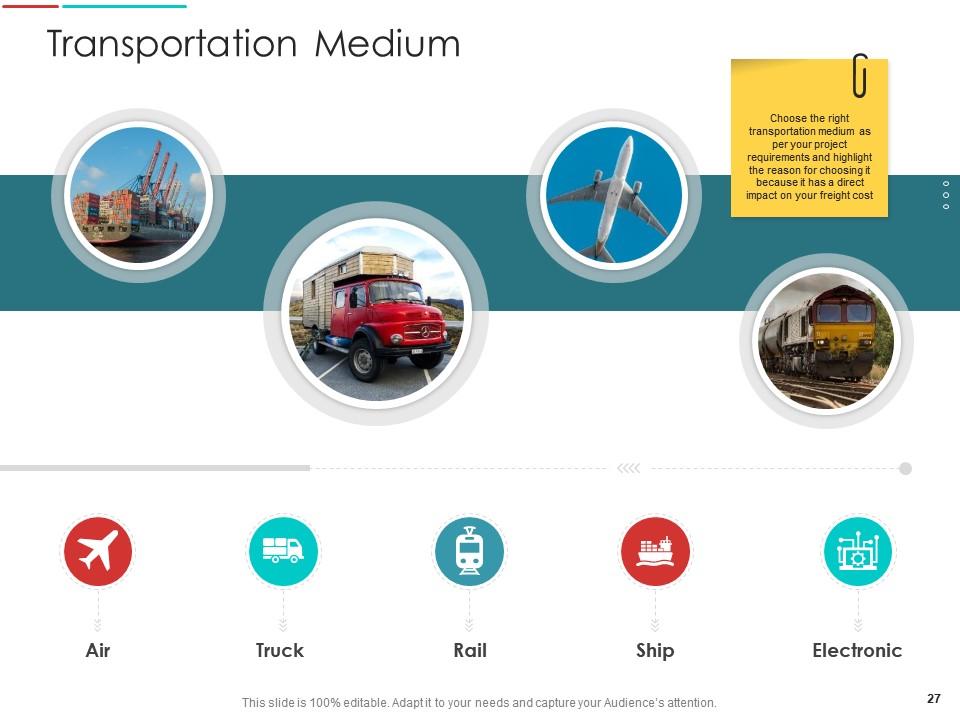
Slide 27: This slide shows Transportation Medium.
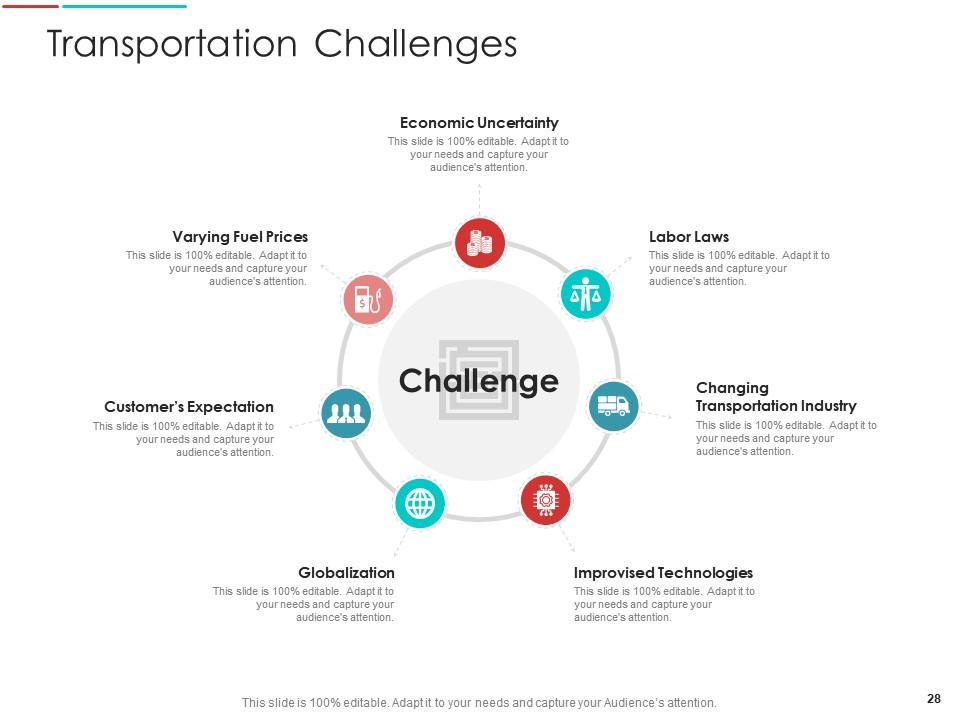
Slide 28: This slide presents Transportation Challenges describing- Economic Uncertainty, Labor Laws, Improvised Technologies, etc.
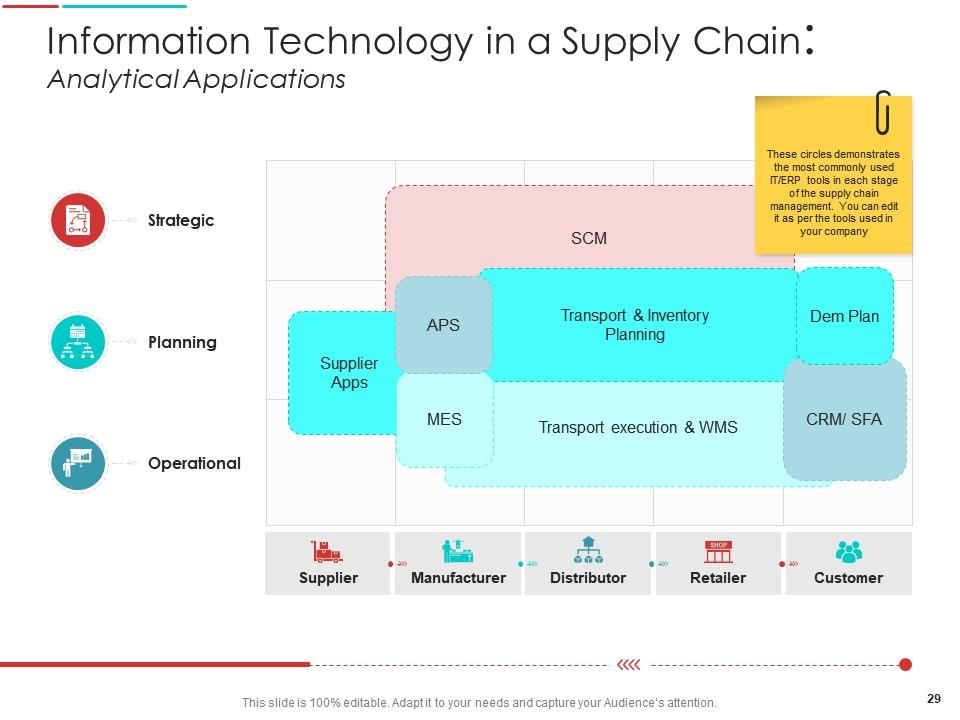
Slide 29: This slide shows Information Technology in a Supply Chain Analytical Applications.
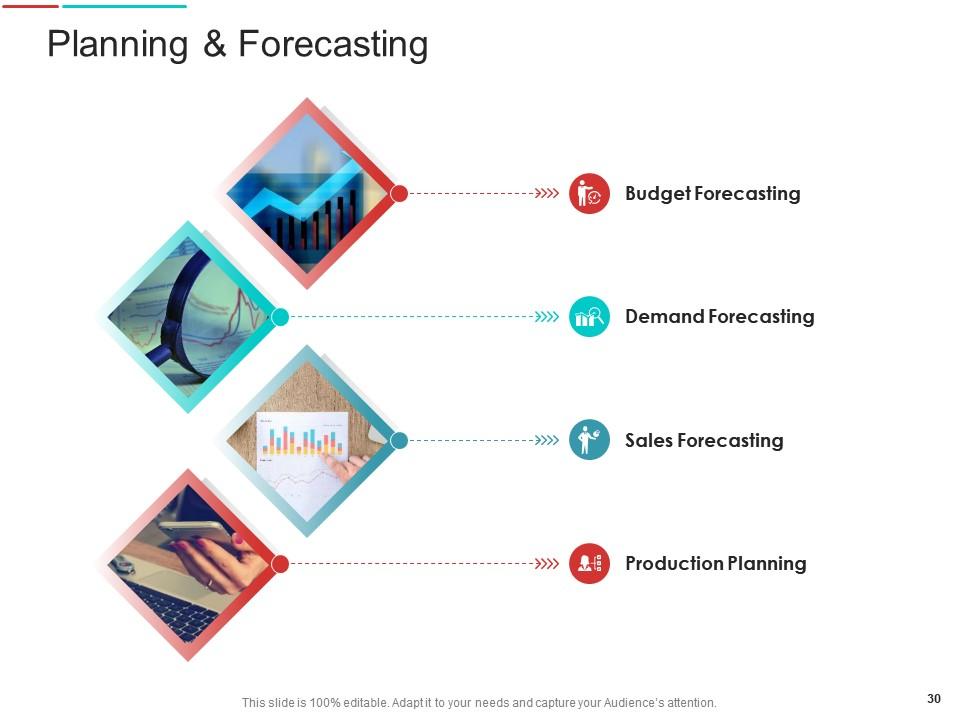
Slide 30: This slide displays Planning & Forecasting describing- Budget Forecasting, Demand Forecasting, Sales Forecasting, etc.
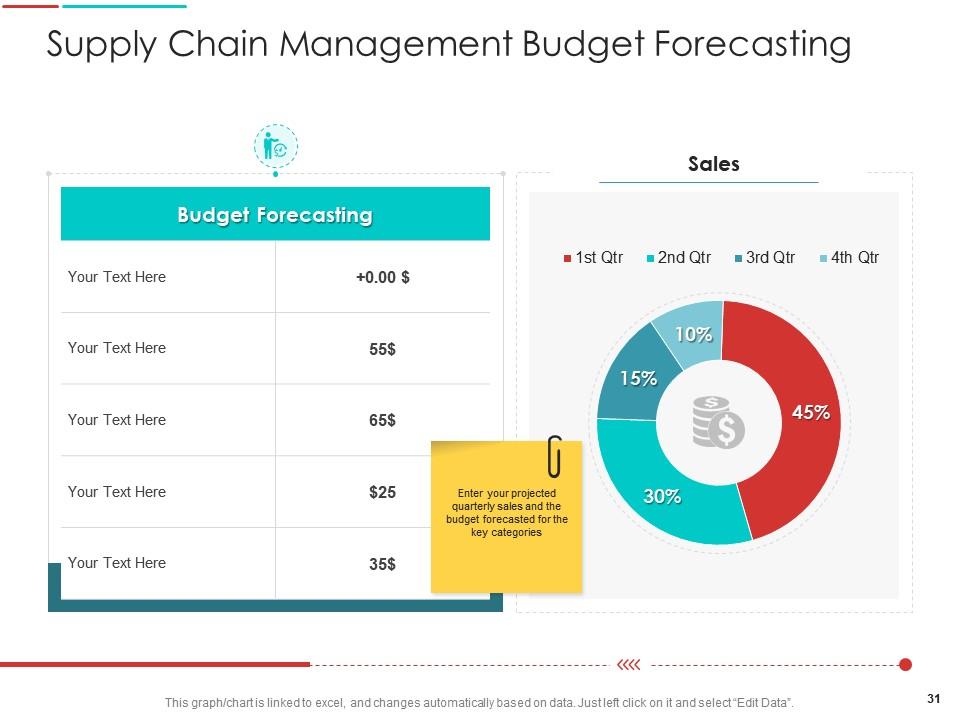
Slide 31: This slide shows Supply Chain Management Budget Forecasting.
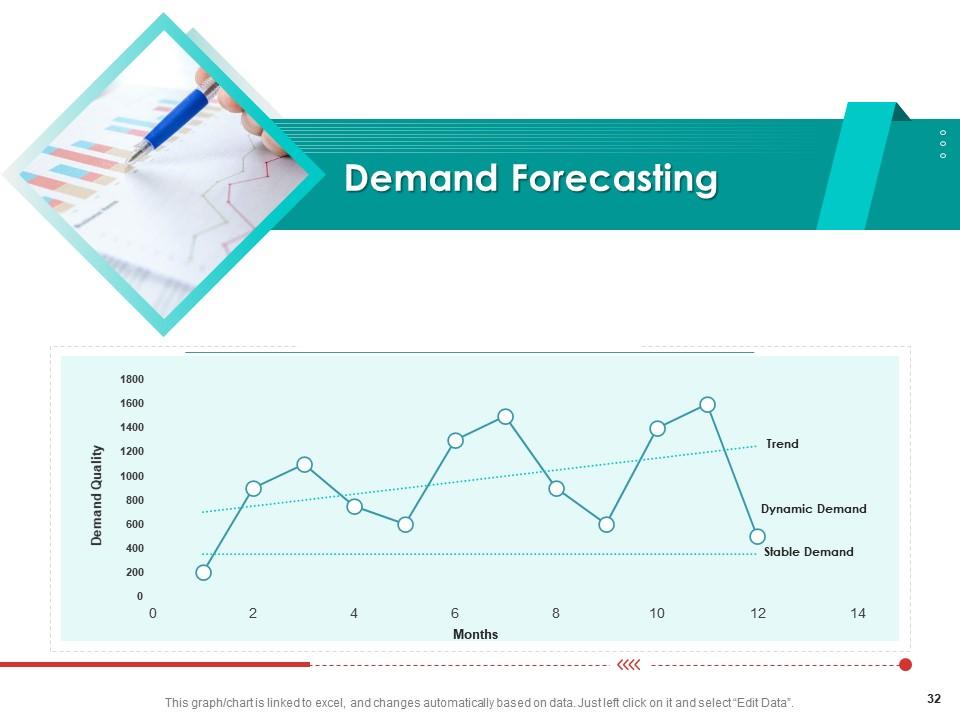
Slide 32: This slide shows Demand Forecasting.
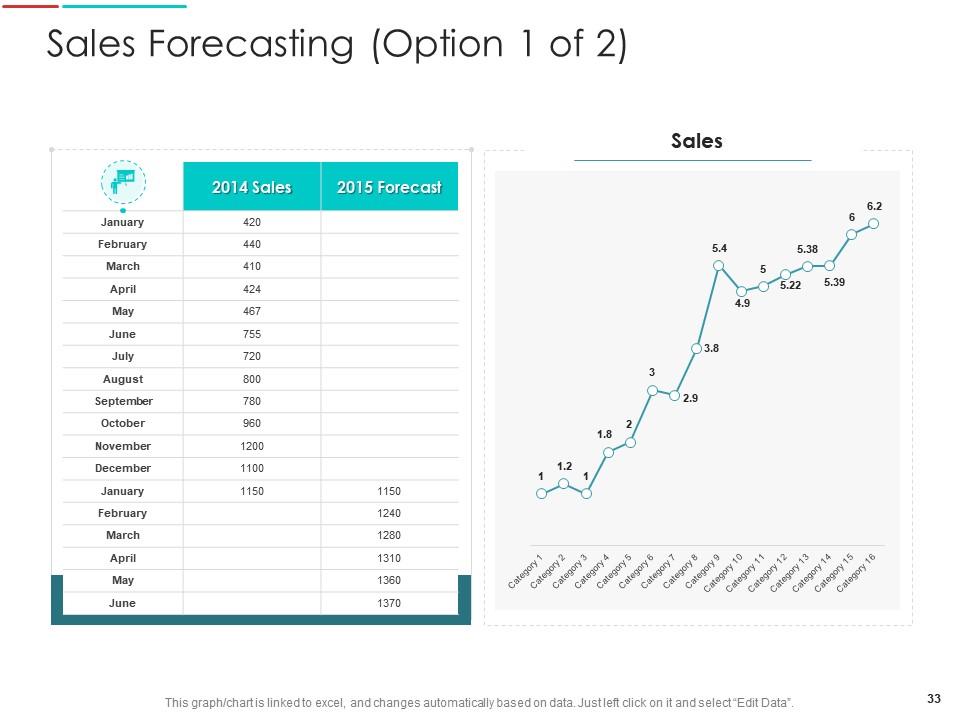
Slide 33: This slide presents Sales Forecasting.
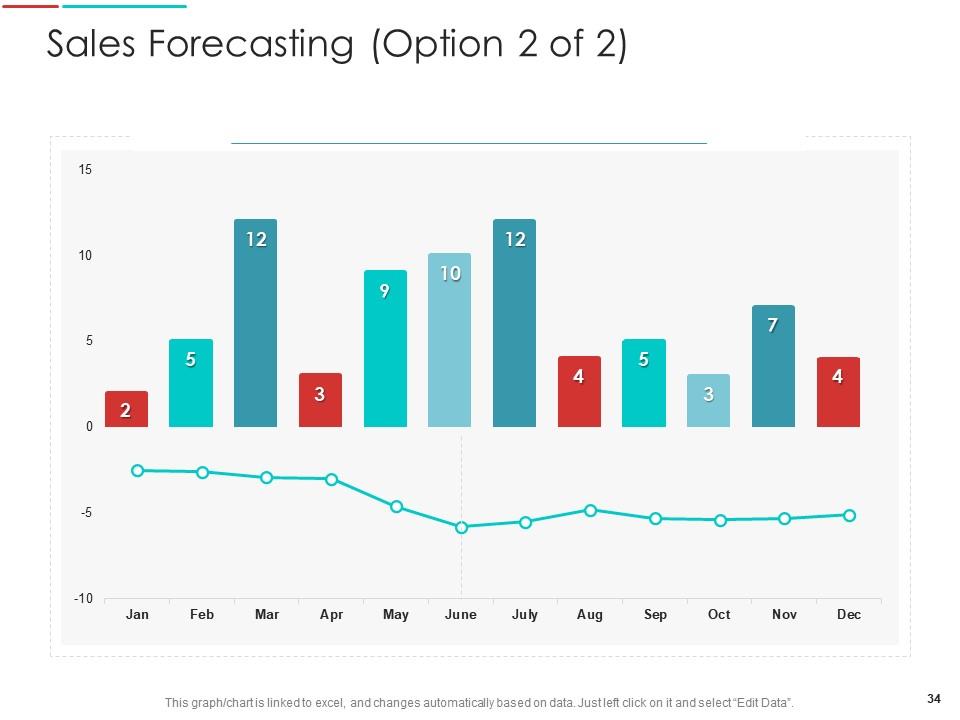
Slide 34: This is another slide showing Sales Forecasting.
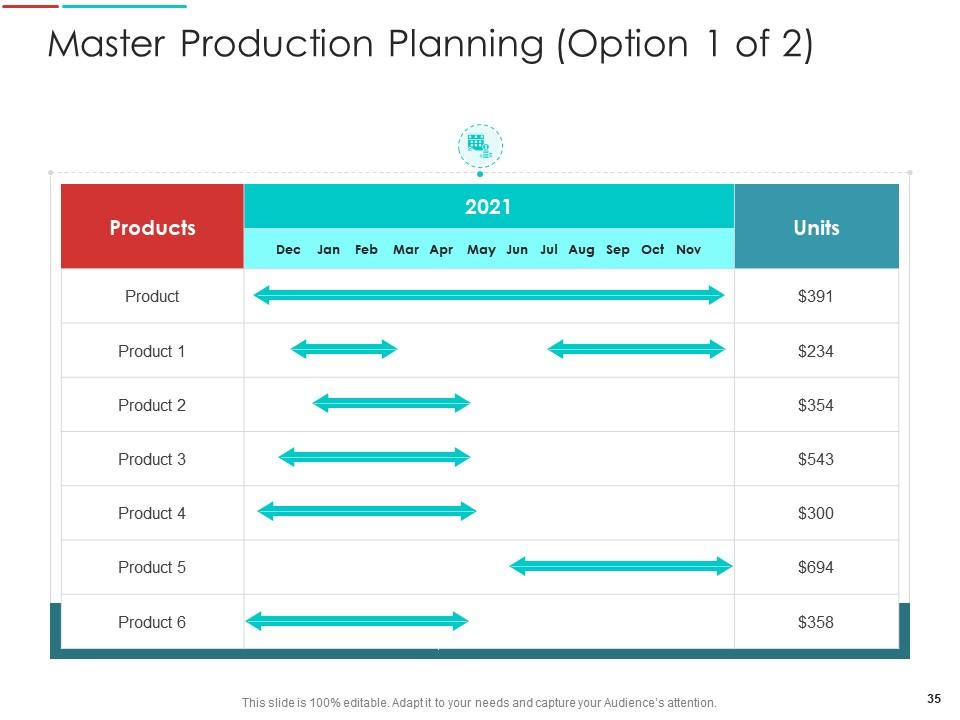
Slide 35: This slide displays Master Production Planning.
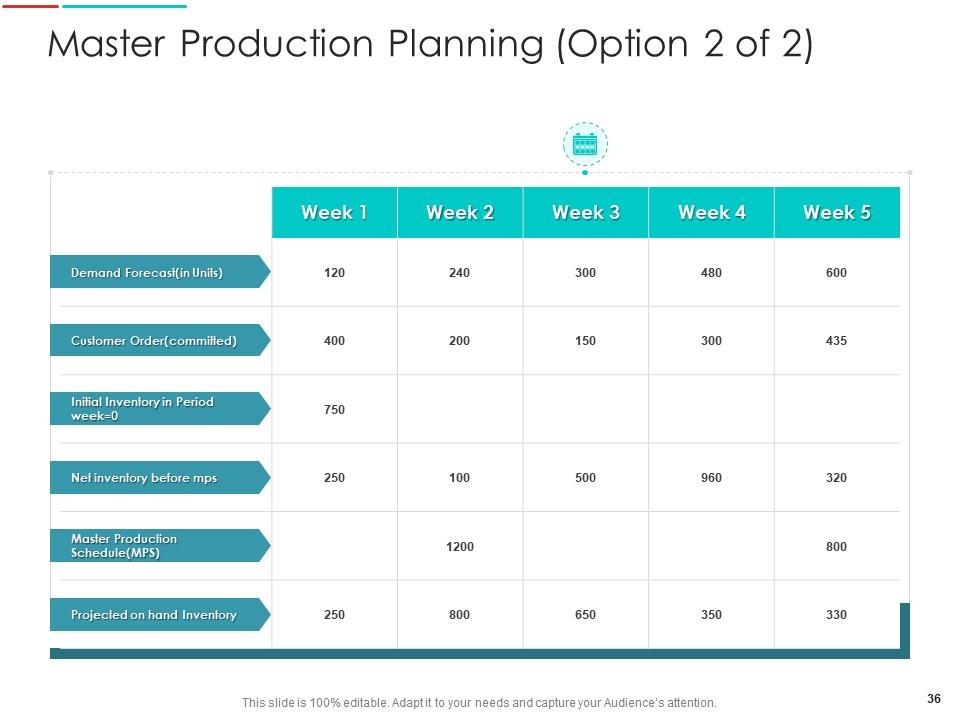
Slide 36: This is another slide showing Master Production Planning.
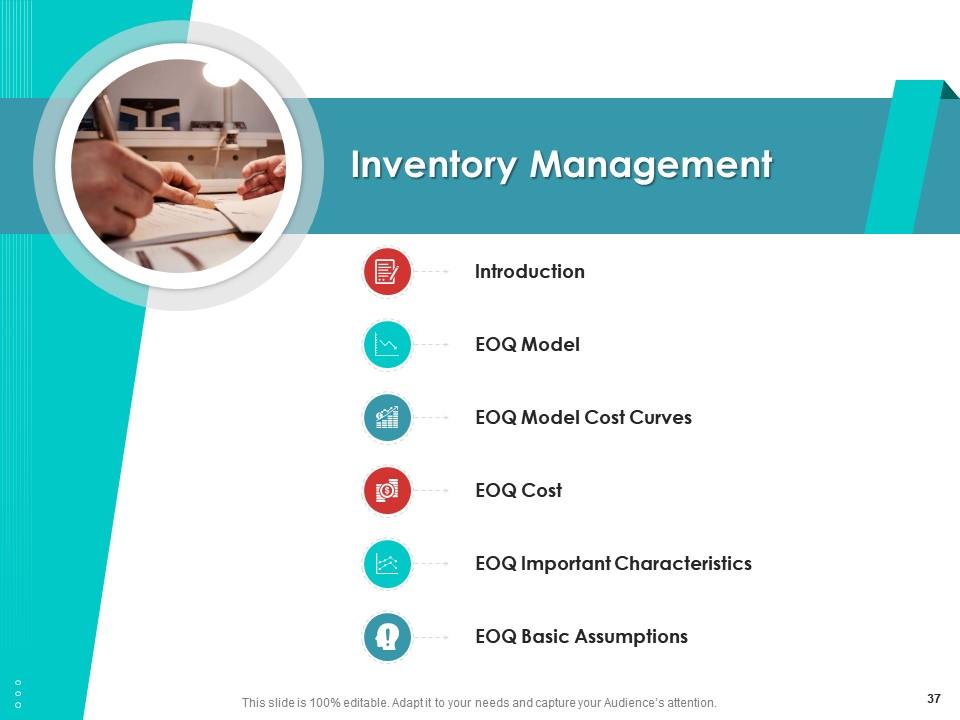
Slide 37: This slide shows Inventory Management describing- Introduction, EOQ Model, EOQ Cost, etc.
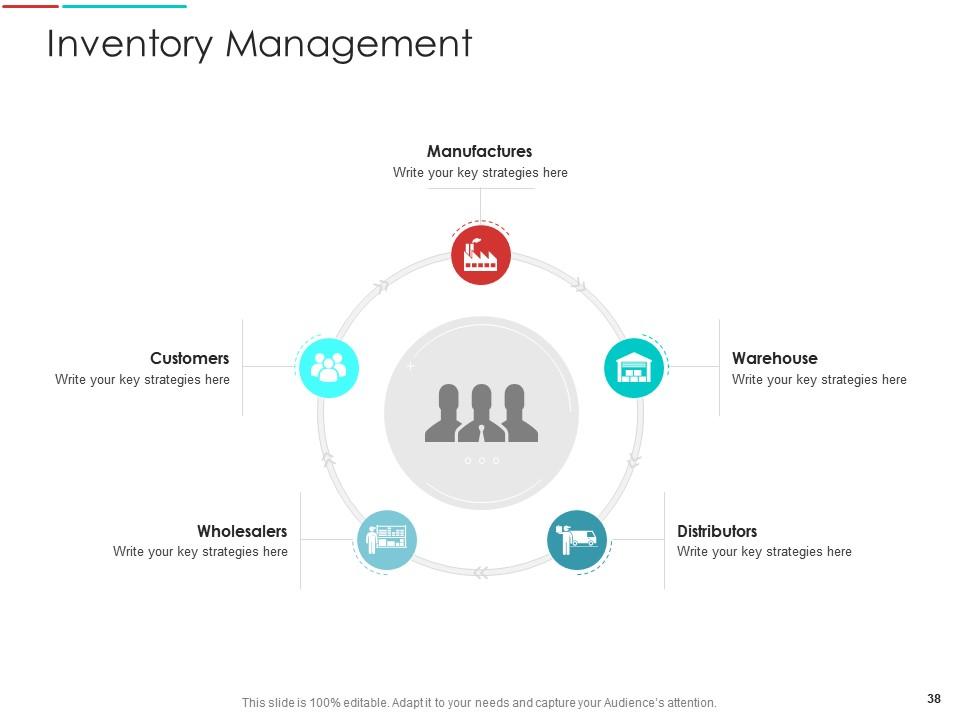
Slide 38: This slide presents Inventory Management describing- Manufactures, Warehouse, Distributors, etc.
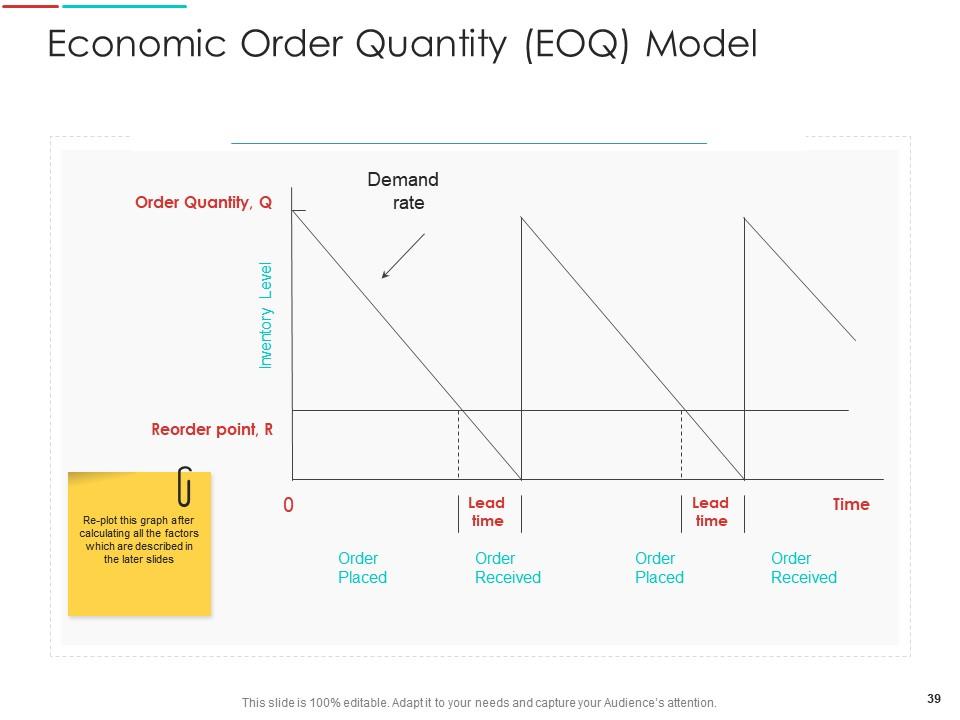
Slide 39: This slide shows Economic Order Quantity (EOQ) Model.
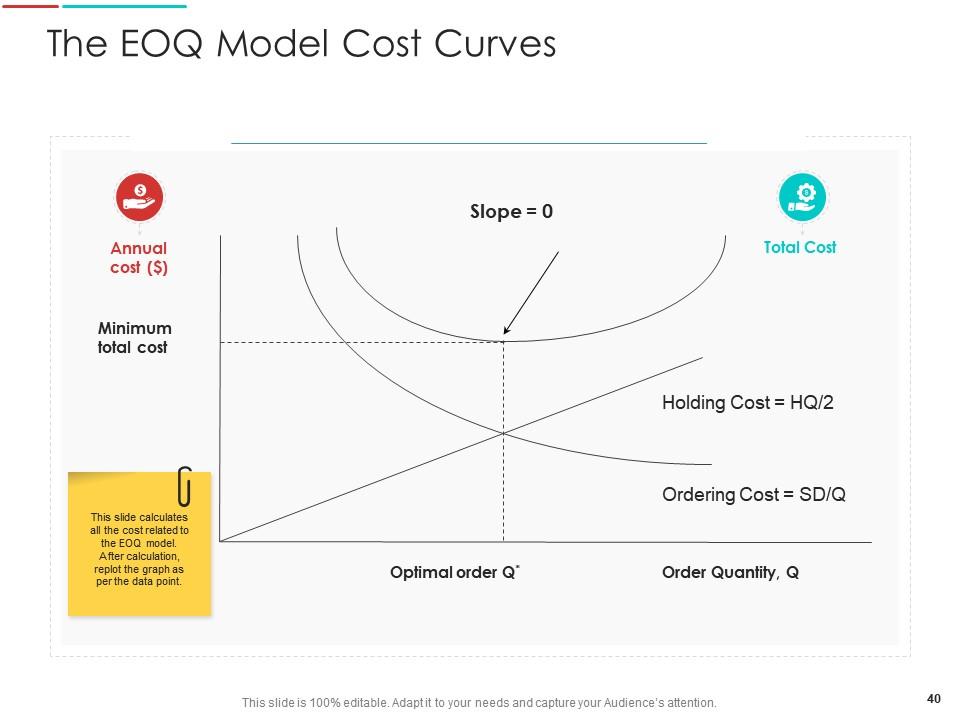
Slide 40: This slide calculates all the cost related to the EOQ model.
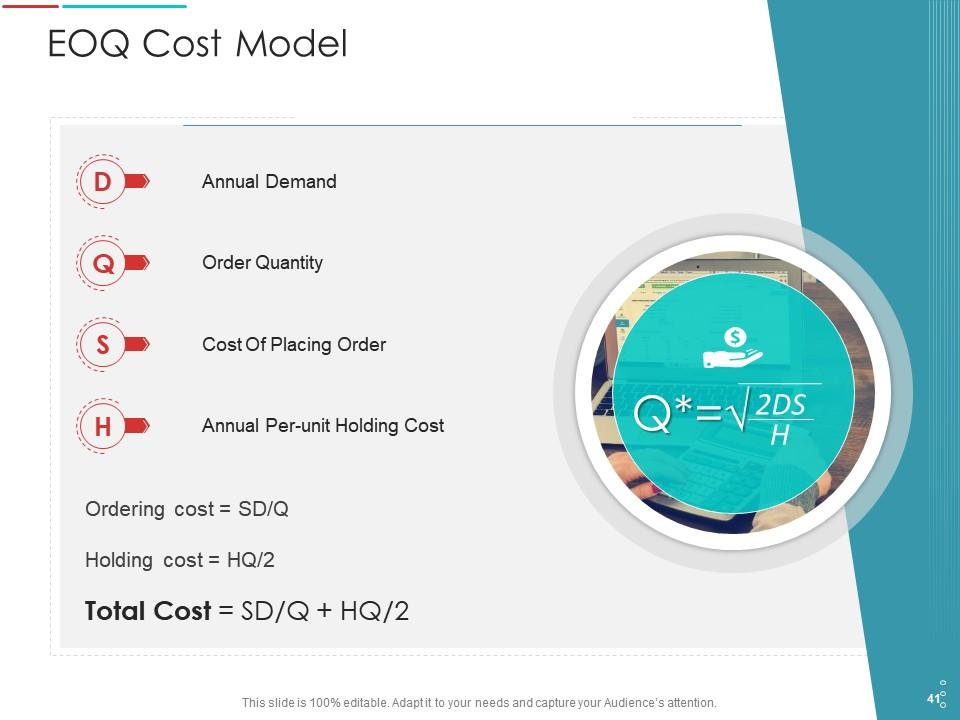
Slide 41: This slide displays EOQ Cost Model describing- Order Quantity, Cost Of Placing Order, Annual Per-unit Holding Cost, etc.
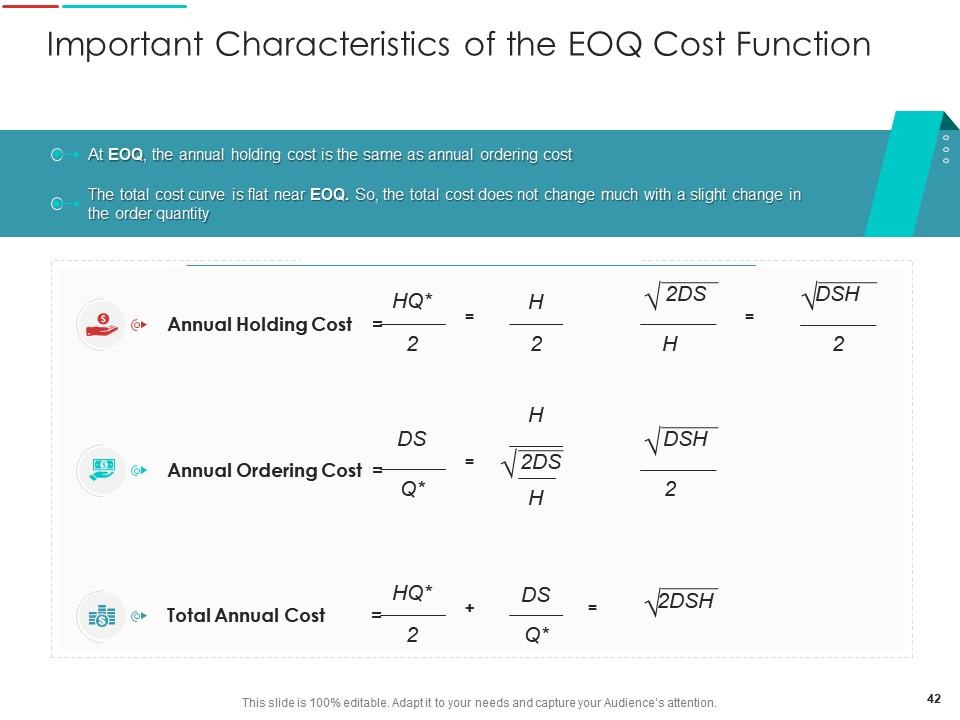
Slide 42: This slide shows Important Characteristics of the EOQ Cost Function.
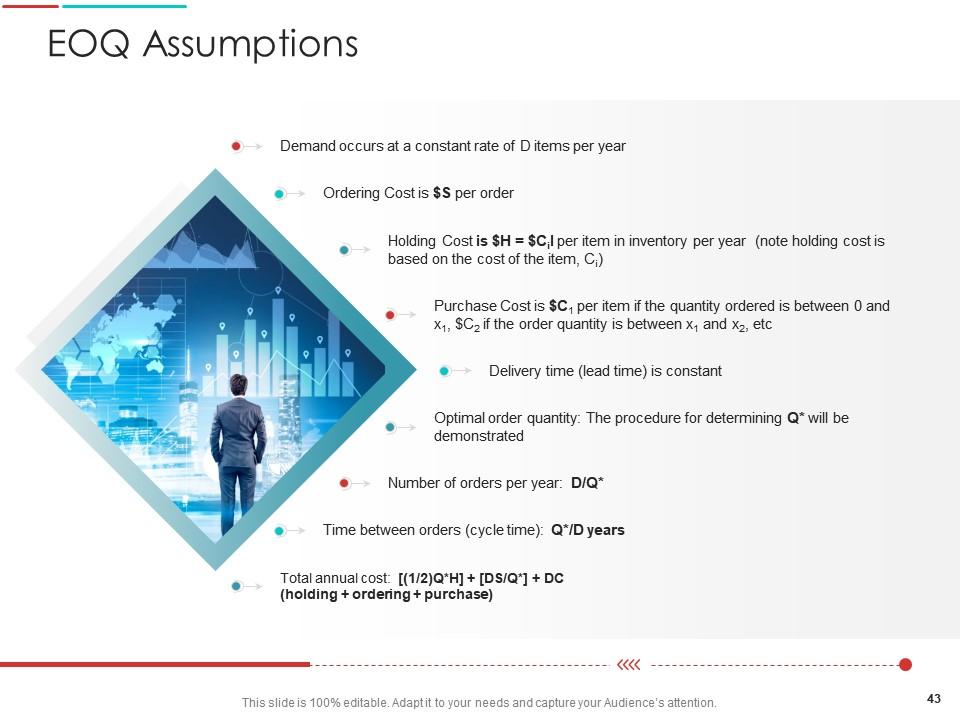
Slide 43: This slide presents EOQ Assumptions.
Slide 44: This slide shows Inventory Management Models like- Stochastic Modeling, Uncertainty Modeling, Bi-level Optimization, etc.
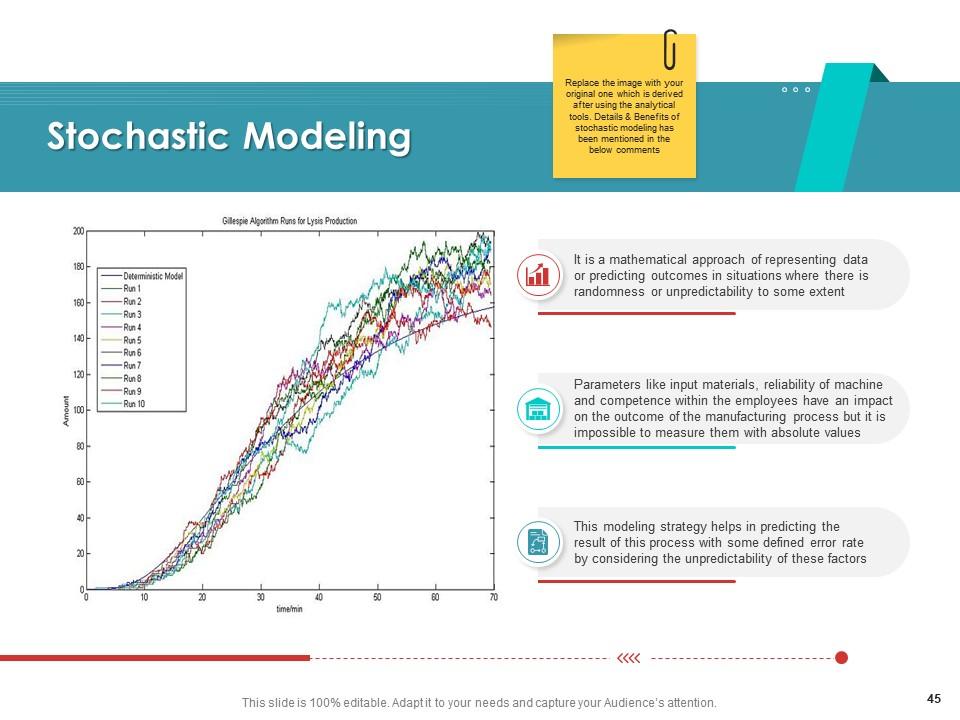
Slide 45: This slide displays Stochastic Modeling Parameters like input materials, reliability of machine and competence.
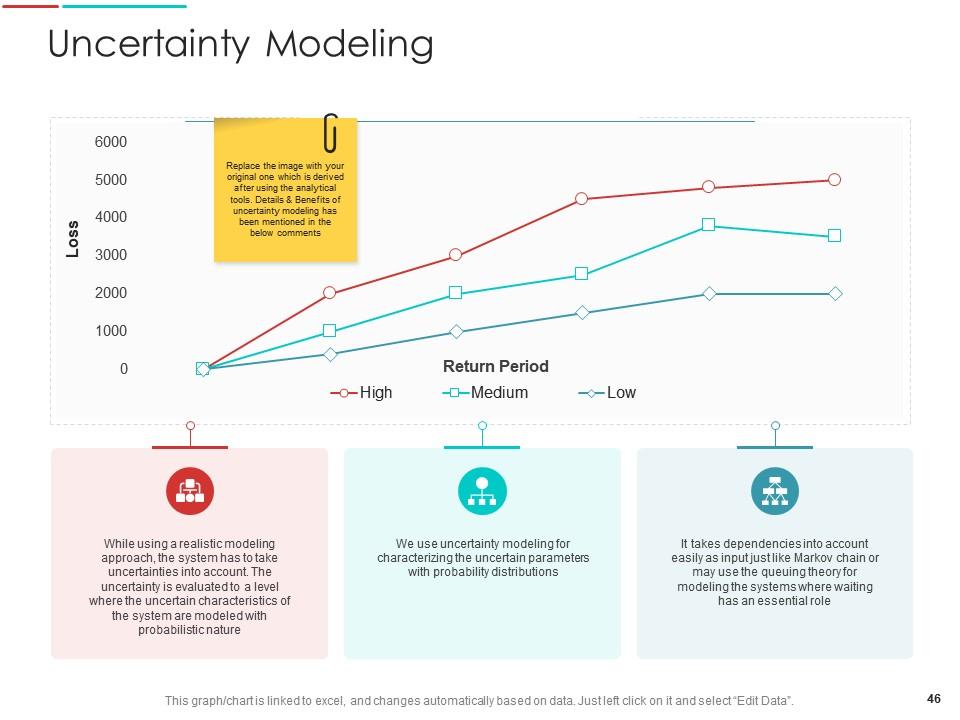
Slide 46: This slide shows Uncertainty Modeling.
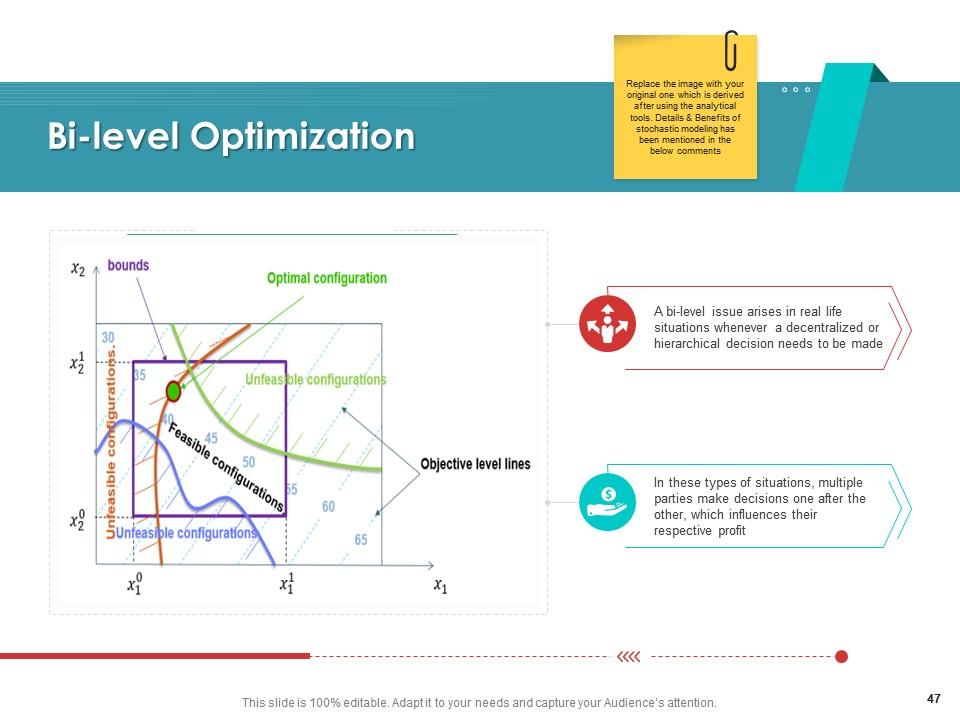
Slide 47: This slide shows Bi-level Optimization in real life situations.
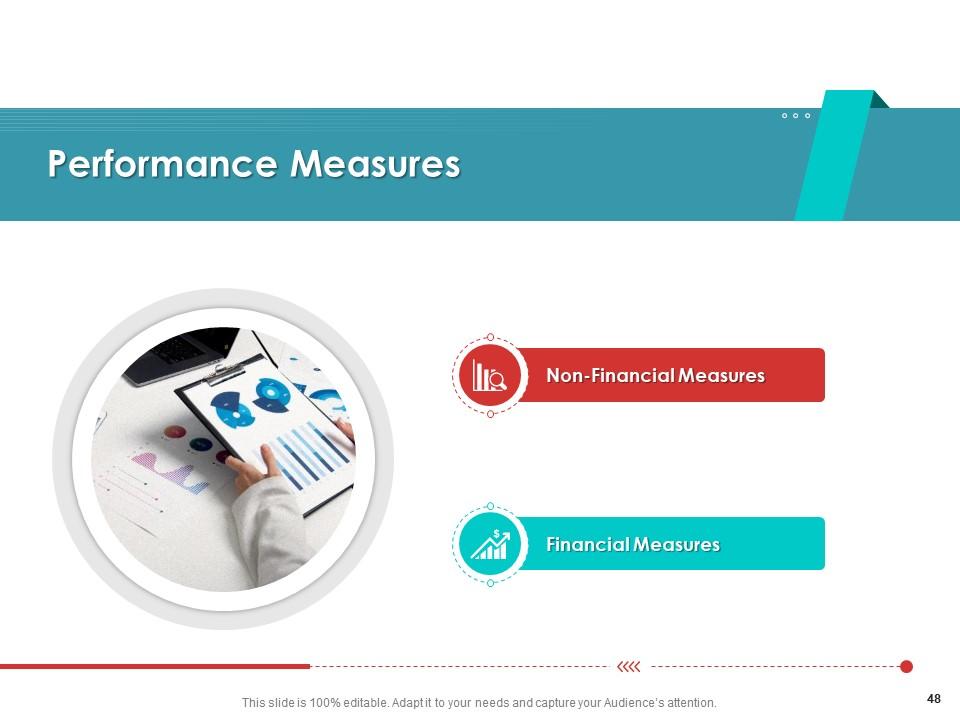
Slide 48: This slide presents Performance Measures i.e.- Non-Financial Measures, Financial Measures, etc.
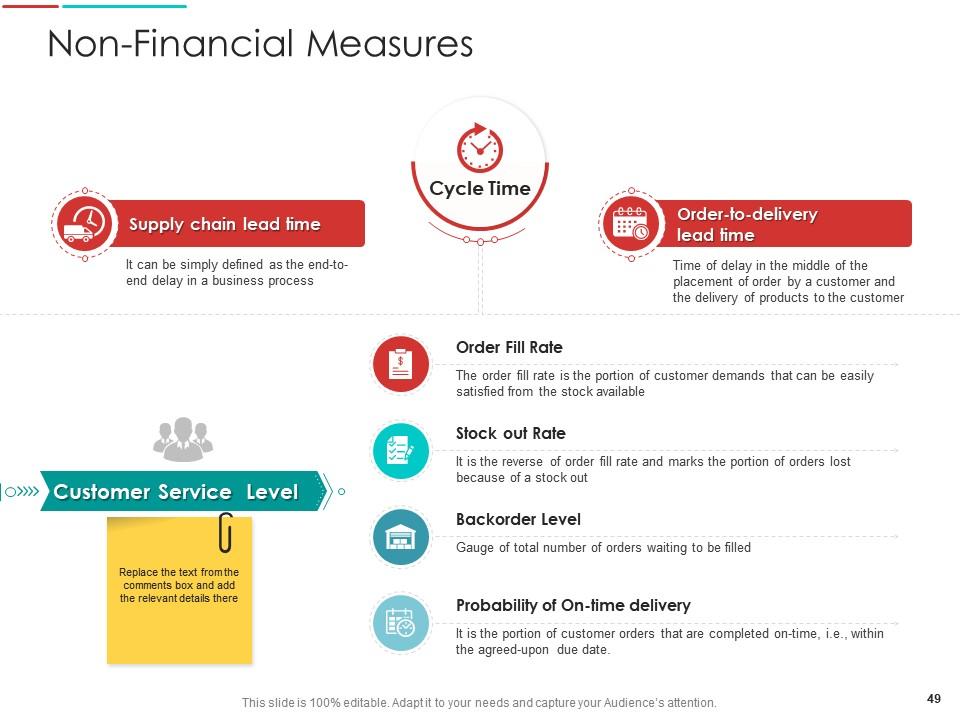
Slide 49: This slide shows Non-Financial Measures i.e.- Supply chain lead time, Order-to-delivery, Stock out Rate, etc.
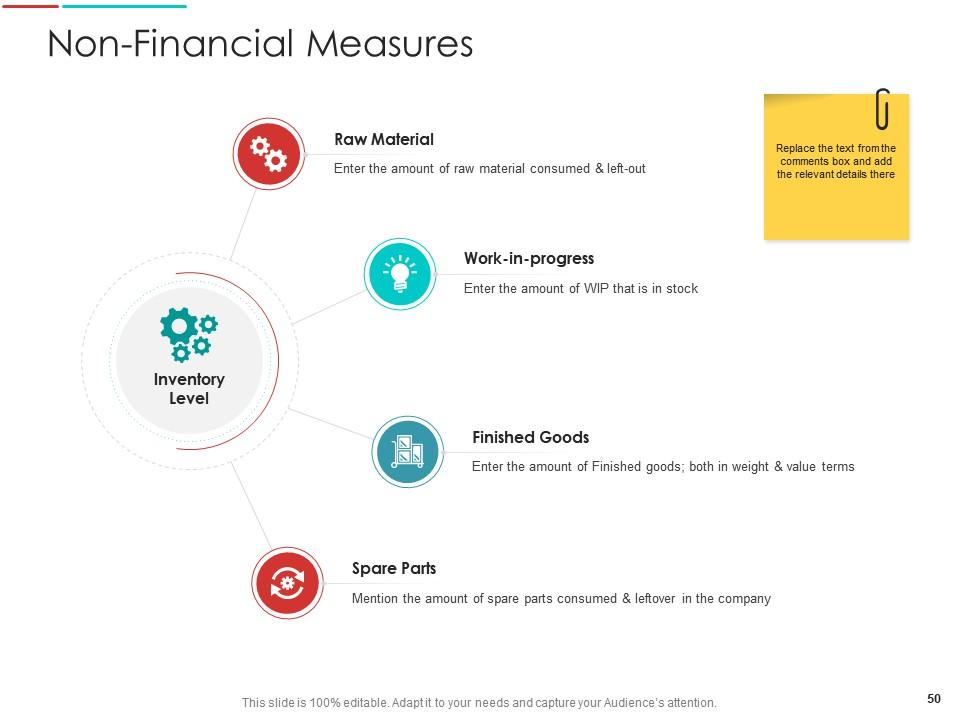
Slide 50: This slide displays Non-Financial Measures like- Raw Material, Work-in-progress, Finished Goods, etc.
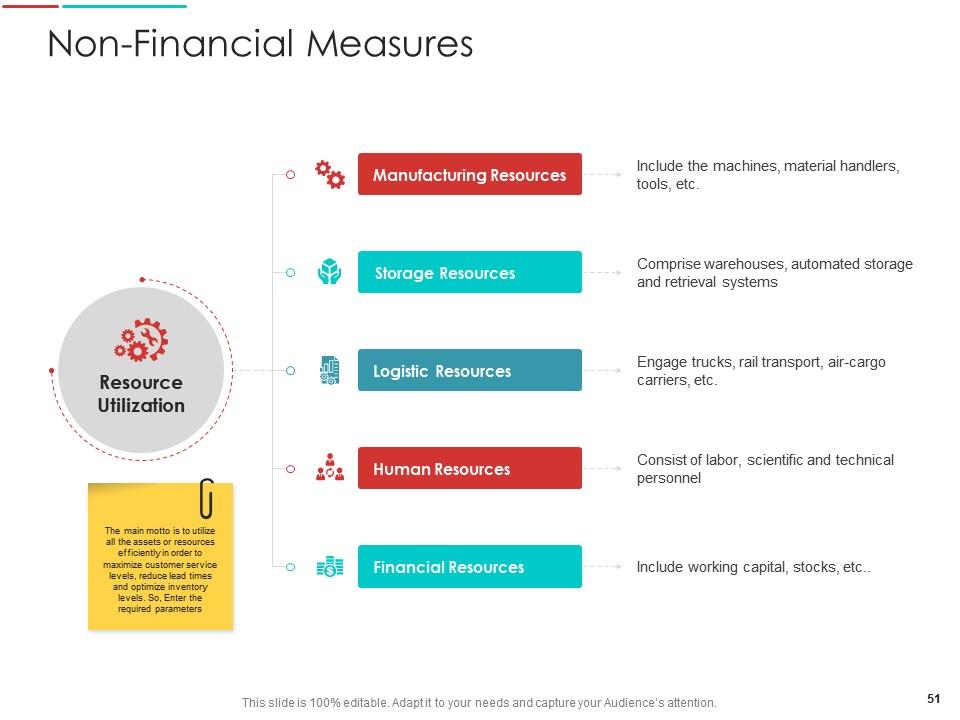
Slide 51: This slide shows Non-Financial Measures like- Manufacturing Resources, Storage Resources, Logistic Resources, etc.
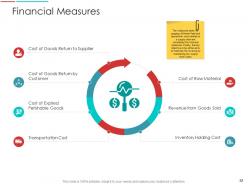
Slide 52: This slide shows Financial Measures describing- Cost of Raw Material, Revenue from Goods Sold, Inventory Holding Cost, etc.
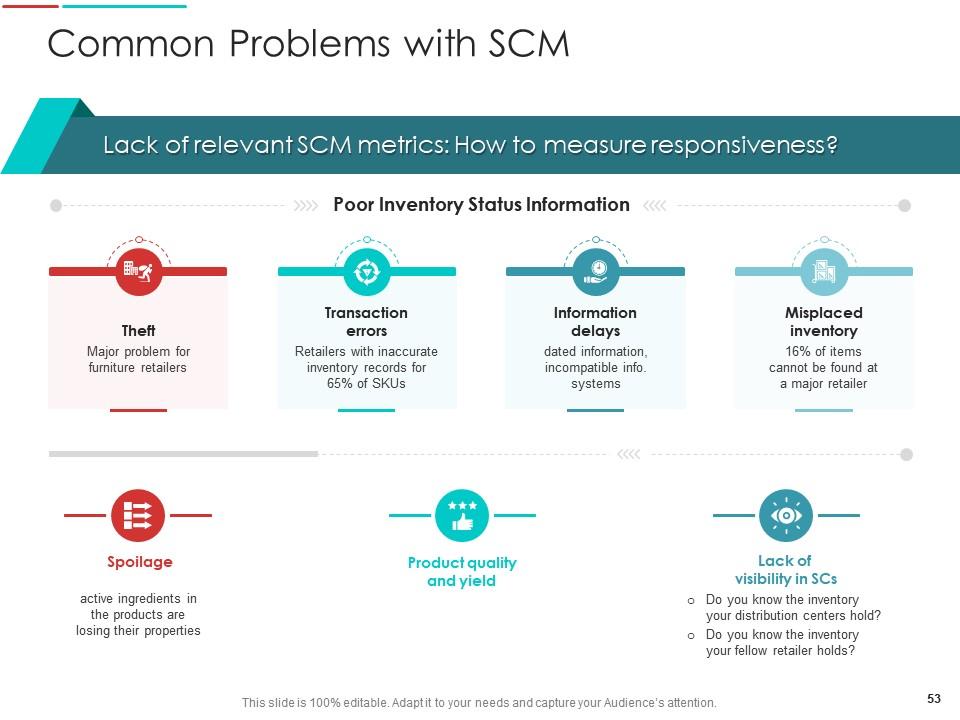
Slide 53: This slide presents Common Problems with SCM.
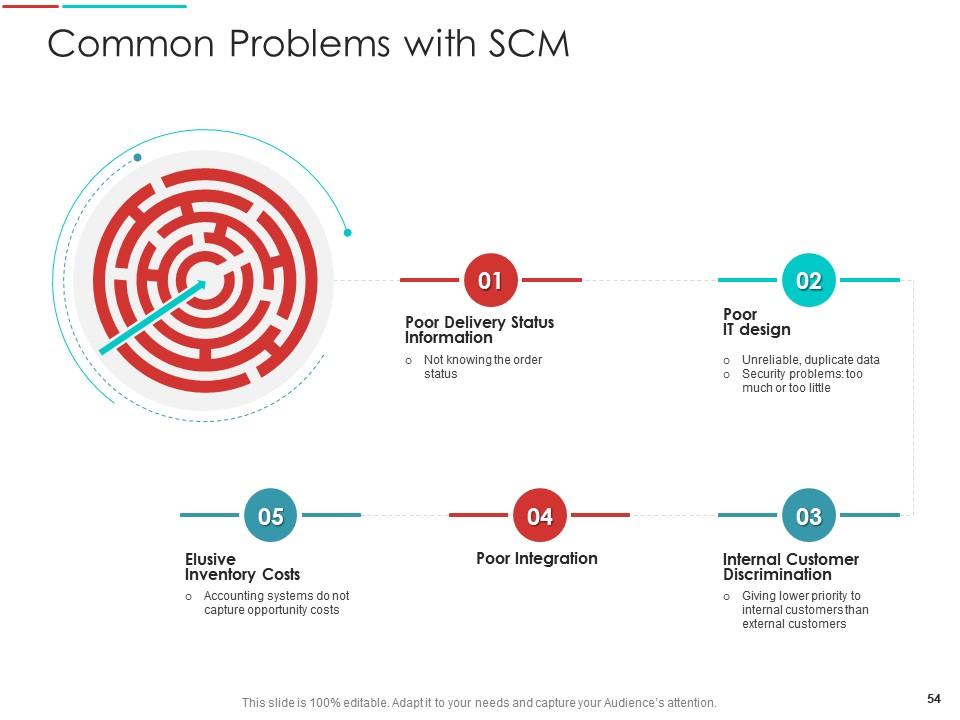
Slide 54: This slide shows Common Problems with SCM.
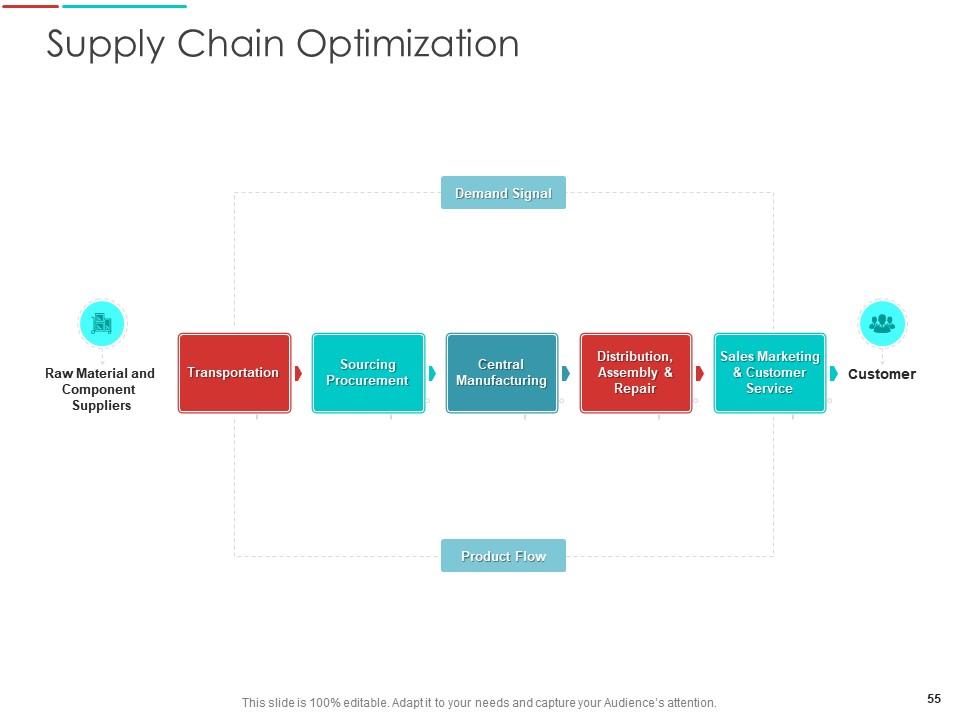
Slide 55: This slide displays Supply Chain Optimization describing- Demand Signal, Product Flow, Transportation, etc.
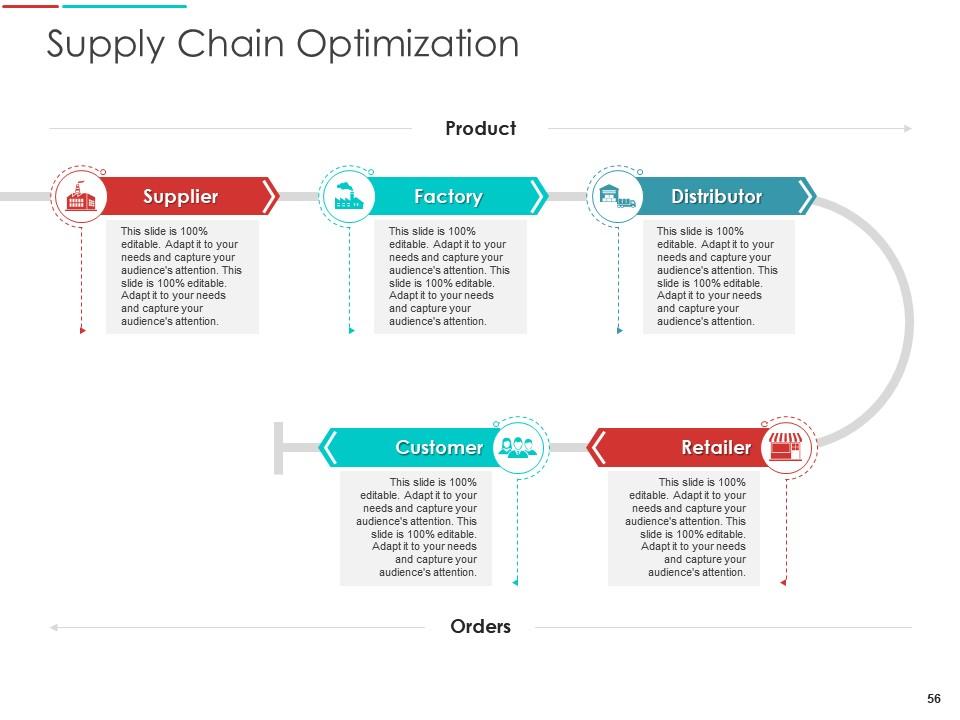
Slide 56: This slide shows Supply Chain Optimization like- Supplier, Factory, Retailer, etc.
Slide 57: This slide shows Supply Chain Management Architecture-Icons Slide.
Slide 58: This slide is titled as Additional Slides for moving forward.
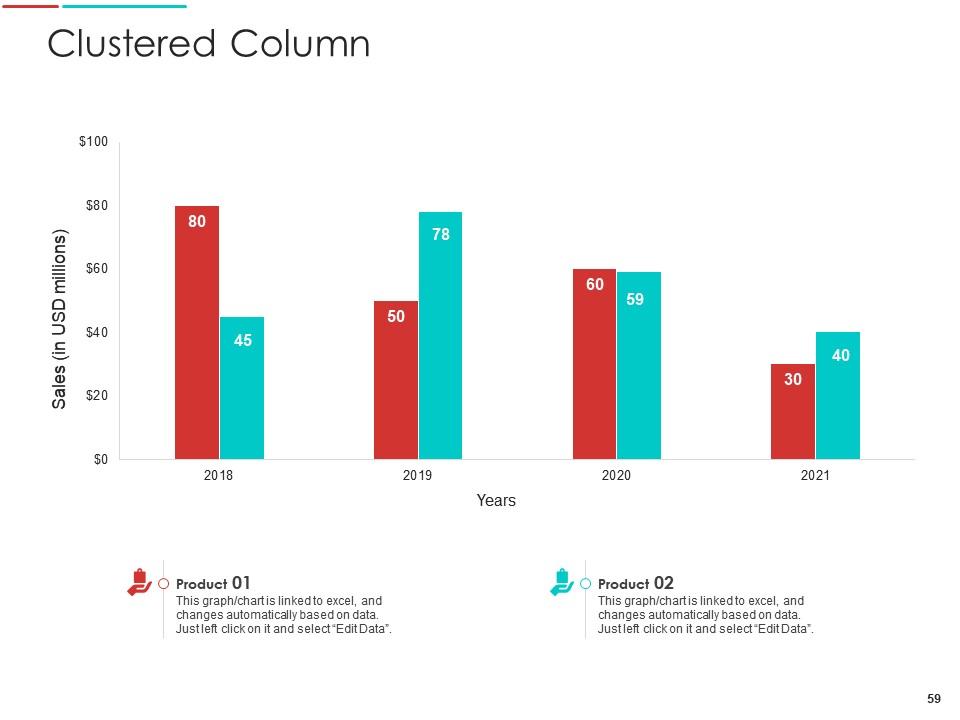
Slide 59: This slide displays Clustered Column chart with two products comparison.
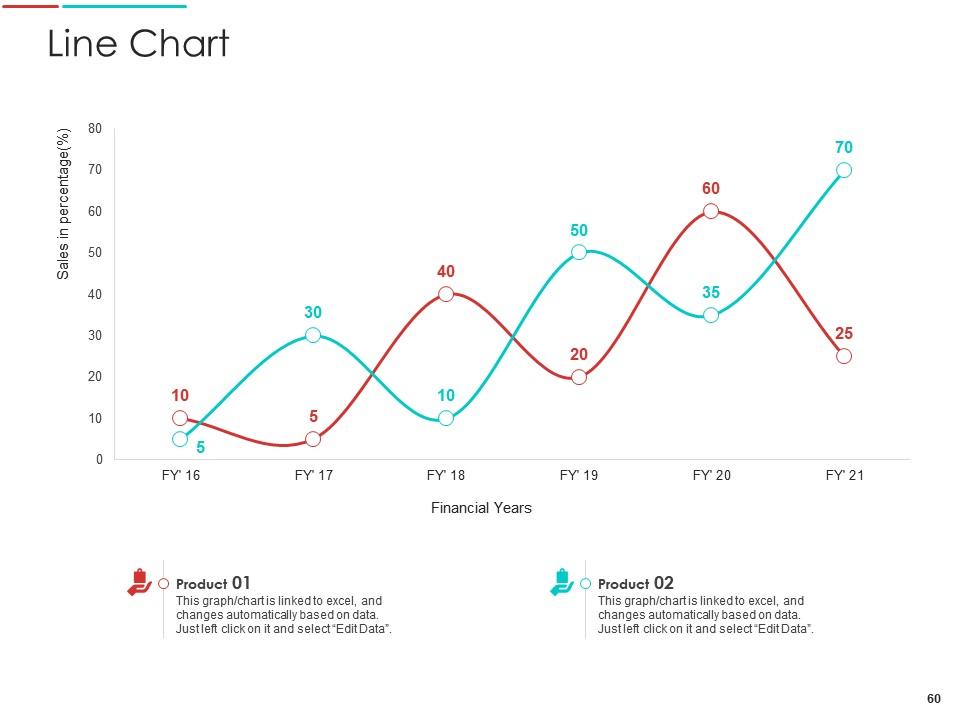
Slide 60: This slide displays Line chart with two products comparison.
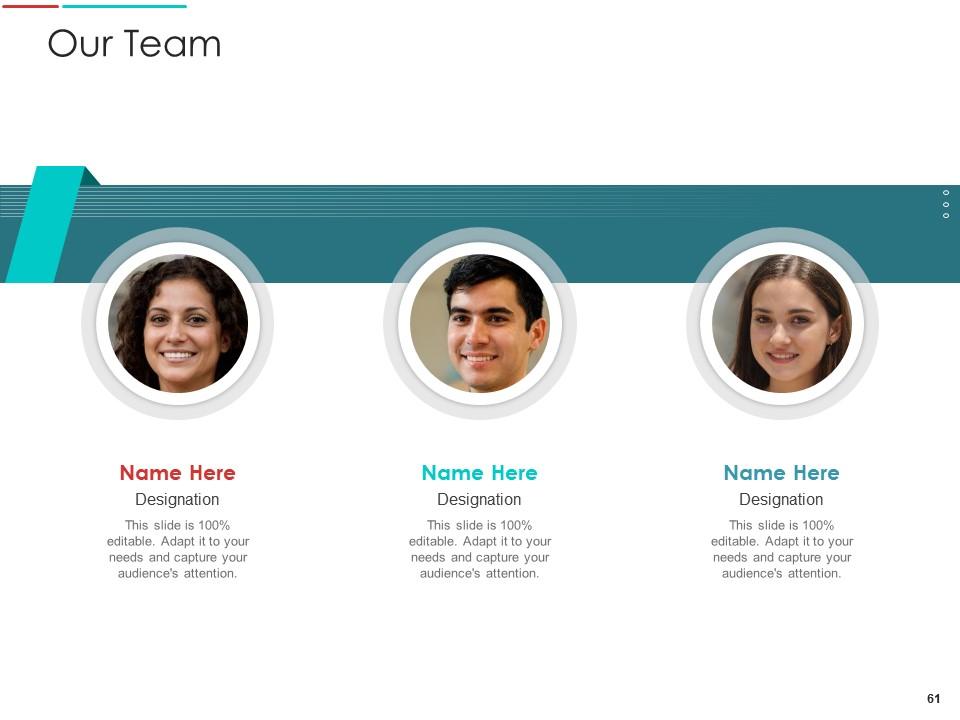
Slide 61: This is Our Team slide with names and designation.
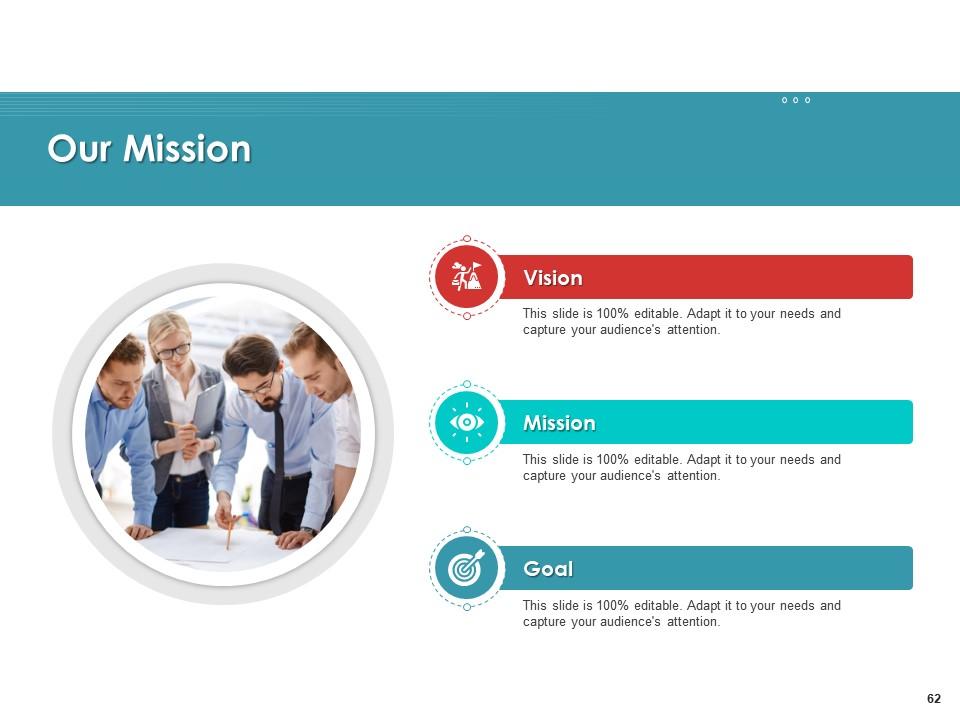
Slide 62: This is Our Mission slide with related imagery and text.
Slide 63: This is About Us slide to show company specifications etc.
Slide 64: This slide shows Puzzle with related icons and text.
Slide 65: This slide displays Post It Notes. Post your important notes here.
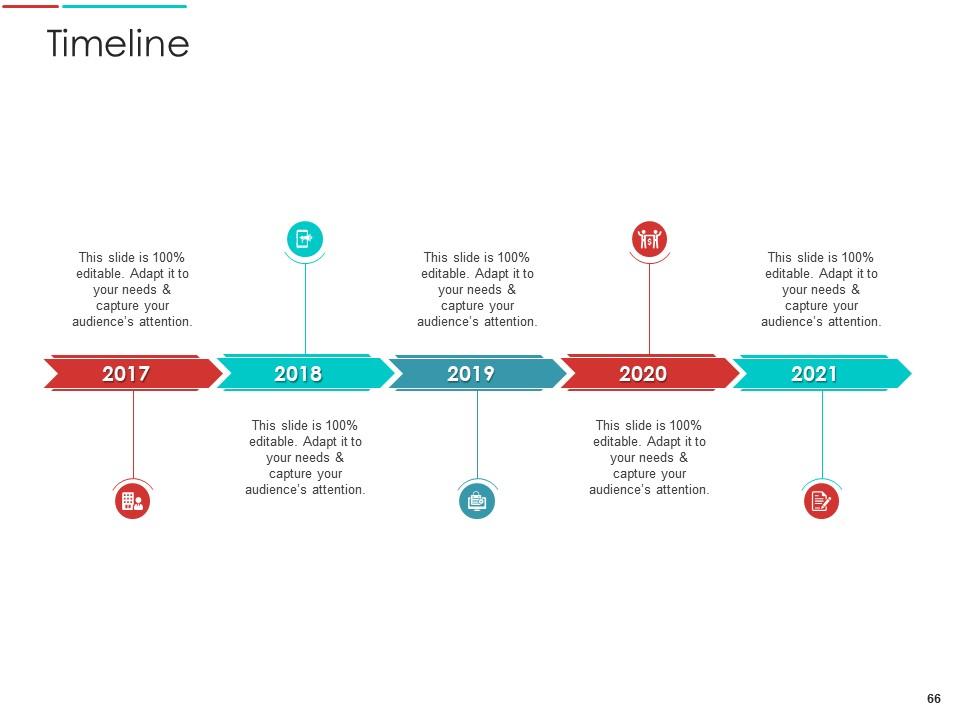
Slide 66: This is a Timeline slide. Show data related to time intervals here.
Slide 67: This slide shows Venn diagram with text boxes.
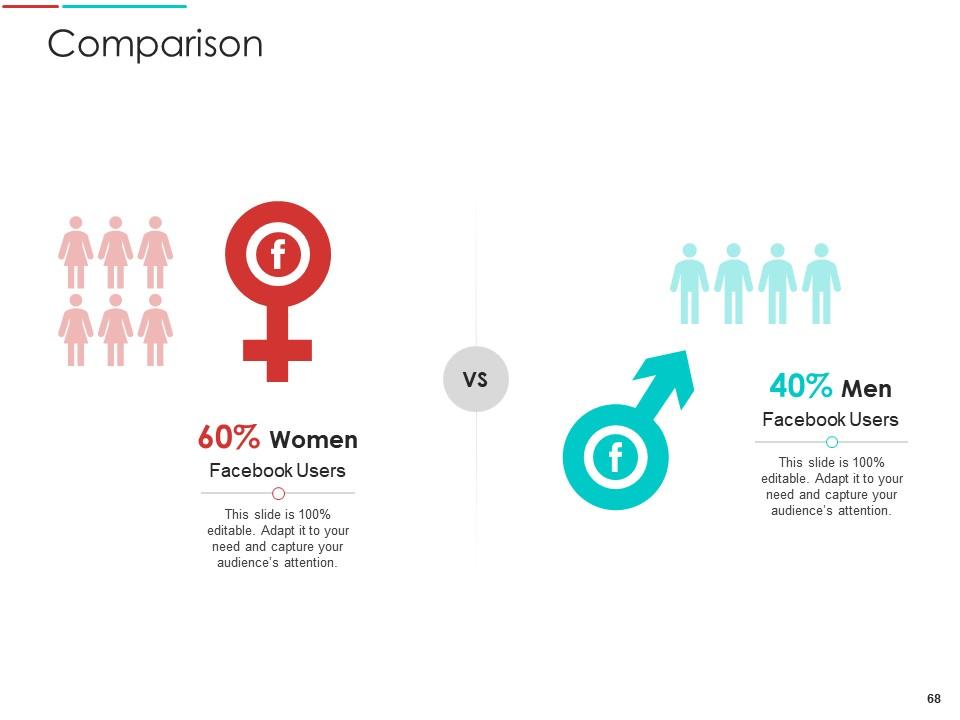
Slide 68: This is a Comparison slide to state comparison between commodities, entities etc.
Slide 69: This slide shows 30 60 90 Days Plan with text boxes.
Slide 70: This is a Thank You slide with address, contact numbers and email address.
Supply chain management architecture powerpoint presentation slides with all 70 slides:
Use our Supply Chain Management Architecture Powerpoint Presentation Slides to effectively help you save your valuable time. They are readymade to fit into any presentation structure.
-
Good research work and creative work done on every template.
-
Qualitative and comprehensive slides.
-
Much better than the original! Thanks for the quick turnaround.
-
It saves your time and decrease your efforts in half.
-
Thanks for all your great templates they have saved me lots of time and accelerate my presentations. Great product, keep them up!
-
Thanks for all your great templates they have saved me lots of time and accelerate my presentations. Great product, keep them up!
-
Best way of representation of the topic.
-
Use of different colors is good. It's simple and attractive.
-
Excellent Designs.


