Tools of quality powerpoint presentation slides
Address every hassle they face with our Tools Of Quality Powerpoint Presentation Slides. It will bring their gripes to an end.
Address every hassle they face with our Tools Of Quality Powerpoint Presentation Slides. It will bring their gripes to an ..
- Google Slides is a new FREE Presentation software from Google.
- All our content is 100% compatible with Google Slides.
- Just download our designs, and upload them to Google Slides and they will work automatically.
- Amaze your audience with SlideTeam and Google Slides.
-
Want Changes to This PPT Slide? Check out our Presentation Design Services
- WideScreen Aspect ratio is becoming a very popular format. When you download this product, the downloaded ZIP will contain this product in both standard and widescreen format.
-

- Some older products that we have may only be in standard format, but they can easily be converted to widescreen.
- To do this, please open the SlideTeam product in Powerpoint, and go to
- Design ( On the top bar) -> Page Setup -> and select "On-screen Show (16:9)” in the drop down for "Slides Sized for".
- The slide or theme will change to widescreen, and all graphics will adjust automatically. You can similarly convert our content to any other desired screen aspect ratio.
Compatible With Google Slides

Get This In WideScreen
You must be logged in to download this presentation.
PowerPoint presentation slides
Presenting this set of slides with name - Tools Of Quality Powerpoint Presentation Slides. Enhance your audiences knowledge with this well researched complete deck. Showcase all the important features of the deck with perfect visuals. This deck comprises of total of twenty one slides with each slide explained in detail. Each template comprises of professional diagrams and layouts. Our professional PowerPoint experts have also included icons, graphs and charts for your convenience. All you have to do is DOWNLOAD the deck. Make changes as per the requirement. Yes, these PPT slides are completely customizable. Edit the colour, text and font size. Add or delete the content from the slide. And leave your audience awestruck with the professionally designed Tools Of Quality Powerpoint Presentation Slides complete deck.
People who downloaded this PowerPoint presentation also viewed the following :
Content of this Powerpoint Presentation
Slide 1: This slide introduces Tools of Quality. State Your Company Name and begin
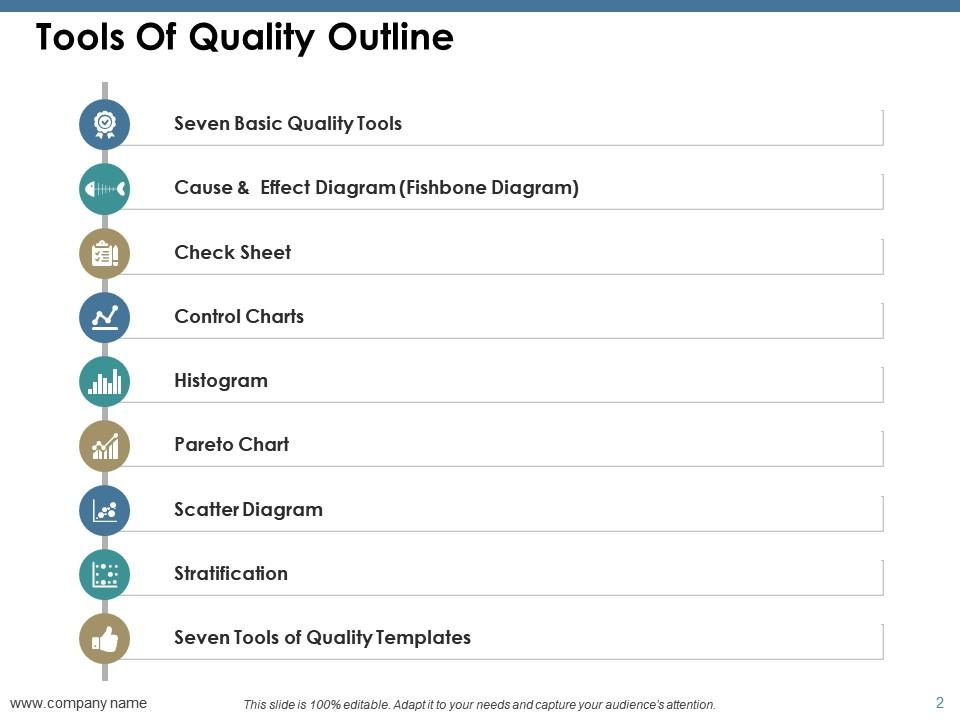
Slide 2: This slide showcases Tools Of Quality Outline with these of the following points - Cause & Effect Diagram (Fishbone Diagram), Check Sheet, Control Charts, Histogram, Pareto Chart, Scatter Diagram, Seven Basic Quality Tools, Stratification, Seven Tools of Quality Templates.
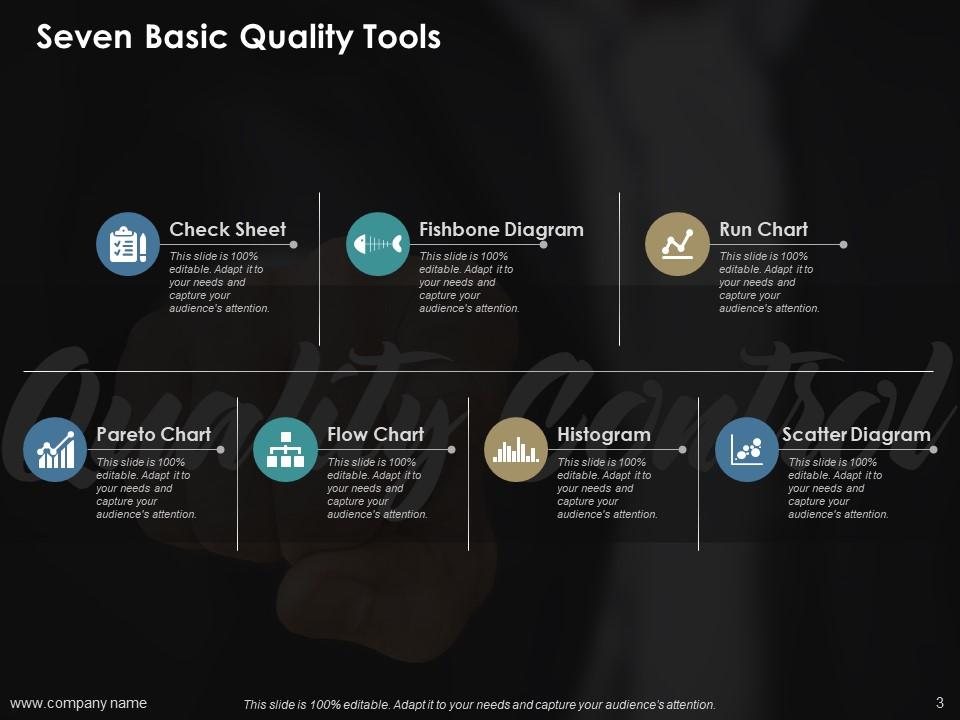
Slide 3: This slide presents Seven Basic Quality Tools with these of the following- Check Sheet, Run Chart, Fishbone Diagram, Pareto Chart, Flow Chart, Histogram, Scatter Diagram.
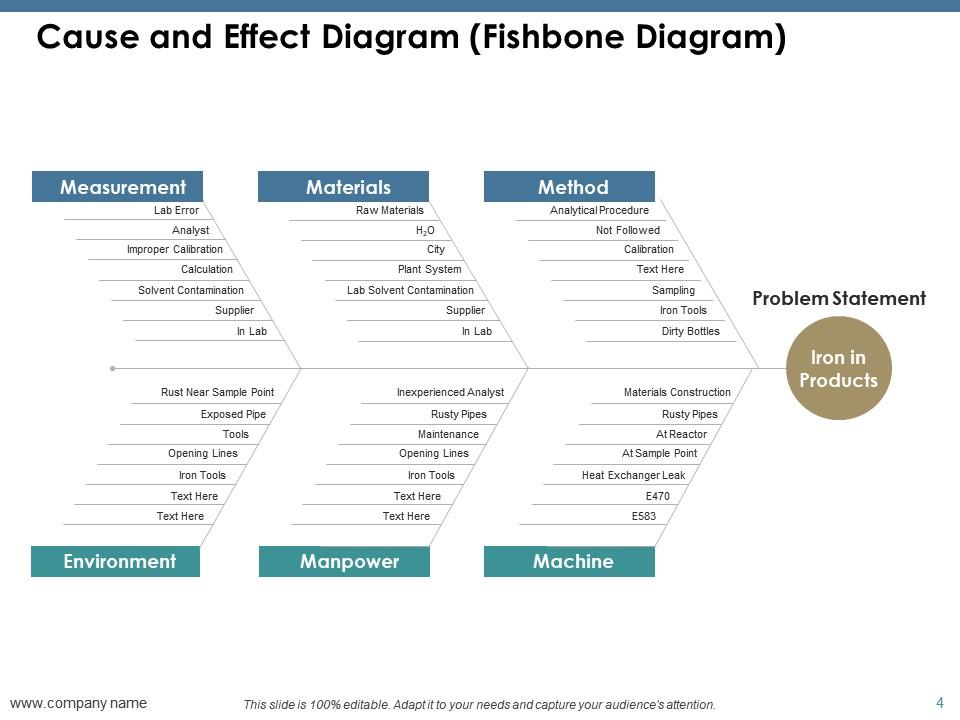
Slide 4: This slide showcases Cause and Effect Diagram (Fishbone Diagram).
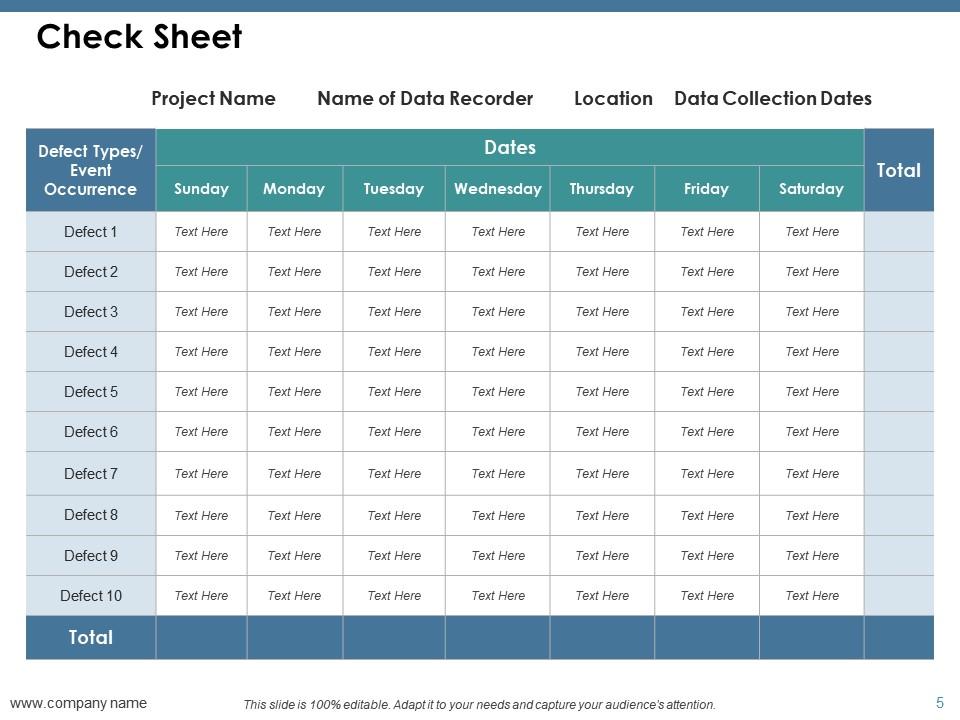
Slide 5: This slide presents Check Sheet which further presents- Project Name, Name of Data Recorder, Location, Data Collection Dates.
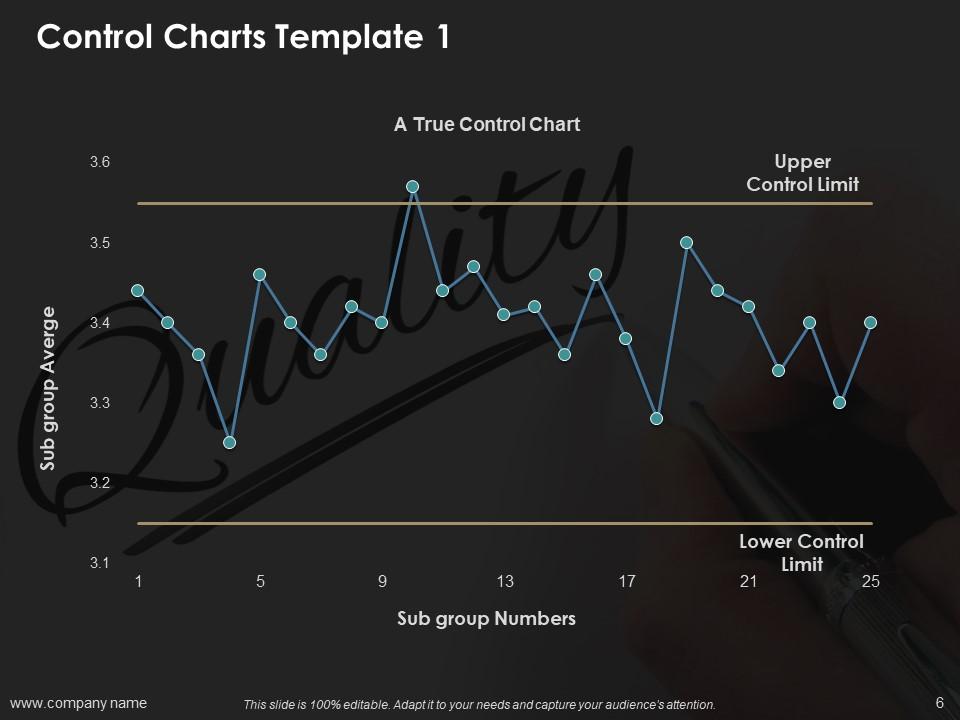
Slide 6: This slide showcases Control Charts Template 1. Add the sub group average and sub group numbers with an upper and lower limit.
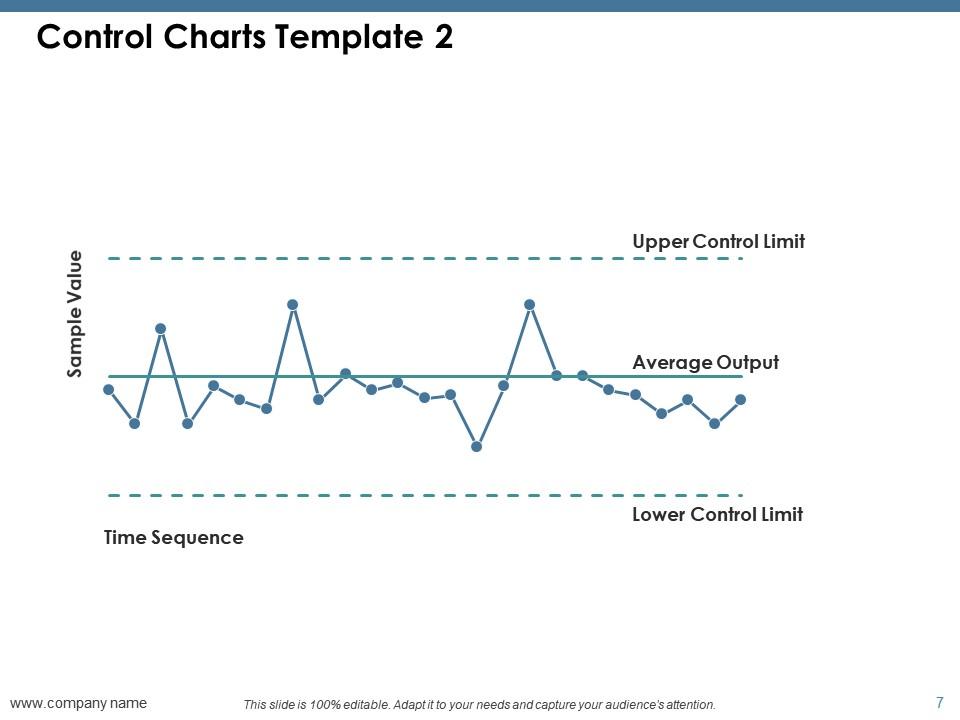
Slide 7: This slide presents Control Charts Template 2.
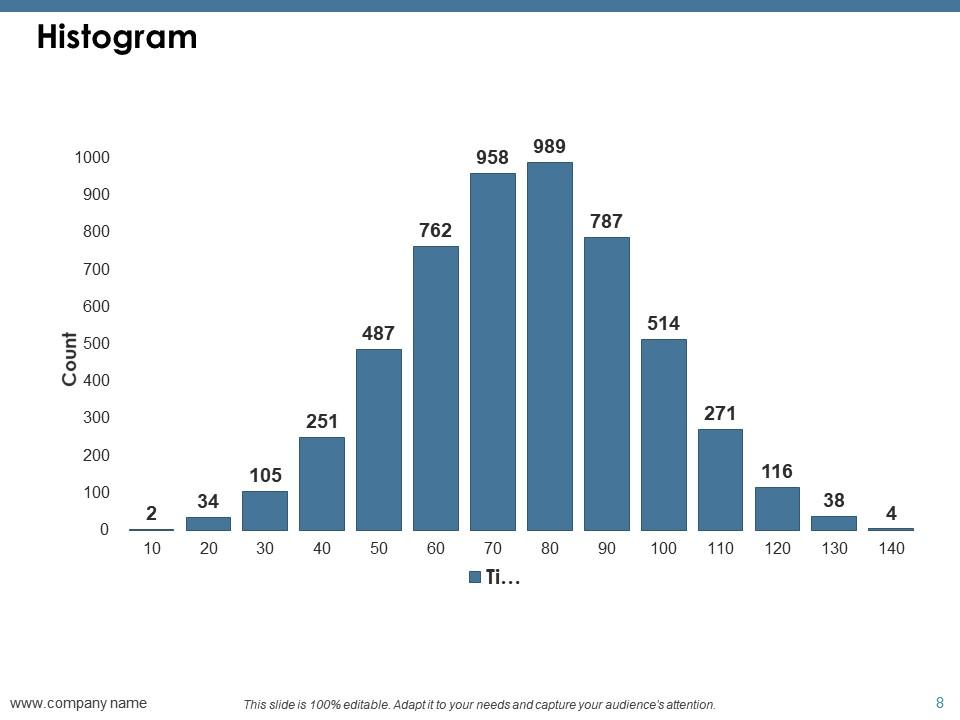
Slide 8: This slide presents Histogram which further have count and time.
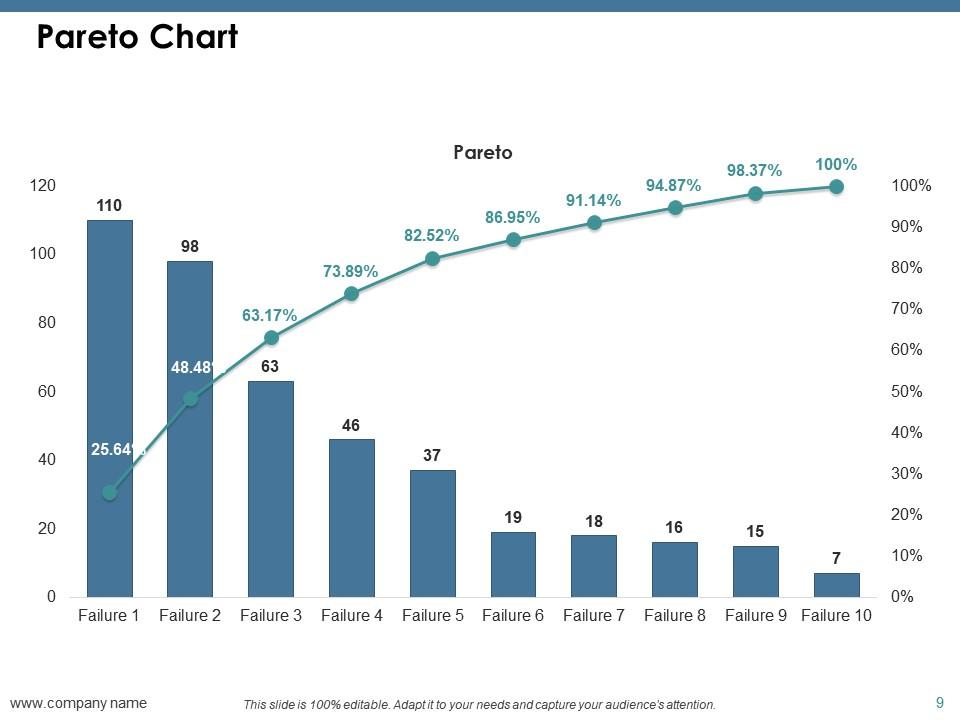
Slide 9: This slide showcases Pareto Chart.
Slide 10: This slide presents Scatter Diagram.
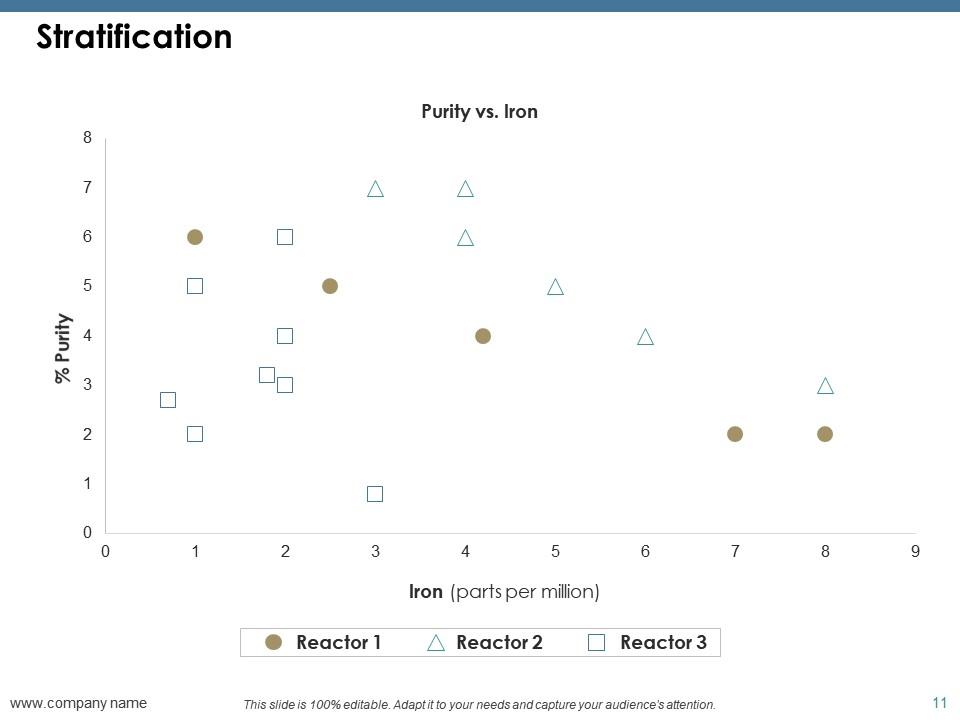
Slide 11: This slide shows Stratification which further showcases.
Slide 12: This slide is titled Additional slides to proceed forward.
Slide 13: This is Our team slide with names and designation.
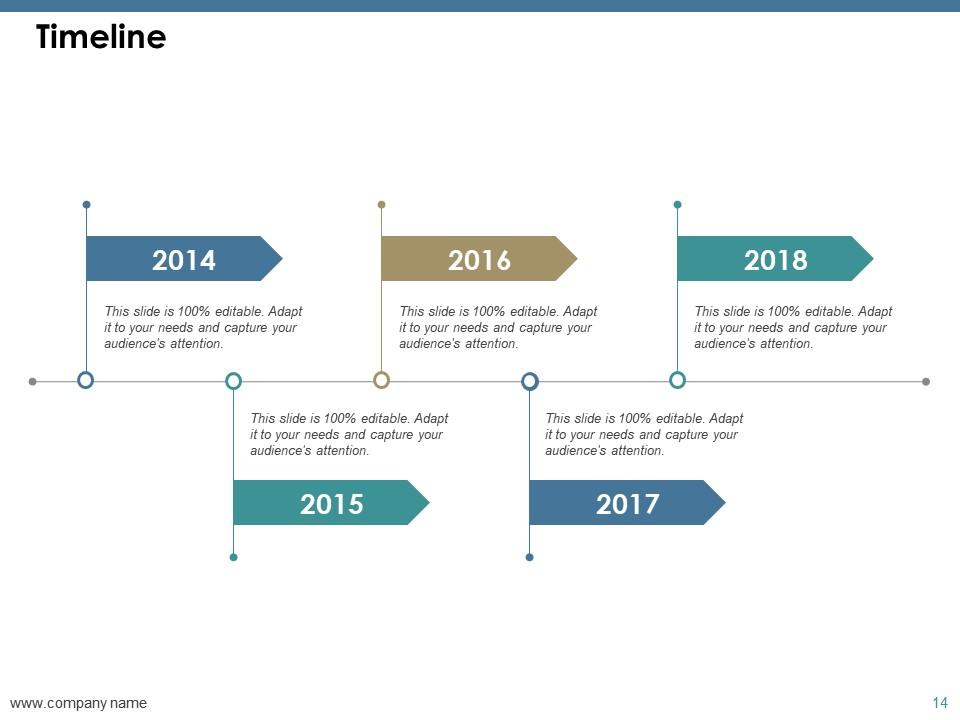
Slide 14: This is a Timeline slide to show milestones, growth or highlighting factors.
Slide 15: This is a Venn diagram image slide to show information, specifications etc.
Slide 16: This is a Bulb Or Idea image slide to show information, innovative aspects etc.
Slide 17: This slide shows Target image with text boxes
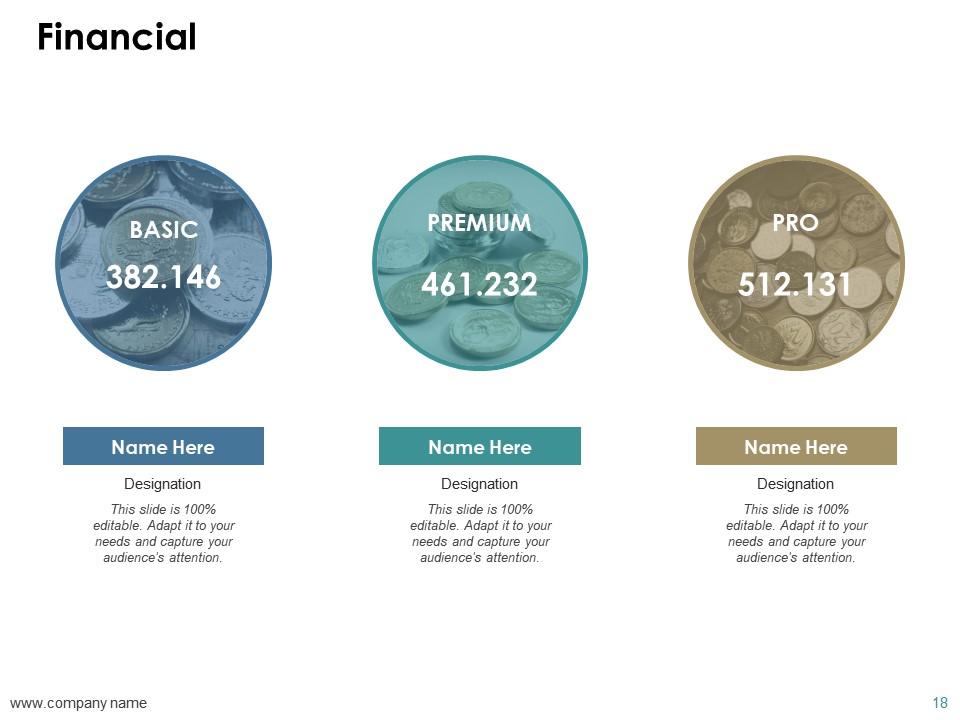
Slide 18: This slide displays Financial Projections And Key Metrics for customers and employees.
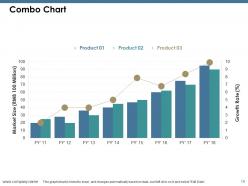
Slide 19: This slide presents Combo Chart.
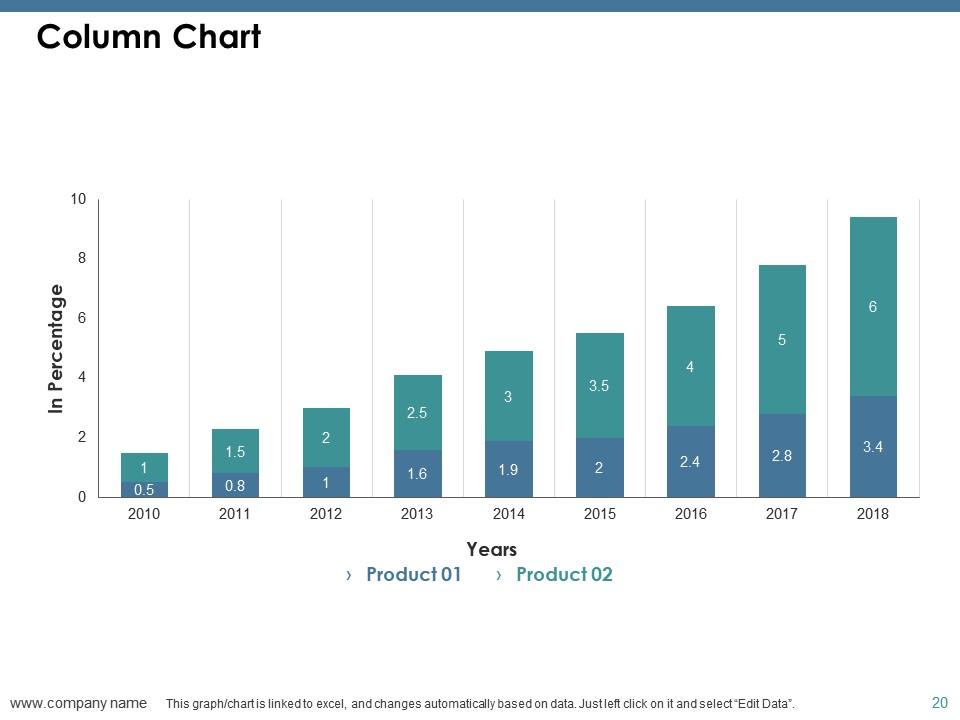
Slide 20: This slide showcases Column Chart.
Slide 21: This slide shows Thank You.
Tools of quality powerpoint presentation slides with all 21 slides:
Handle the case efficiently with our Tools Of Quality Powerpoint Presentation Slides. Don't allow energies to get dissipated.
No Reviews


