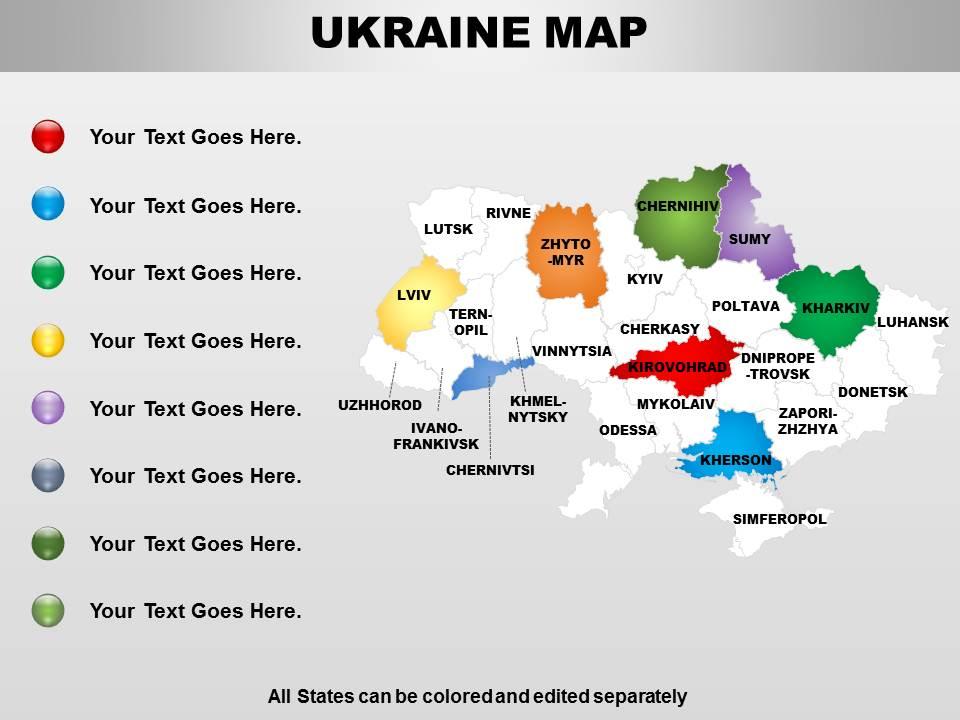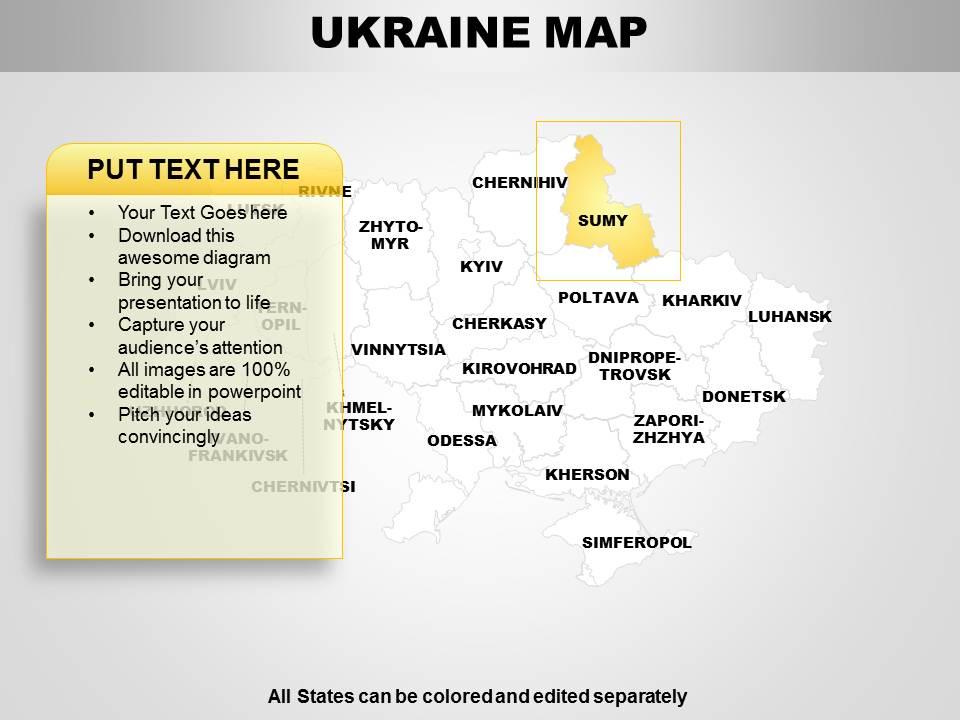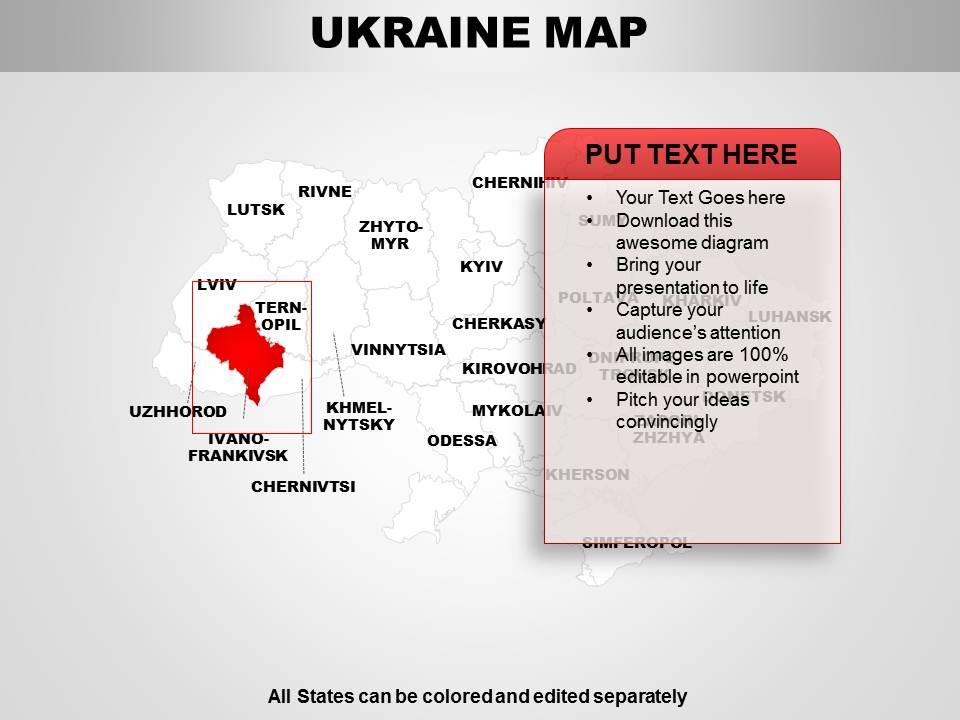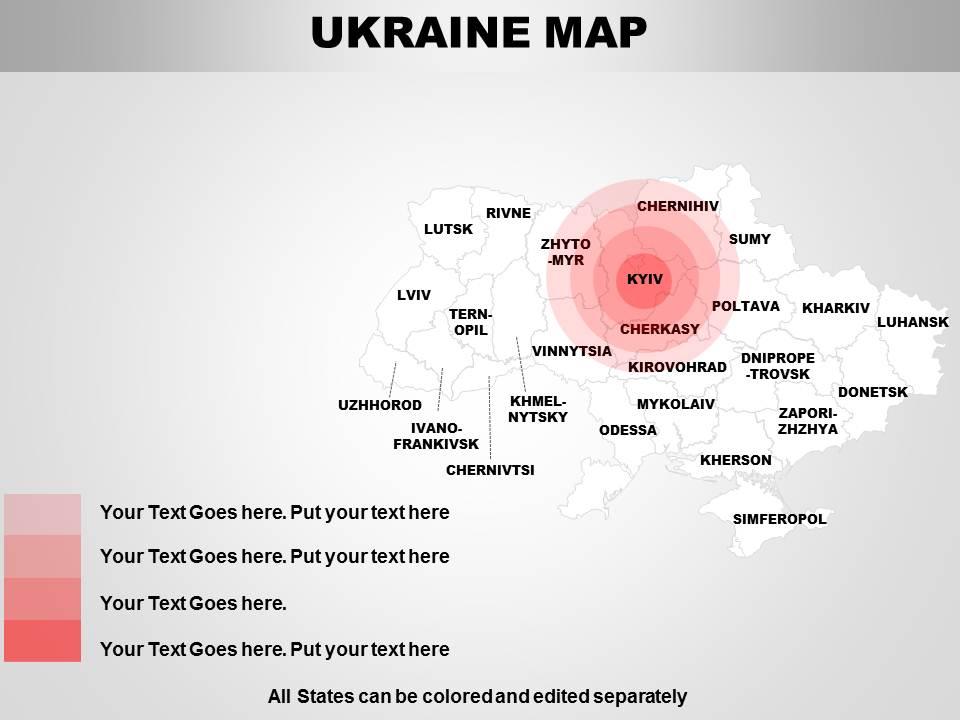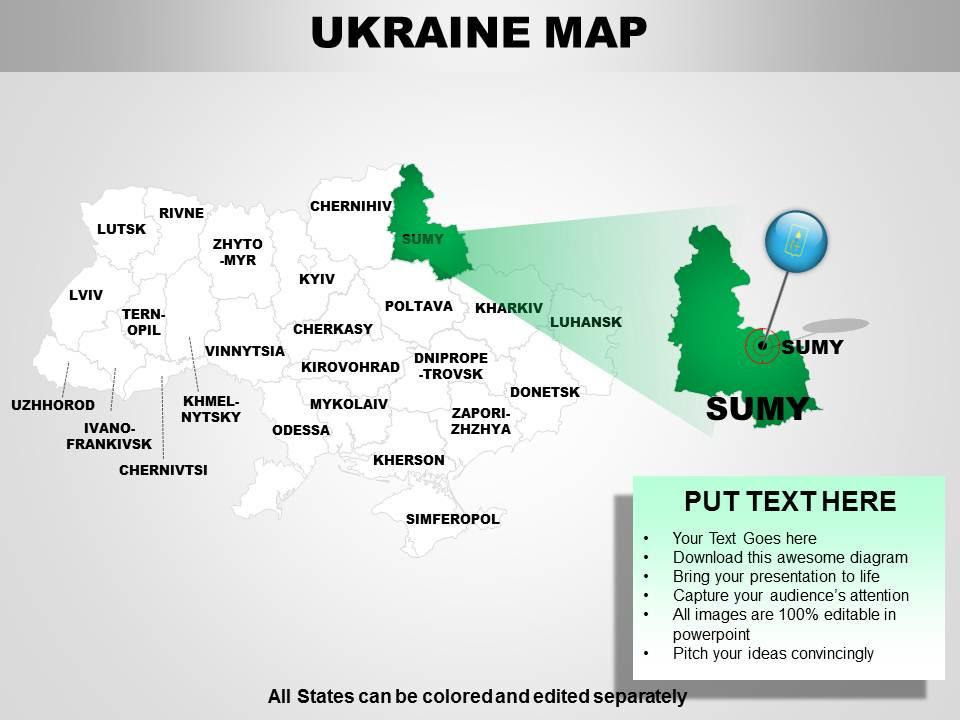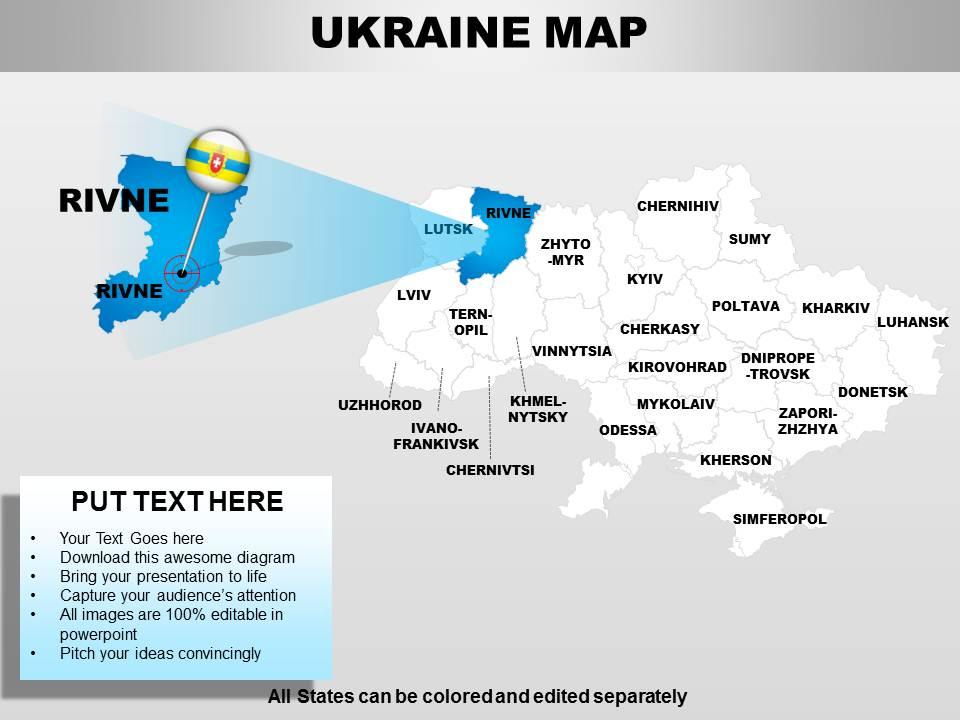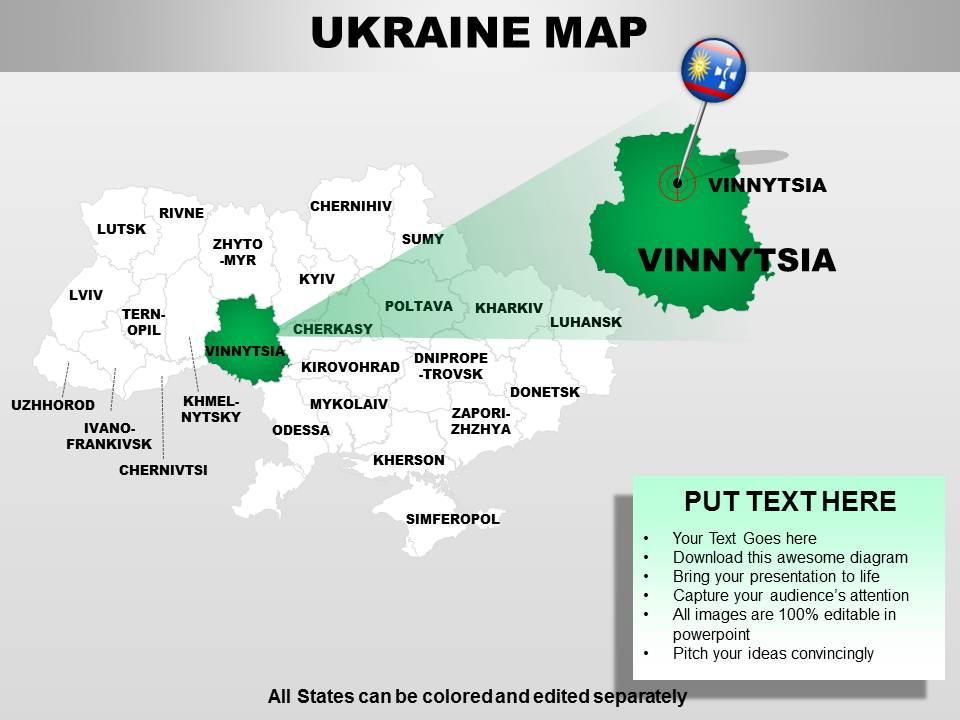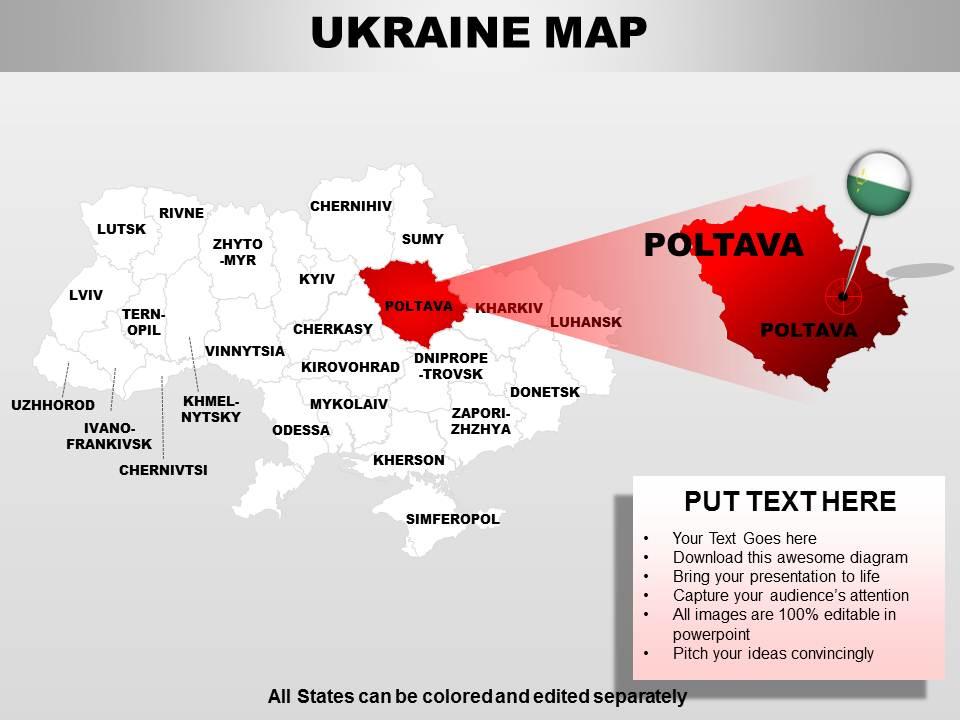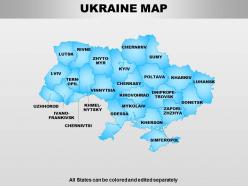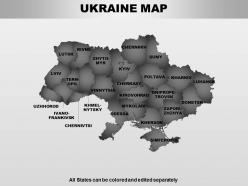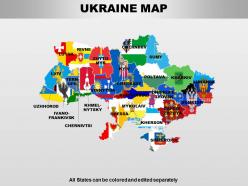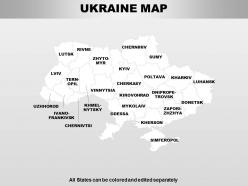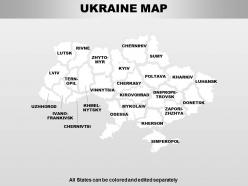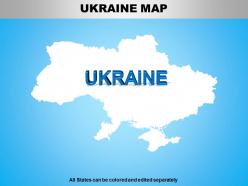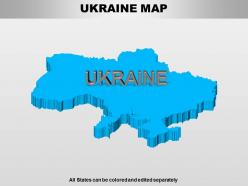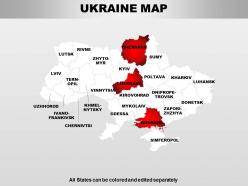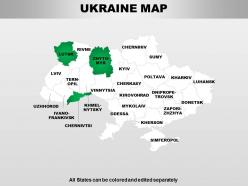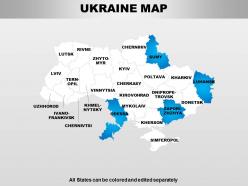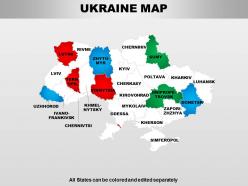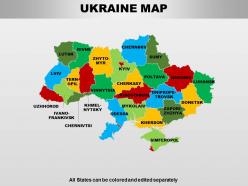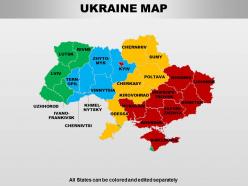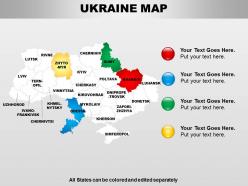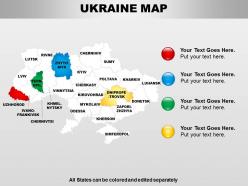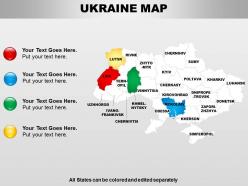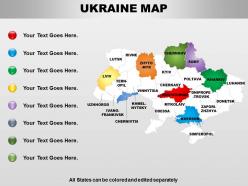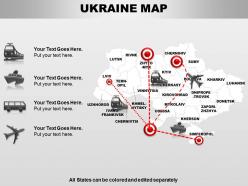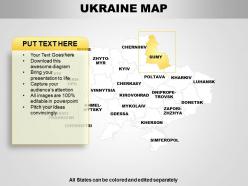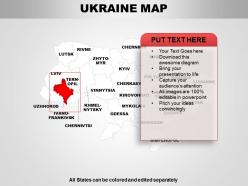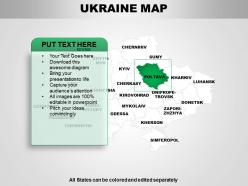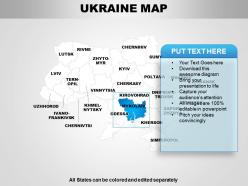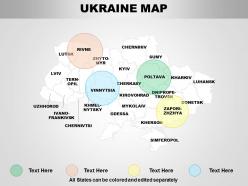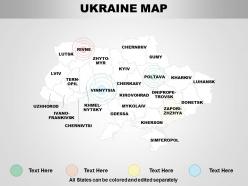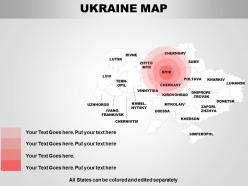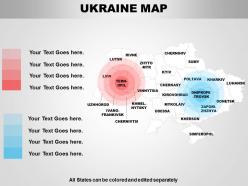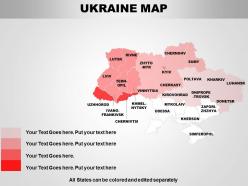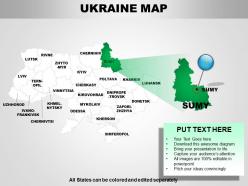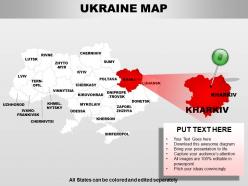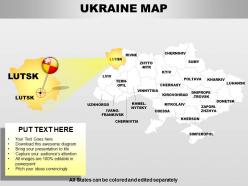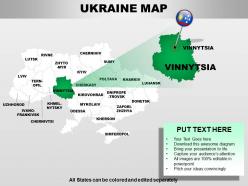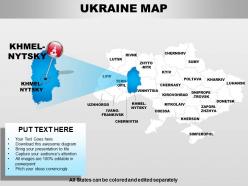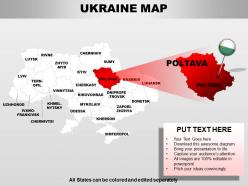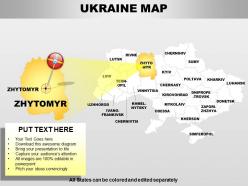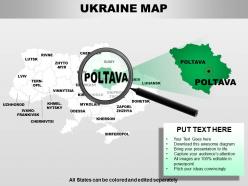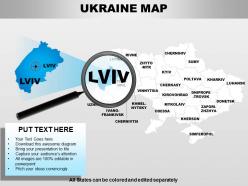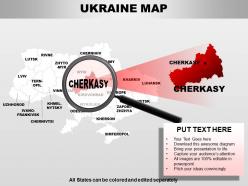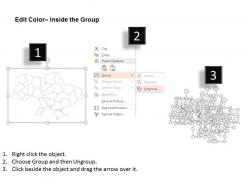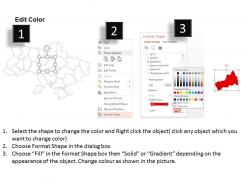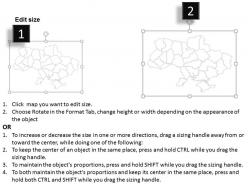
Ukraine powerpoint maps
Try Before you Buy Download Free Sample Product
Audience
Editable
of Time
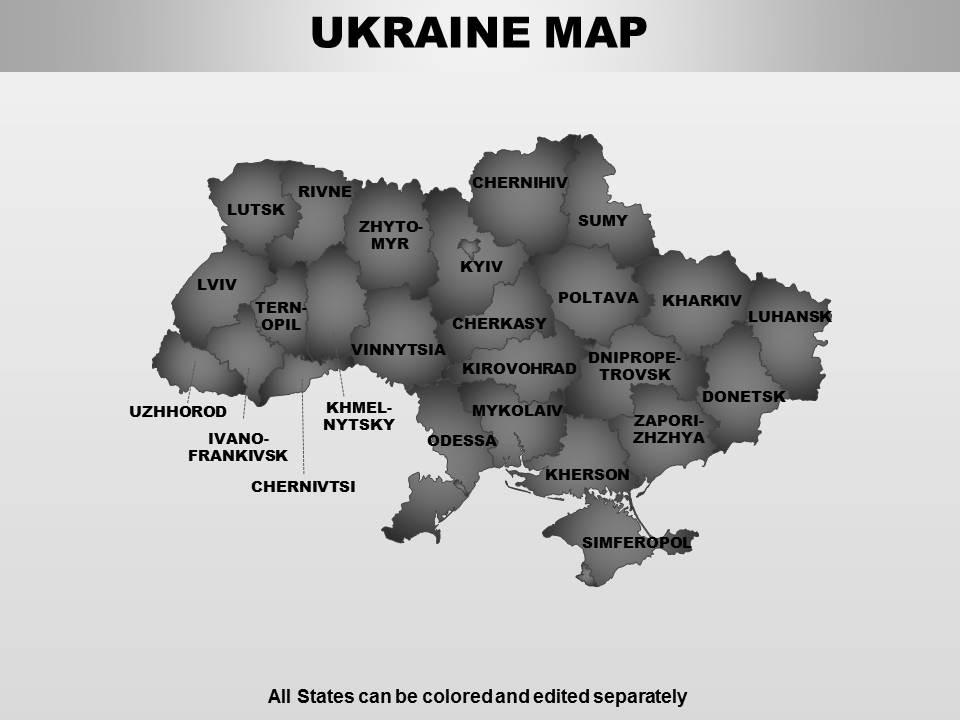
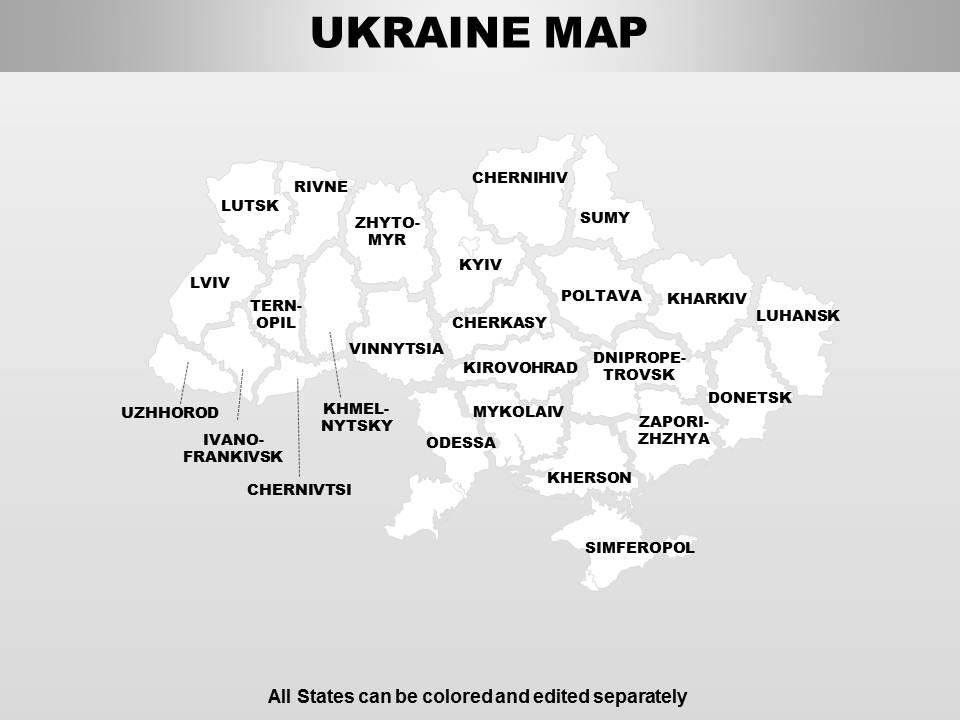
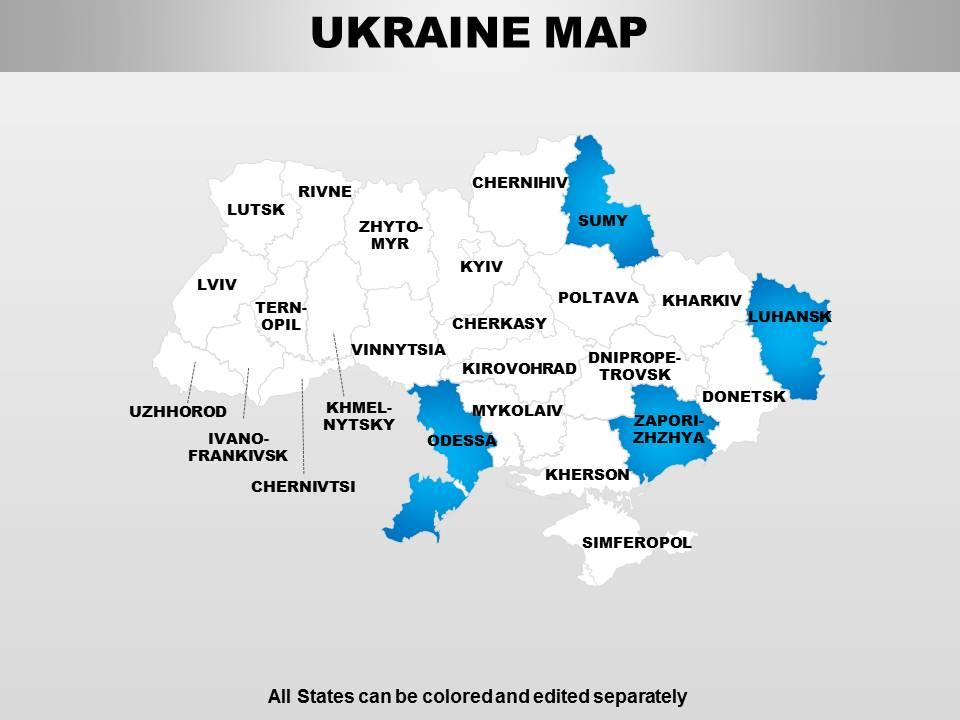
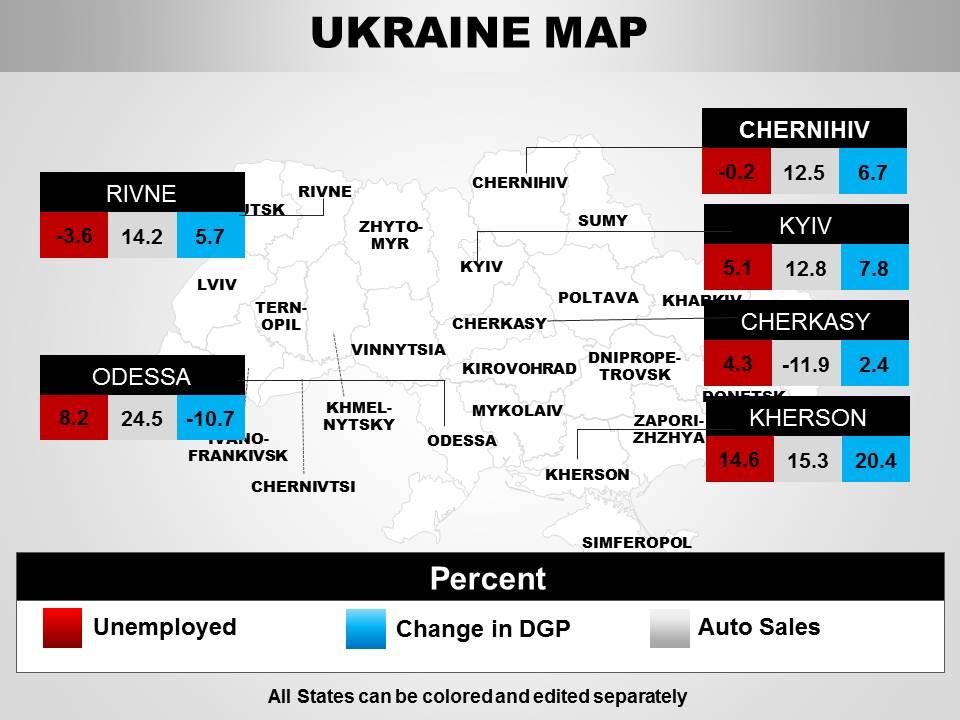
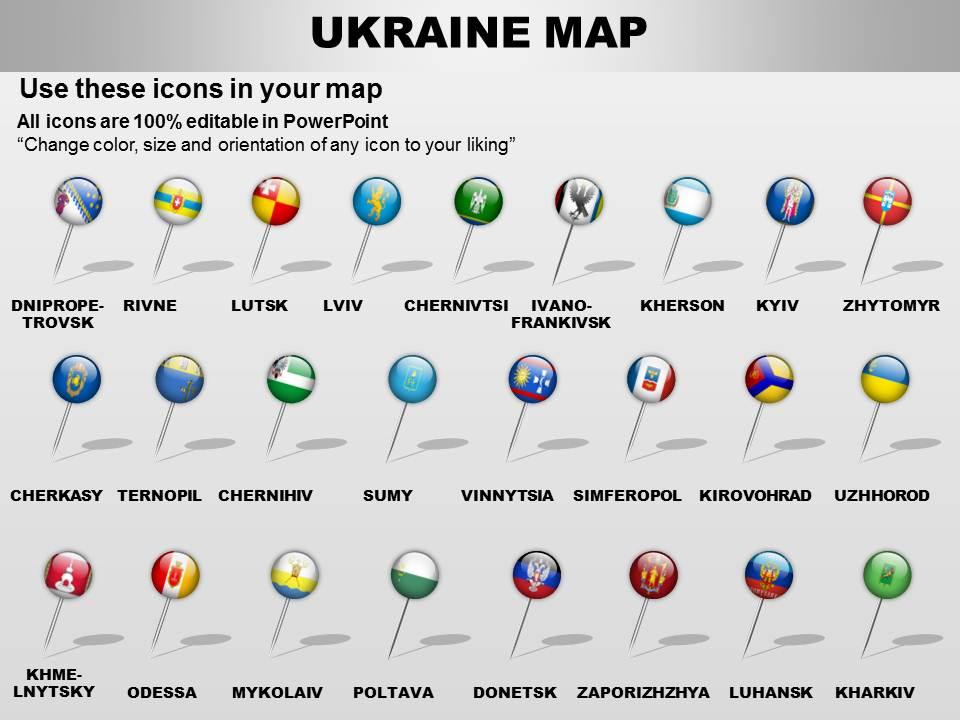
Bring your excellence to bear with our Ukraine Powerpoint Maps. Enlighten them in your characteristic fashion.
People who downloaded this PowerPoint presentation also viewed the following :
Ukraine powerpoint maps with all 64 slides:
Engage with our Ukraine Powerpoint Maps and feel the difference. They will engender confidence.
FAQs for
Ukraine's modern borders reflect centuries of territorial shifts including Polish-Lithuanian rule, Austrian and Russian imperial control, Soviet territorial adjustments, and the 1991 independence boundaries. These changes demonstrate how political transitions, from Habsburg governance to Soviet redistricting, ultimately shaped today's administrative regions, with many organizations finding that historical border evolution helps explain current regional cultural and economic differences.
Satellite imaging and geo-spatial technology have revolutionized Ukraine map accuracy by providing real-time data collection, high-resolution terrain analysis, and precise coordinate mapping capabilities. These technologies enable cartographers, government agencies, and international organizations to create detailed infrastructure assessments, monitor territorial changes, and deliver strategic planning resources, ultimately enhancing operational efficiency for humanitarian, economic, and administrative purposes.
Maps serve as critical tools for strategic planning, territorial documentation, humanitarian coordination, and international diplomatic discussions regarding Ukraine's sovereignty. Through detailed geographic visualization, military planners, aid organizations, and policymakers can track territorial changes, coordinate relief efforts, and maintain accurate records of internationally recognized boundaries, while news organizations and analysts increasingly rely on cartographic data to communicate complex geopolitical developments to global audiences.
Ukraine's regions on maps reveal distinct cultural divisions between Ukrainian-speaking western areas and Russian-influenced eastern territories, alongside economic patterns showing industrial concentration in the Donbas, agricultural dominance in central plains, and emerging tech hubs in major cities. These geographical representations highlight how cultural heritage, language distribution, and resource allocation create diverse economic opportunities across regions, with many international businesses finding that understanding these regional variations enables more strategic market entry and operational planning.
Creating maps of contested territories in Ukraine presents challenges including rapidly changing boundaries, conflicting sovereignty claims, limited access for ground verification, political sensitivities around territorial representation, and the need for real-time updates. These cartographic complexities require mapmakers to balance accuracy with diplomatic considerations, often utilizing satellite imagery and crowdsourced data, while clearly indicating disputed status to maintain credibility and usefulness for humanitarian, military, and governmental organizations.
Interactive maps enhance understanding of Ukraine's demographic distribution by visualizing population density, ethnic composition, age demographics, migration patterns, and urban-rural distributions across regions. These dynamic tools enable researchers, policymakers, and organizations to analyze complex demographic data through layered visualizations, real-time filtering, and comparative analysis, ultimately delivering deeper insights for strategic planning and resource allocation.
Using outdated maps in Ukrainian policy-making can lead to misallocated resources, ineffective infrastructure planning, and compromised territorial governance, particularly given recent geopolitical changes and population shifts. These inaccuracies ultimately undermine strategic decision-making across sectors like defense, economic development, and humanitarian aid, with many government agencies finding that updated geographic data enables more precise resource allocation and enhances operational effectiveness in an increasingly complex regional landscape.
Ukraine's road maps reveal significant infrastructure evolution, showcasing expanded highway networks, modernized transportation corridors connecting major cities like Kyiv and Lviv, and improved rural connectivity. These developments reflect strategic investments in European integration routes, enhanced logistics capabilities for agricultural exports, and ongoing efforts to strengthen regional economic ties, ultimately delivering improved trade efficiency and competitive positioning in Eastern European markets.
The best sources for up-to-date Ukraine maps include government cartographic agencies, international organizations like NATO and UN, specialized mapping services such as Google Earth and ArcGIS, defense intelligence platforms, and humanitarian coordination databases. These resources prove increasingly vital for organizations requiring accurate territorial analysis, logistics planning, and situational awareness, with many businesses, relief agencies, and research institutions finding that current mapping data enables strategic decision-making and operational efficiency.
Physical maps of Ukraine emphasize geographical features like the Carpathian Mountains, Dnieper River, and Black Sea coastline, along with natural resource deposits including coal, iron ore, and fertile agricultural lands. Political maps focus on administrative boundaries, cities, and governmental divisions, while physical maps reveal Ukraine's strategic resource distribution across different terrain types, enabling businesses in agriculture, mining, and energy sectors to identify optimal locations for operations and investment opportunities.
Topographic maps reveal Ukraine's diverse terrain through detailed elevation contours, river systems, mountain ranges, and agricultural plains, essential for understanding the country's geographic complexity. These maps enable military strategists, urban planners, and agricultural specialists to analyze terrain advantages, infrastructure development potential, and resource distribution across Ukraine's vast landscape, ultimately delivering strategic insights for defense planning, economic development, and environmental management initiatives.
Maps document conflict's impact on Ukrainian urban development through satellite imagery, damage assessments, infrastructure mapping, population displacement tracking, and reconstruction planning data. These cartographic tools enable urban planners, international organizations, and government agencies to visualize destruction patterns, prioritize rebuilding efforts, and strategically plan resilient city layouts, ultimately delivering comprehensive recovery frameworks and data-driven reconstruction strategies.
Maps can promote tourism in Ukraine's historical regions by highlighting cultural landmarks, UNESCO sites, traditional craft centers, architectural monuments, and scenic routes connecting regional attractions. These visual guides enable tourists to discover Lviv's medieval quarters, Kyiv's golden-domed churches, and Carpathian folk villages, while tour operators create themed itineraries showcasing Ukraine's rich heritage, ultimately delivering enhanced visitor experiences and supporting regional economic development.
Educational maps of Ukraine support cultural literacy by showcasing regional languages, traditional festivals, historical landmarks, architectural styles, and ethnic communities across different oblasts. These visual resources enable students to understand Ukraine's diverse cultural tapestry, from Carpathian traditions to Crimean Tatar heritage, while fostering deeper appreciation for the country's rich multicultural identity and regional variations.
**INPUT**: What innovations in mapping technology are most affecting the visualization of Ukraine's geographic data? **OUTPUT**: Mapping innovations transforming Ukraine's geographic visualization include satellite imagery integration, real-time data overlays, 3D terrain modeling, AI-powered analytics, and interactive web platforms. These technologies enhance situational awareness by delivering precise territorial mapping, infrastructure monitoring, and dynamic boundary tracking, with government agencies and humanitarian organizations finding that streamlined geographic intelligence ultimately enables faster decision-making and more effective resource allocation. [Word count: 60 words]
-
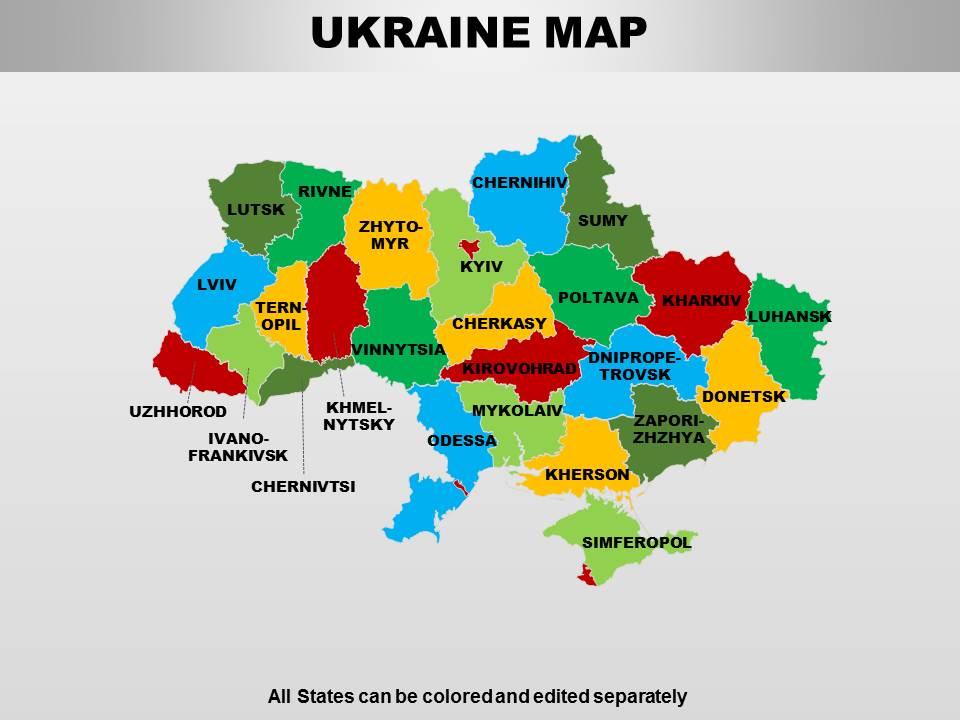
Use of different colors is good. It's simple and attractive.
-
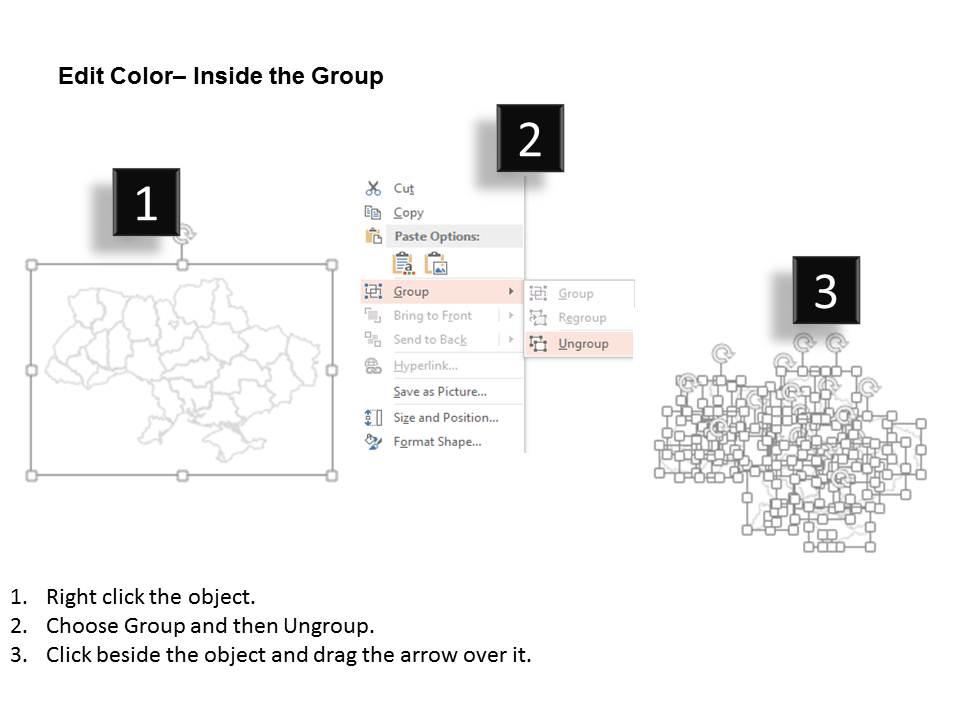
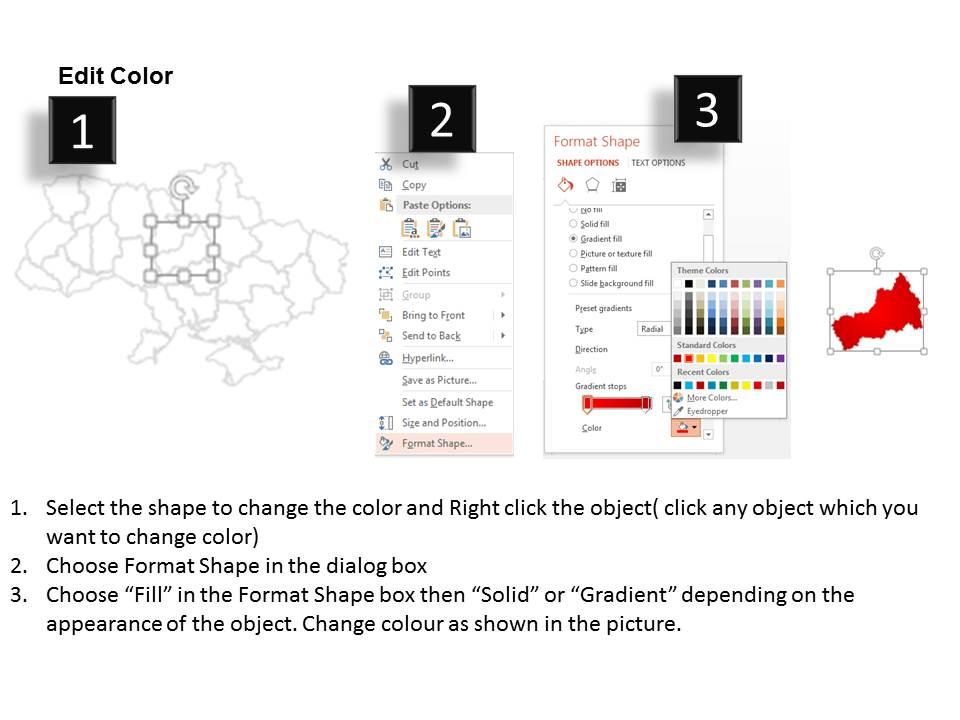
Easily Editable.