Value Stream Mapping For Kaizen Training Ppt
These PPT slides cover how to implement the Value Stream Mapping technique to achieve the continuous improvement objective of the Kaizen methodology.
These PPT slides cover how to implement the Value Stream Mapping technique to achieve the continuous improvement objective ..
- Google Slides is a new FREE Presentation software from Google.
- All our content is 100% compatible with Google Slides.
- Just download our designs, and upload them to Google Slides and they will work automatically.
- Amaze your audience with SlideTeam and Google Slides.
-
Want Changes to This PPT Slide? Check out our Presentation Design Services
- WideScreen Aspect ratio is becoming a very popular format. When you download this product, the downloaded ZIP will contain this product in both standard and widescreen format.
-

- Some older products that we have may only be in standard format, but they can easily be converted to widescreen.
- To do this, please open the SlideTeam product in Powerpoint, and go to
- Design ( On the top bar) -> Page Setup -> and select "On-screen Show (16:9)” in the drop down for "Slides Sized for".
- The slide or theme will change to widescreen, and all graphics will adjust automatically. You can similarly convert our content to any other desired screen aspect ratio.
Compatible With Google Slides

Get This In WideScreen
You must be logged in to download this presentation.
PowerPoint presentation slides
Presenting Value Stream Mapping for Kaizen. This PPT presentation is thoroughly researched by the experts, and every slide consists of appropriate content. All slides are customizable. You can add or delete the content as per your need. Not just this, you can also make the required changes in the charts and graphs. Download this professionally designed business presentation, add your content and present it with confidence.
People who downloaded this PowerPoint presentation also viewed the following :
Content of this Powerpoint Presentation
Slide 2
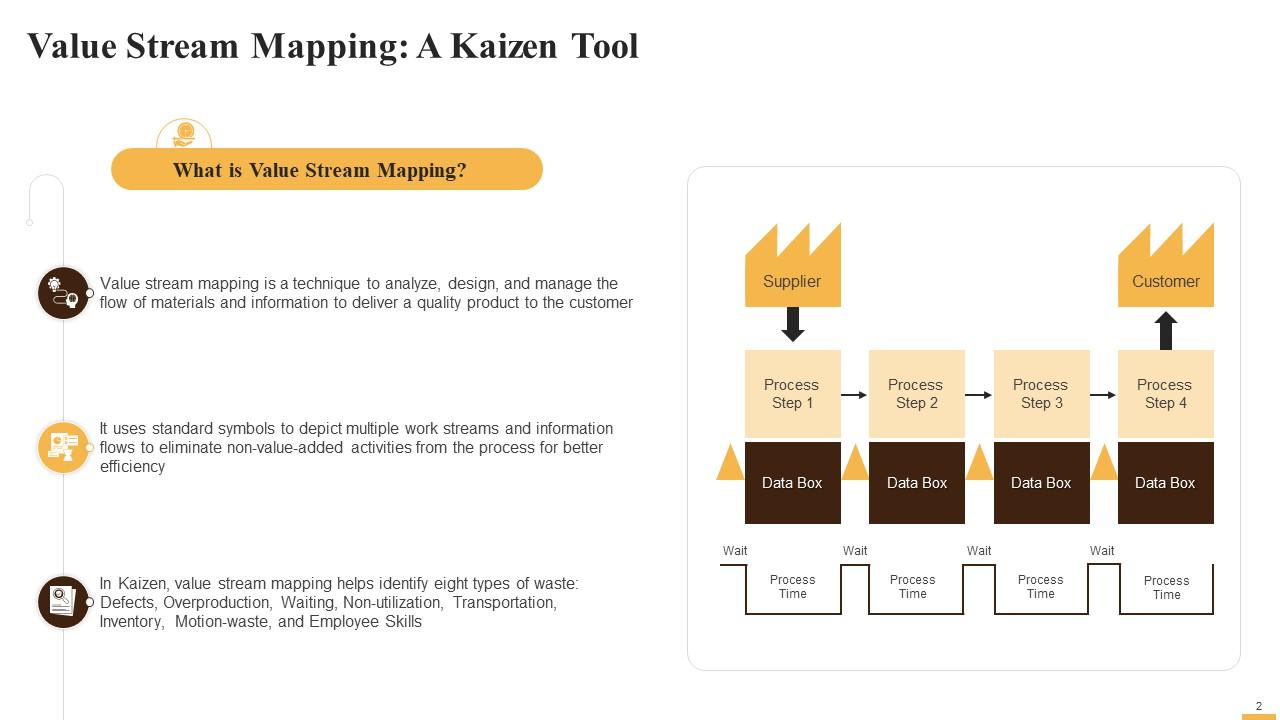
This slide provides information about the concept of value stream mapping, a technique to analyze, design, and manage the flow of materials and information to deliver a quality product to the customer. In Kaizen, value stream mapping helps identify eight types of waste: Defects, waiting, non-utilization, transportation, inventory, motion waste, and employee skills.
Slide 3
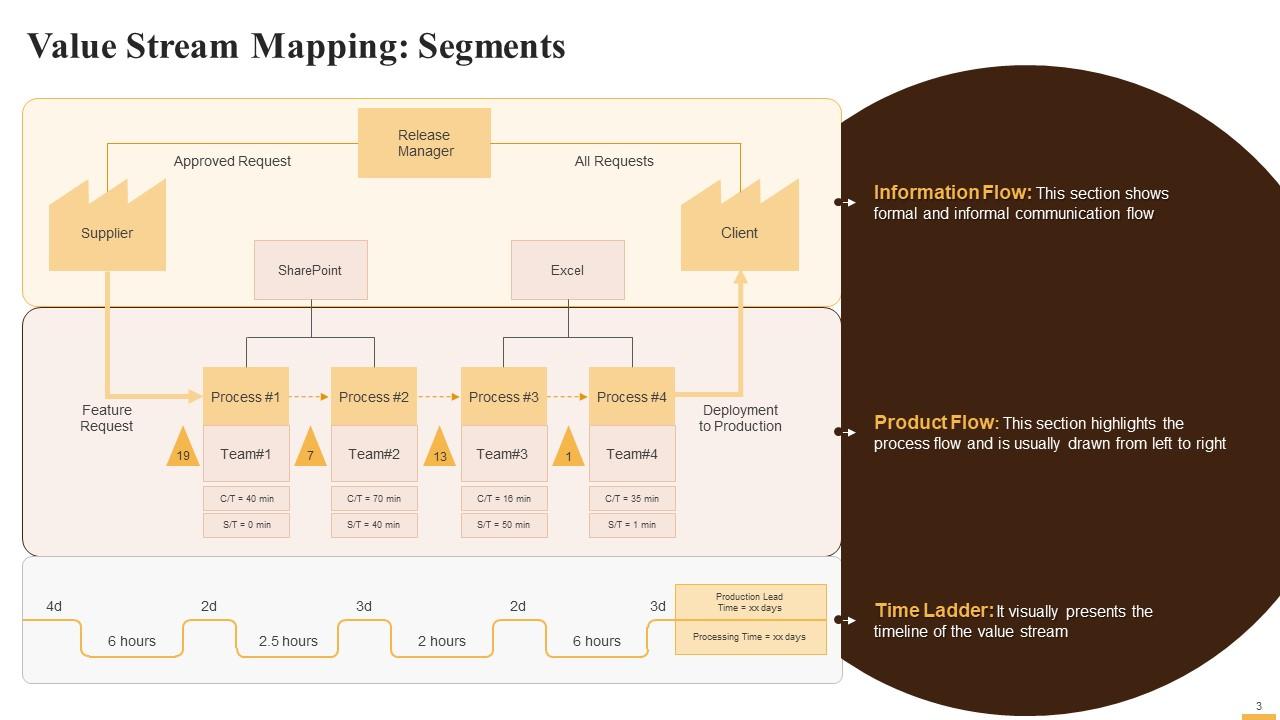
This slide reflects the major sections of a value stream map, such as information flow, product flow, and time ladder.
Instructor’s Notes:
The three major sections of a value stream map are:
- Information Flow: This section shows formal and informal communication flow. Note that there is no standardized direction of communication flow, as it can flow in any direction
- Product Flow: This section highlights the process flow that is usually drawn from left to right. Any subtasks or parallel tasks are also drawn beneath the main flow. It also includes details related to the team performing the task and data points of crucial process KPIs (Key Performance Indicators). The yellow boxes showcase number of tasks pending in a particular process
- Time Ladder: This section visually presents the timeline of the value stream. The upper portion of the time ladder showcases the average wait time a process task spends in the queue. The lower portion of the time ladder highlights the average time, when value is actually being added to the feature/product during that stage of process
Slide 4
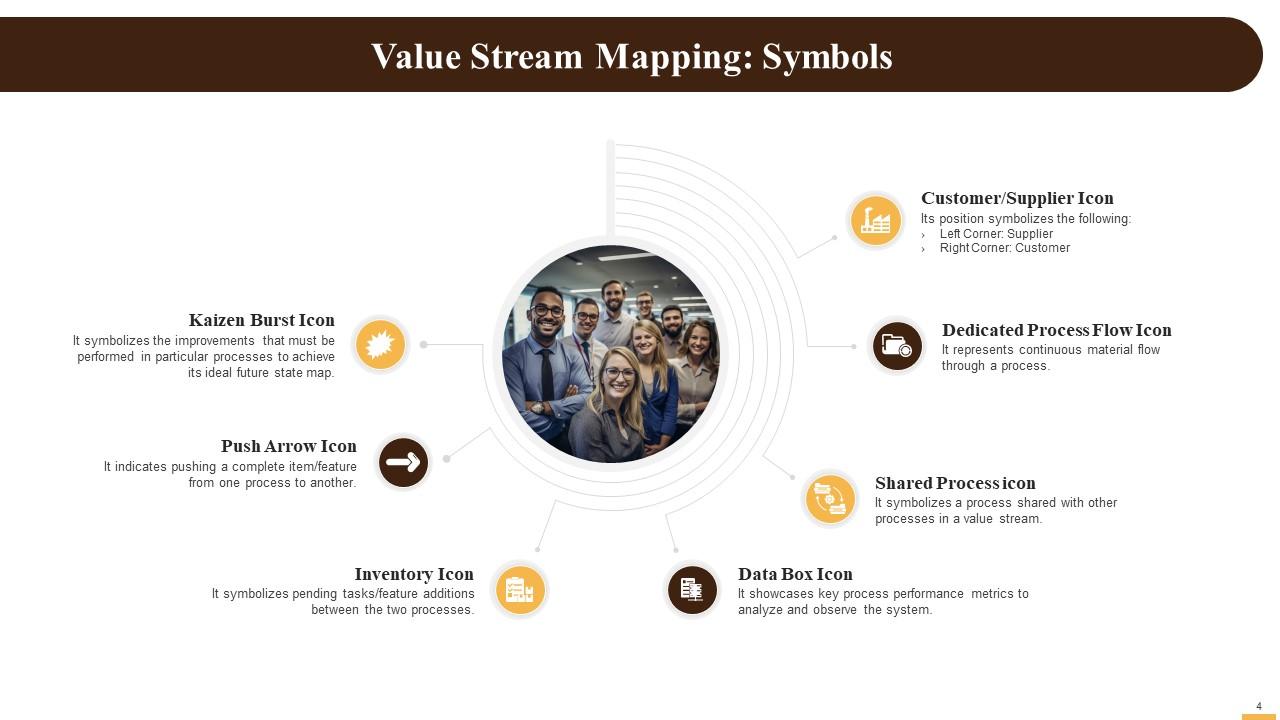
This slide showcases common symbols used in value stream mapping: Customer/Supplier, Dedicated Process Flow, Shared Process, Data Box Icon, Inventory, Push Arrow, and Kaizen Burst Icon.
Slide 5
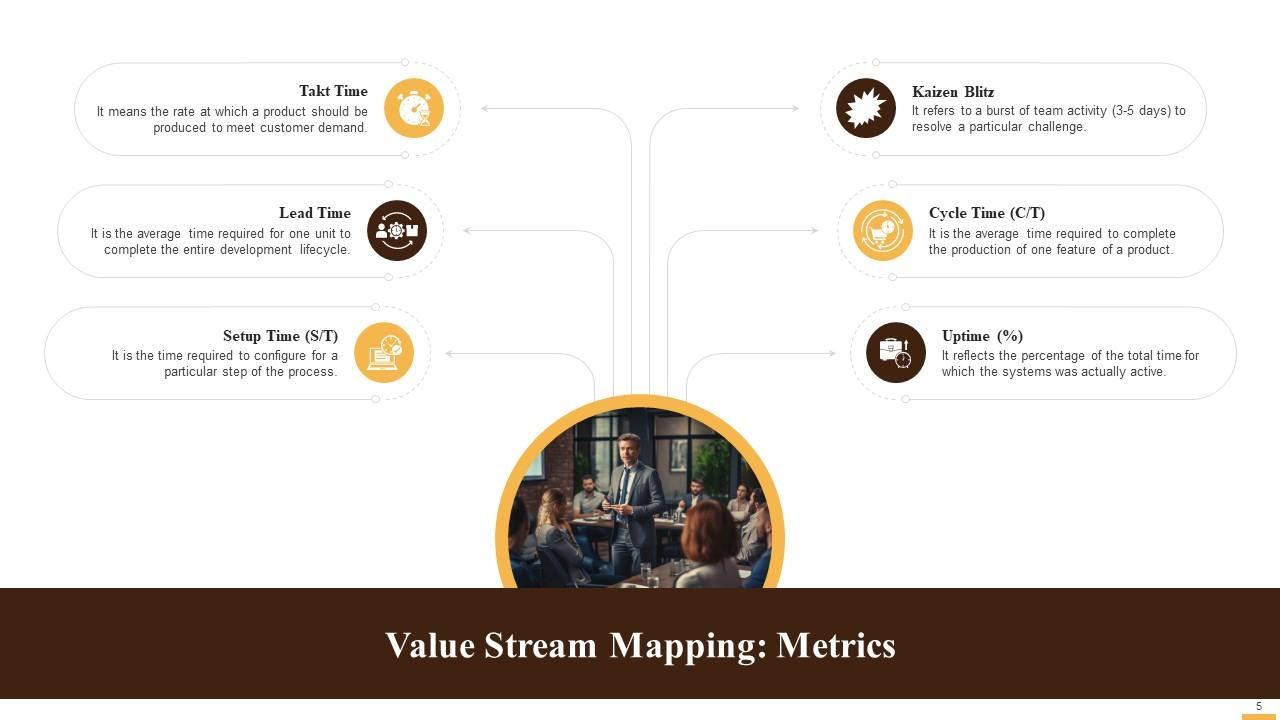
This slide provide information about value stream mapping performance metrics such as Cycle Time, Setup Time (S/T), Uptime (%), Lead Time, Takt Time, and Kaizen Blitz.
Instructor’s Notes:
How to Calculate Takt Time?
- 7.5 hours per working day (x) 20 work days per month = 150 work hours per month available
- 150 work hours per month = 9,000 working minutes per month
- If a client submits an average of 150 features requests per month
- So, Takt Time = Available Working Minutes per Month/Average Count of Features Requested
- Takt Time = 9,000/150 = 60 minutes
- Hence, one feature should be produced in 60 minutes or less to meet client demand
Slide 6
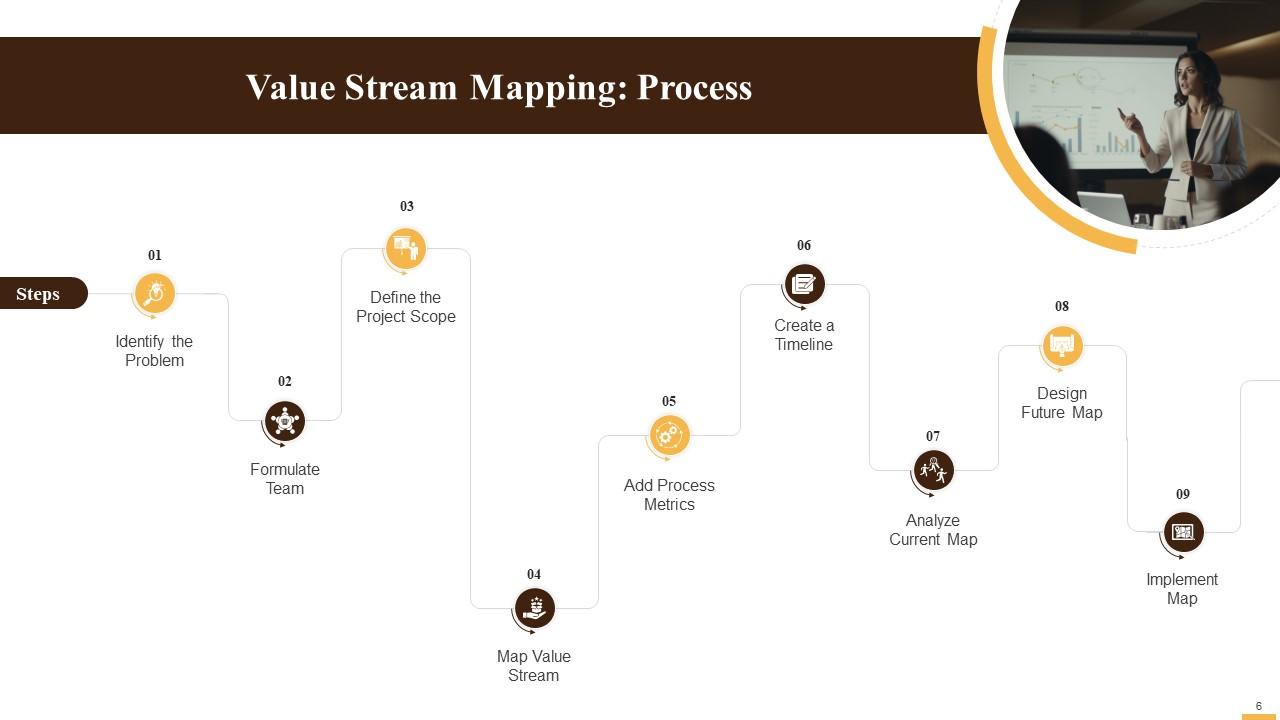
This slide showcases the process of drawing a value stream map. The steps are: Identify the problem, formulate the team, define project scope, map value stream, add process metrics, create a timeline, analyze the current map, design a future map, and implement the map.
Instructor’s Notes:
The steps of the value stream mapping (VSM) process are:
- Step 1 - Identify the Problem: Think from the customer's viewpoint and conduct brainstorming sessions to identify both internal and external process inefficiencies
- Step 2 - Formulate Team: Choose employees from departments to make a cross-functional Value Stream Mapping (VSM) team that will have varied perspectives. Keep a mix of both executives and those in supporting roles in the VSM team for better visibility of internal issues. Stakeholders with differing interests can be asked to join to have an outsider's point of view
- Step 3 - Define the Project Scope: Pre-decide the VSM project scope that is: Should it be done for a specific step or for the whole process?
- Step 4 - Map Value Stream: Use VSM symbols to map the process into three segments, i.e., information flow, product flow, and time flow
- Step 5 - Add Process Metrics: Once the process is mapped, add relevant process performance metrics such as inventory held, cycle time, transfer time, etc.
- Step 6 - Create a Timeline: Create a process timeline with the calculation and addition of lead and cycle times
- Step 7 - Analyze Current Map: Perform Kaizen bursts to analyze the current process's VSM to identify overproduction, inventory, motion, defects, over-processing, waiting, and transport wastes
- Step 8 - Design Future Map: Use insights from Kaizen bursts for process improvements and design a future value stream map for the process
- Step 9 - Implement Map: Eventually, implement the future value stream map to achieve process efficiency
Slide 7
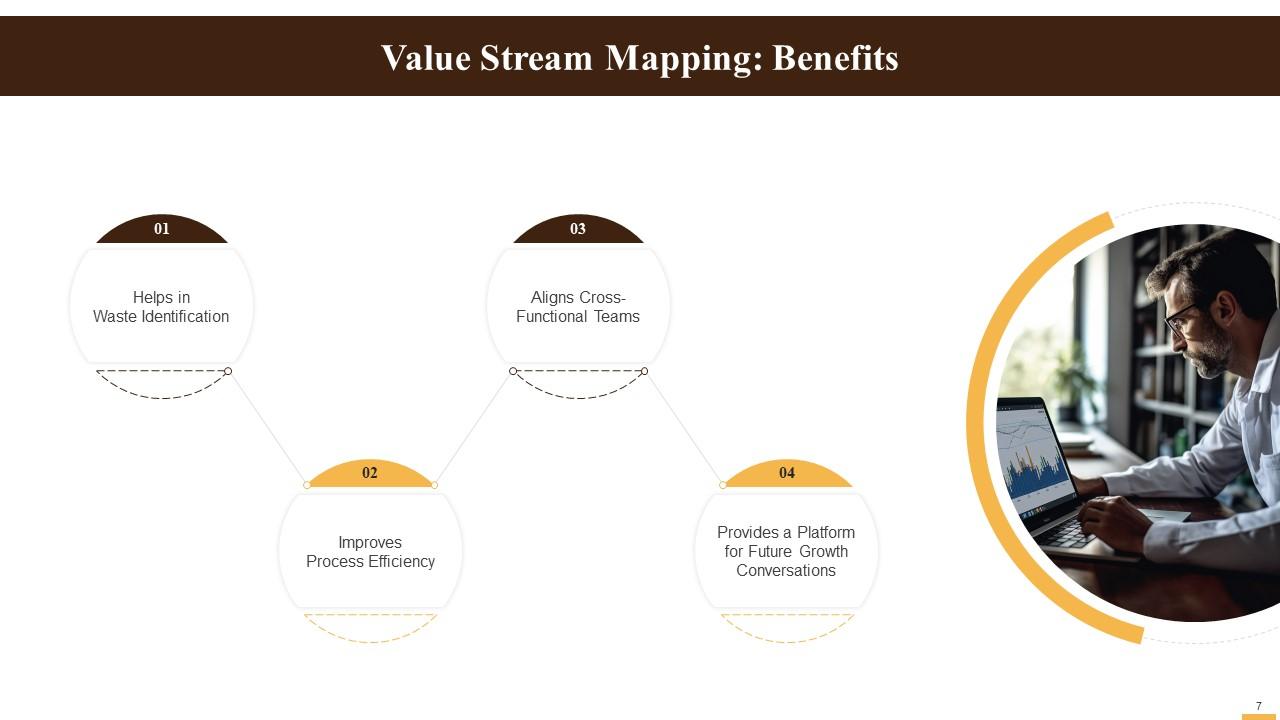
This slide lists the advantages of value stream mapping. It helps in waste identification, improves process efficiency, aligns cross-functional teams, and provides a platform for conversation on future growth.
Instructor’s Notes:
The benefits of VSM are:
- Helps in Waste Identification: With graphical illustration, VSM helps identify value addition and non-value addition activities. It helps pinpoint wastes that are occurring within the process
- Improves Process Efficiency: VSM labels and links information, product, and time flow to determine appropriate takt time, lead time, and cycle times between stages of the process for faster delivery of products to customers. It also helps in proper resource allocation to improve the system's quality
- Aligns Cross-Functional Teams: VSM team includes interdepartmental employees and stakeholders, which supports a shared understanding of the process. It helps focus on long-term goals instead of concentrating solely on their roles and responsibilities
- Provides a Platform for Future Growth Conversations: Post-implementation of the future state, VSM team with a greater understanding of the process, can devise plans
Value Stream Mapping For Kaizen Training Ppt with all 27 slides:
Use our Value Stream Mapping For Kaizen Training Ppt to effectively help you save your valuable time. They are readymade to fit into any presentation structure.
-
Editable, diversified, compatible with MS PPT and Google Slides, and on top of that finest graphics!! I mean in the words of the famous Ross Geller, “What more do you want!”
-
Easy to use and customize templates. Helped me give a last minute presentation.


