Weighted Scoring Prioritization Model Powerpoint Presentation Slides
Our Weighted Scoring Prioritization Model Powerpoint Presentation Slides are topically designed to provide an attractive backdrop to any subject. Use them to look like a presentation pro.
Our Weighted Scoring Prioritization Model Powerpoint Presentation Slides are topically designed to provide an attractive ba..
- Google Slides is a new FREE Presentation software from Google.
- All our content is 100% compatible with Google Slides.
- Just download our designs, and upload them to Google Slides and they will work automatically.
- Amaze your audience with SlideTeam and Google Slides.
-
Want Changes to This PPT Slide? Check out our Presentation Design Services
- WideScreen Aspect ratio is becoming a very popular format. When you download this product, the downloaded ZIP will contain this product in both standard and widescreen format.
-

- Some older products that we have may only be in standard format, but they can easily be converted to widescreen.
- To do this, please open the SlideTeam product in Powerpoint, and go to
- Design ( On the top bar) -> Page Setup -> and select "On-screen Show (16:9)” in the drop down for "Slides Sized for".
- The slide or theme will change to widescreen, and all graphics will adjust automatically. You can similarly convert our content to any other desired screen aspect ratio.
Compatible With Google Slides

Get This In WideScreen
You must be logged in to download this presentation.
PowerPoint presentation slides
This complete deck can be used to present to your team. It has PPT slides on various topics highlighting all the core areas of your business needs. This complete deck focuses on Weighted Scoring Prioritization Model Powerpoint Presentation Slides and has professionally designed templates with suitable visuals and appropriate content. This deck consists of total of thirty seven slides. All the slides are completely customizable for your convenience. You can change the colour, text and font size of these templates. You can add or delete the content if needed. Get access to this professionally designed complete presentation by clicking the download button below.
People who downloaded this PowerPoint presentation also viewed the following :
Content of this Powerpoint Presentation
Slide 1: This slide introduces Weighted Scoring Prioritization Model. State your Company name and begin.
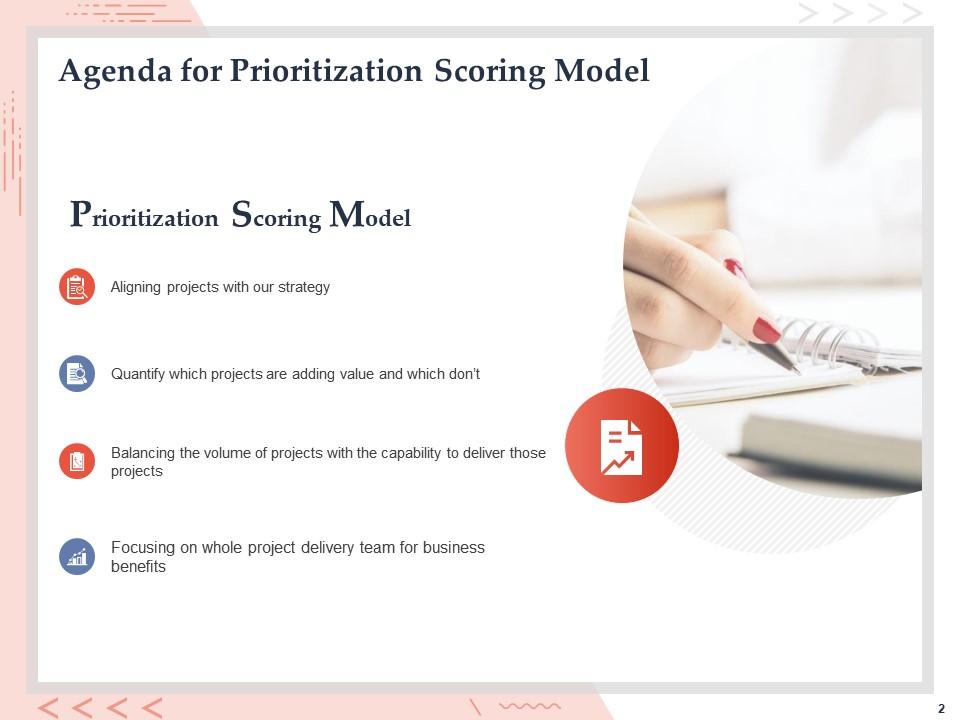
Slide 2: This slide displays Agenda for Prioritization Scoring Model
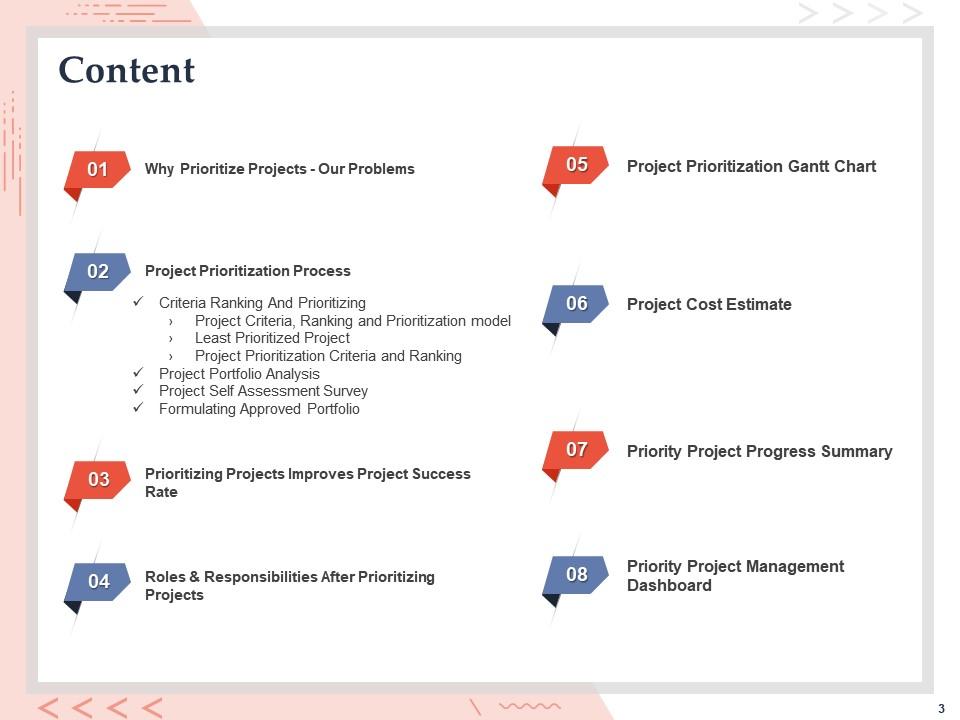
Slide 3: This slide displays Contents.
Slide 4: This slide displays Contents of the presentation.
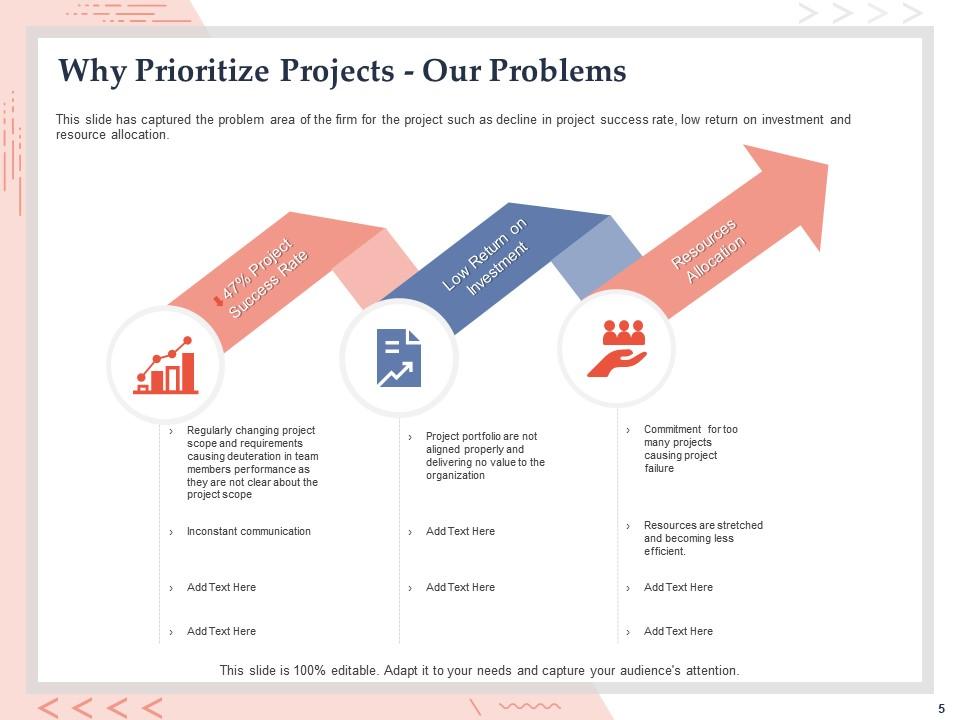
Slide 5: This slide has captured the problem area of the firm for the project such as decline in project success rate, low return on investment and resource allocation.
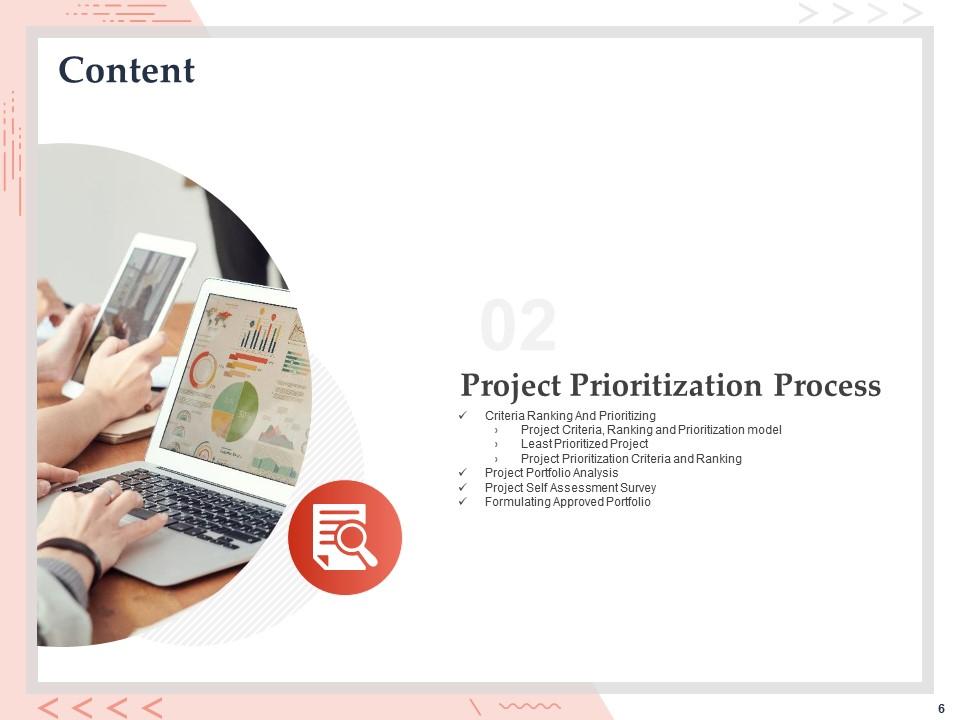
Slide 6: This slide displays Contents.
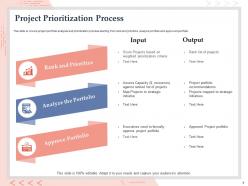
Slide 7: This slide is covers project portfolio analysis and prioritization process starting from rank and prioritize, analyze portfolio and approved portfolio.
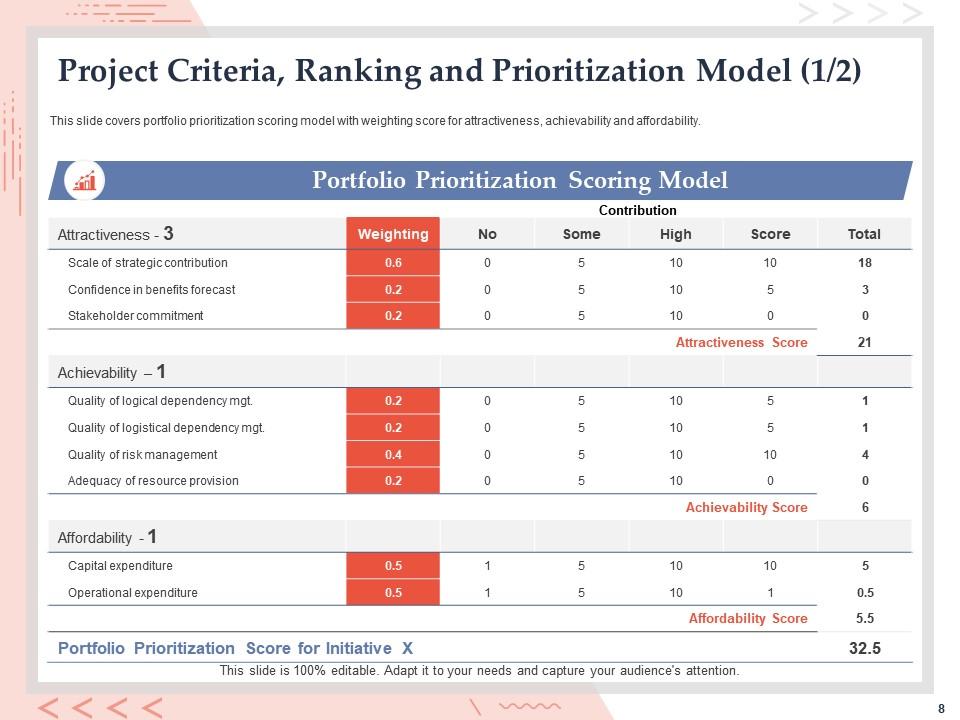
Slide 8: This slide covers portfolio prioritization scoring model with weighting score for attractiveness, achievability and affordability.
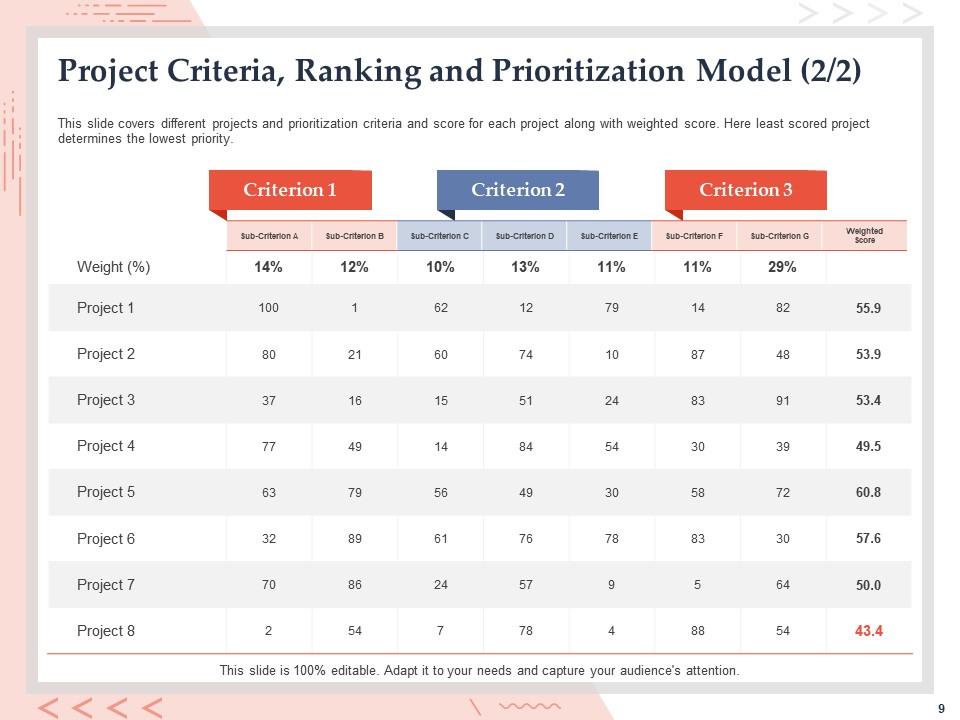
Slide 9: This slide covers different projects and prioritization criteria and score for each project along with weighted score. Here least scored project determines the lowest priority.
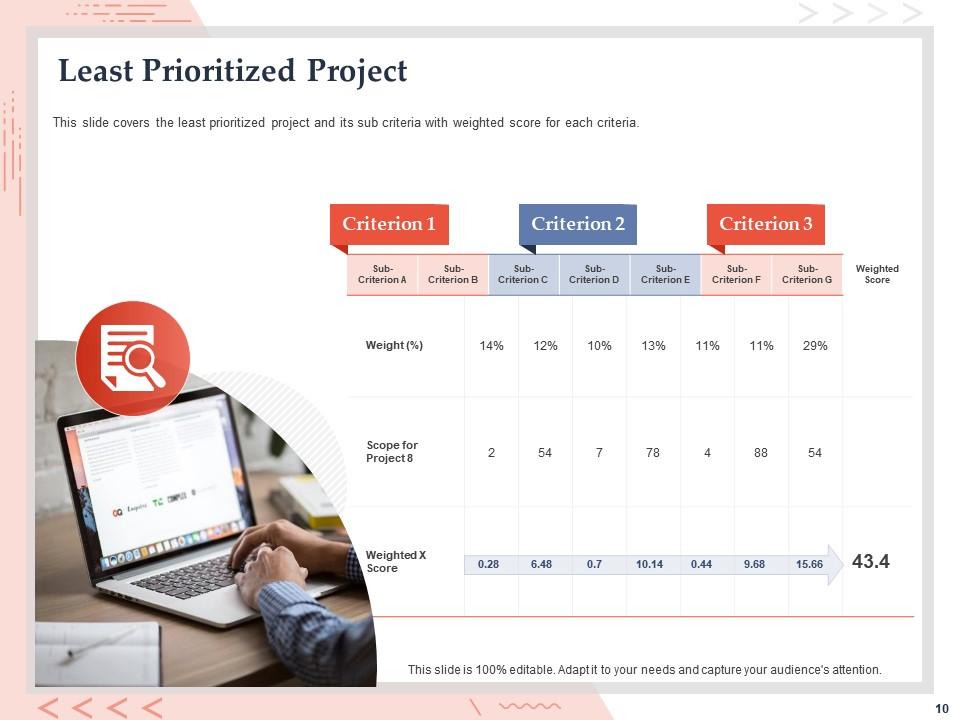
Slide 10: This slide covers the least prioritized project and its sub criteria with weighted score for each criteria.
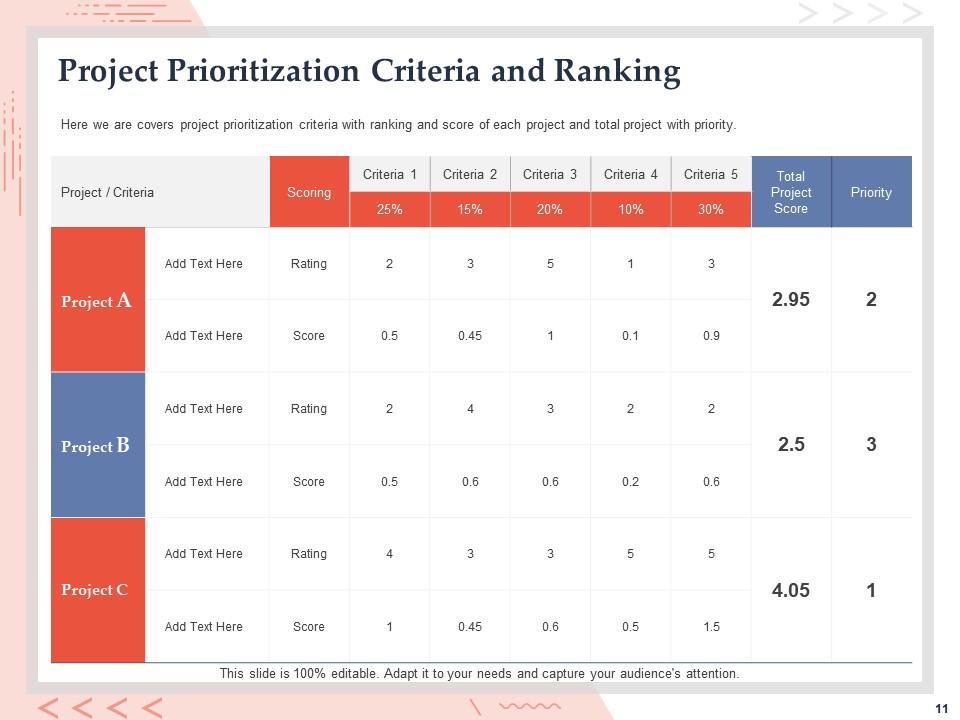
Slide 11: This slide covers project prioritization criteria with ranking and score of each project and total project with priority.
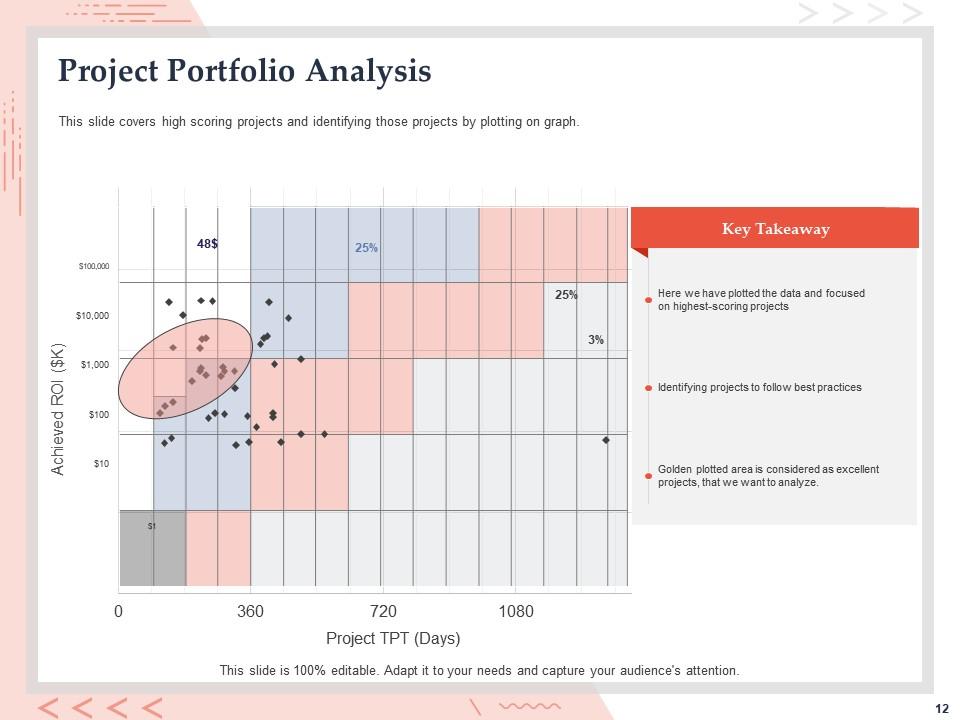
Slide 12: This slide covers high scoring projects and identifying those projects by plotting on graph.
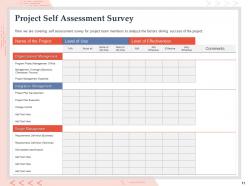
Slide 13: This slide covers self assessment survey for project team members to analyze the factors driving success of the project.
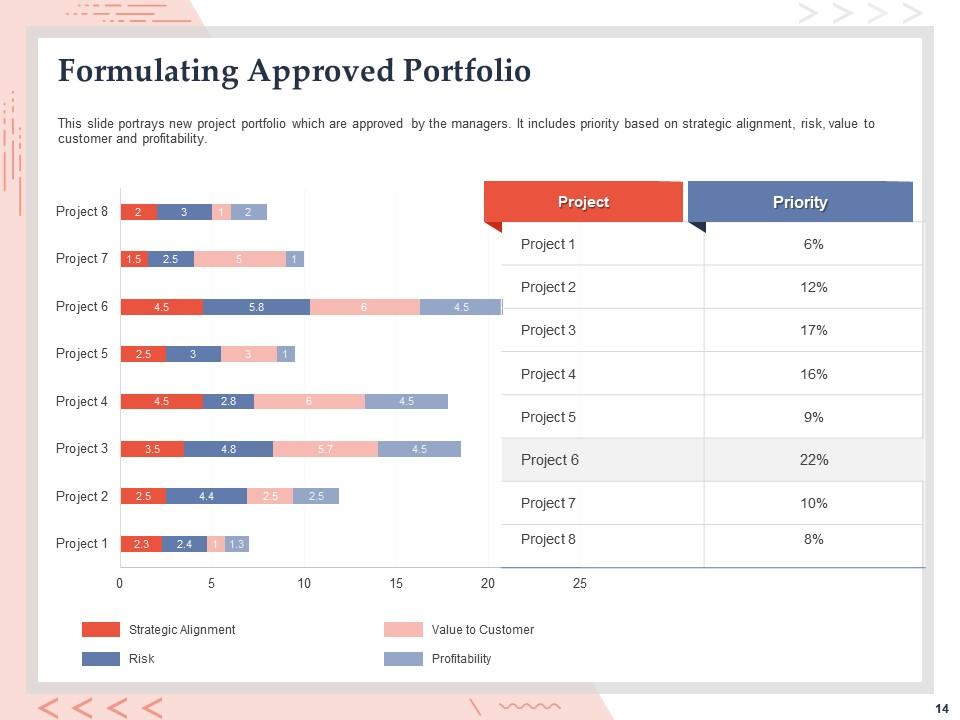
Slide 14: This slide portrays new project portfolio which are approved by the managers. It includes priority based on strategic alignment, risk, value to customer and profitability.
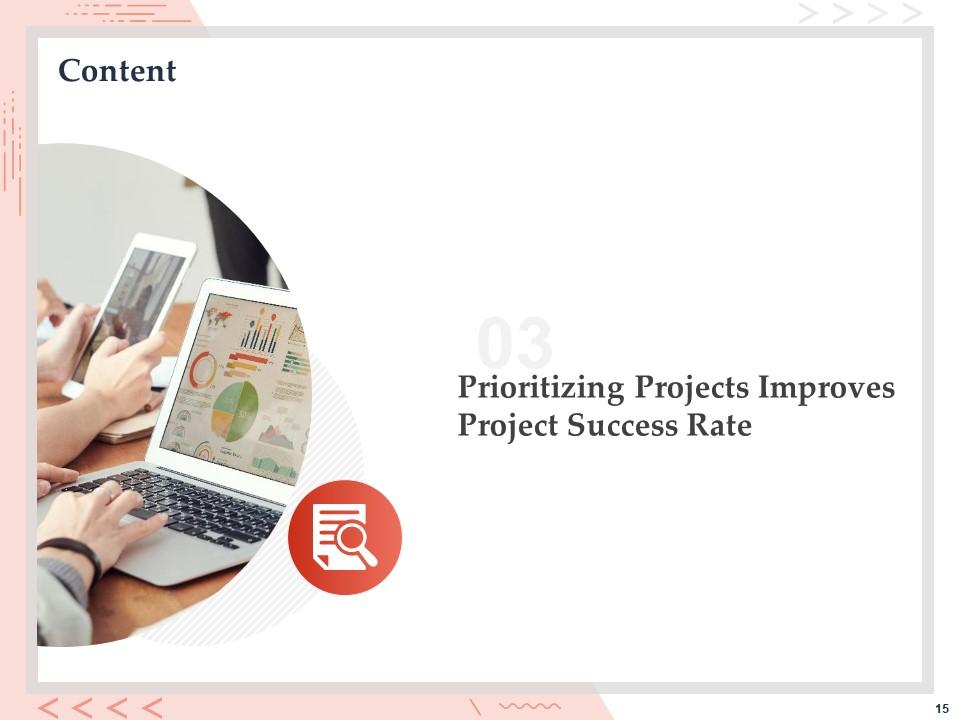
Slide 15: This slide displays Contents
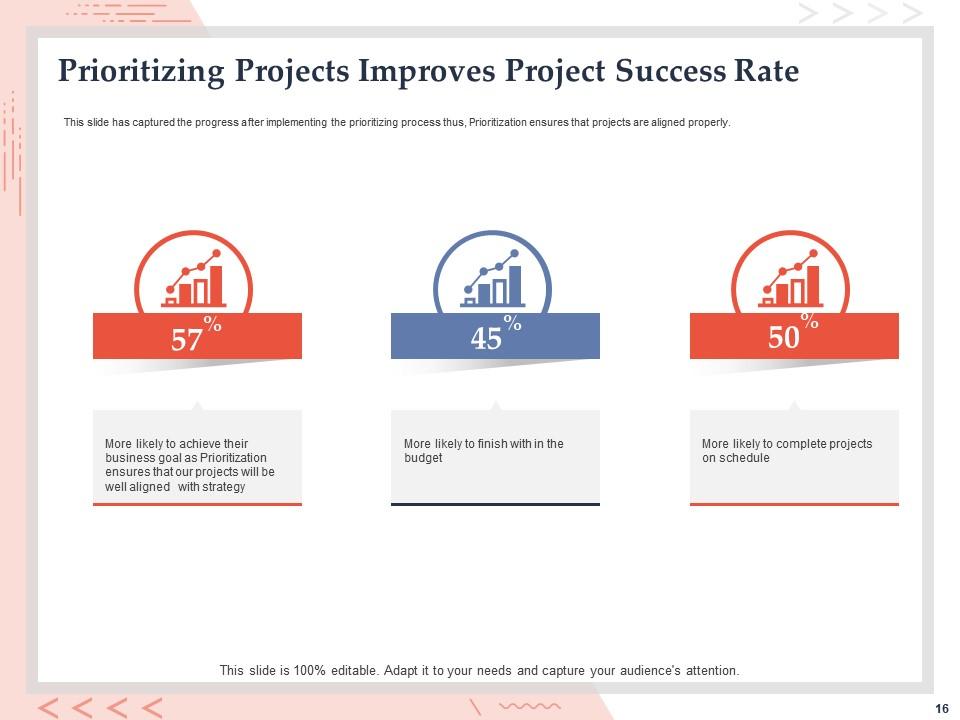
Slide 16: This slide has captured the progress after implementing the prioritizing process thus, Prioritization ensures that projects are aligned properly.
Slide 17: This slide displays Contents.
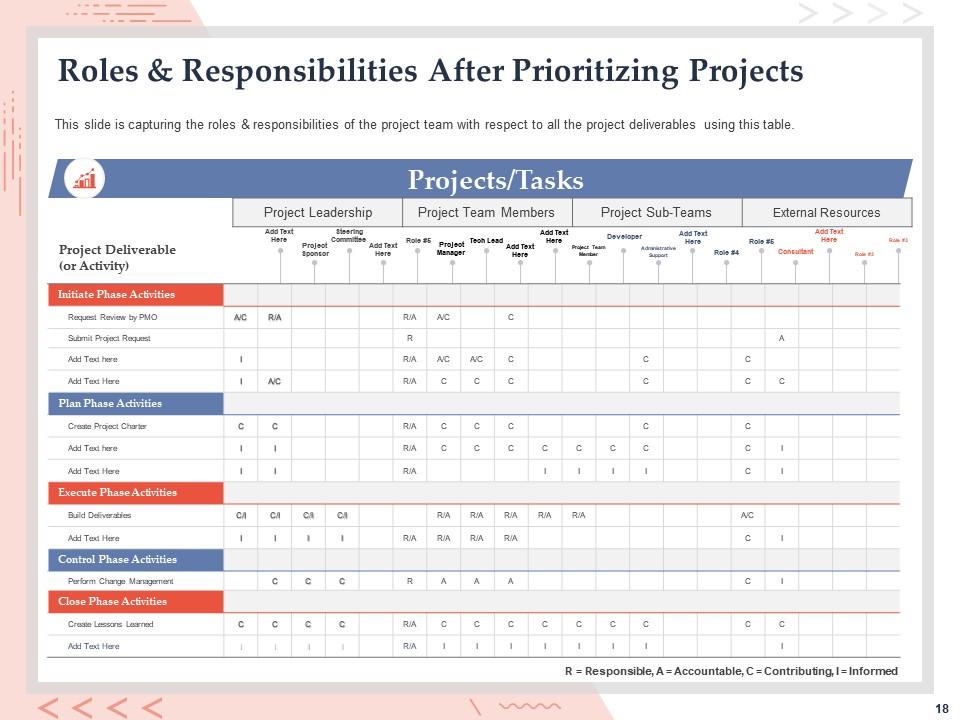
Slide 18: This slide is capturing the roles & responsibilities of the project team with respect to all the project deliverables using this table.
Slide 19: This slide displays Contents
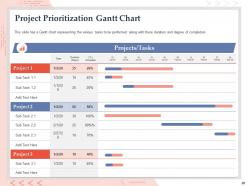
Slide 20: This slide has a Gantt chart representing the various tasks to be performed along with there duration and degree of completion.
Slide 21: This slide depicts Contents.
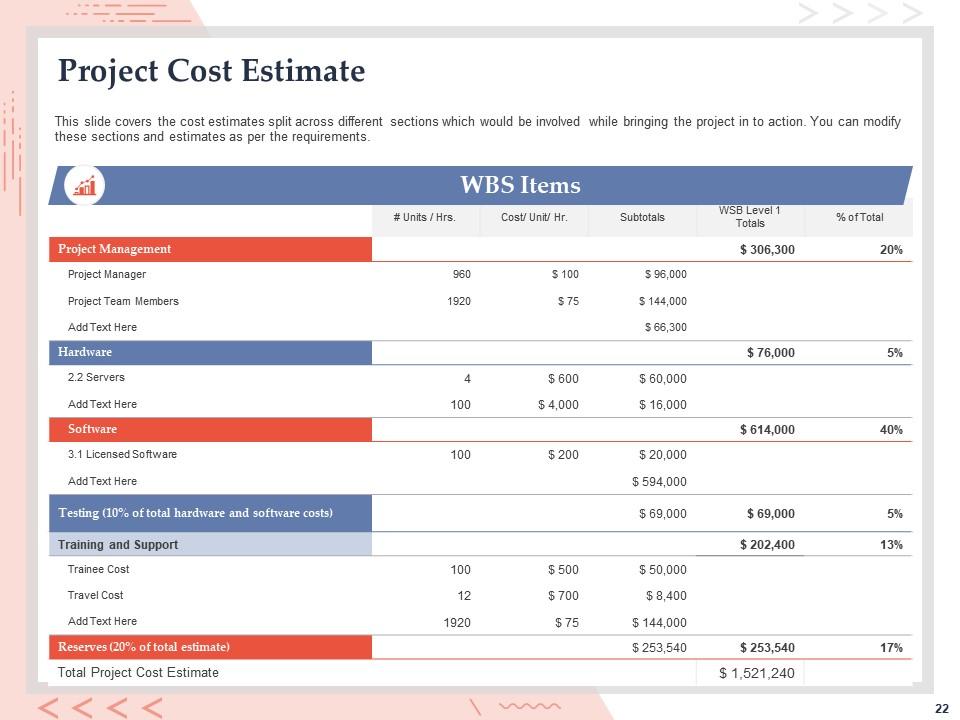
Slide 22: This slide covers the cost estimates split across different sections which would be involved while bringing the project in to action. You can modify these sections and estimates as per the requirements.
Slide 23: This slide displays Contents.
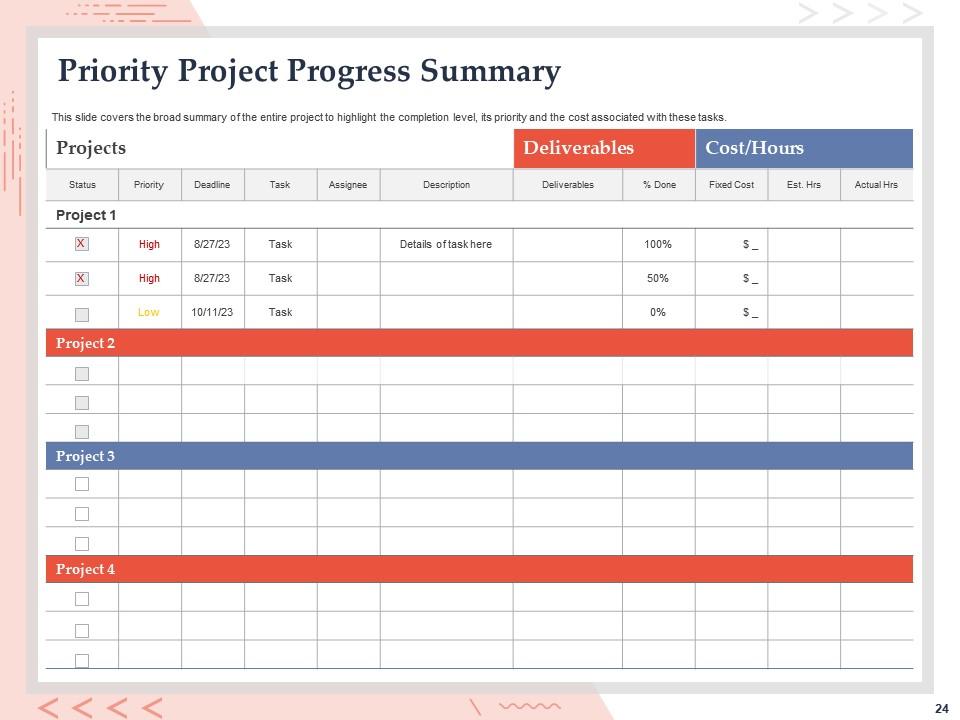
Slide 24: This slide covers the broad summary of the entire project to highlight the completion level, its priority and the cost associated with these tasks.
Slide 25: This slide displays Contents.
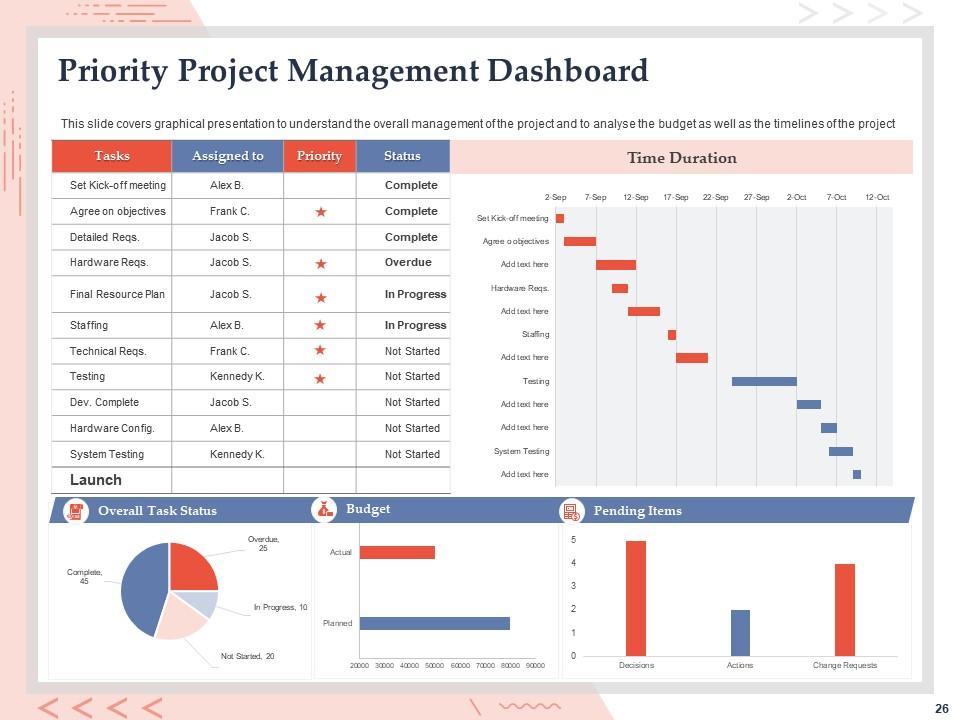
Slide 26: This slide covers graphical presentation to understand the overall management of the project and to analyze the budget as well as the timelines of the project.
Slide 27: This is Weighted Scoring Prioritization Model Icons Slide.
Slide 28: This slide is titled as Additional Slides for moving forward.
Slide 29: This is Our team slide with Names and Designations.
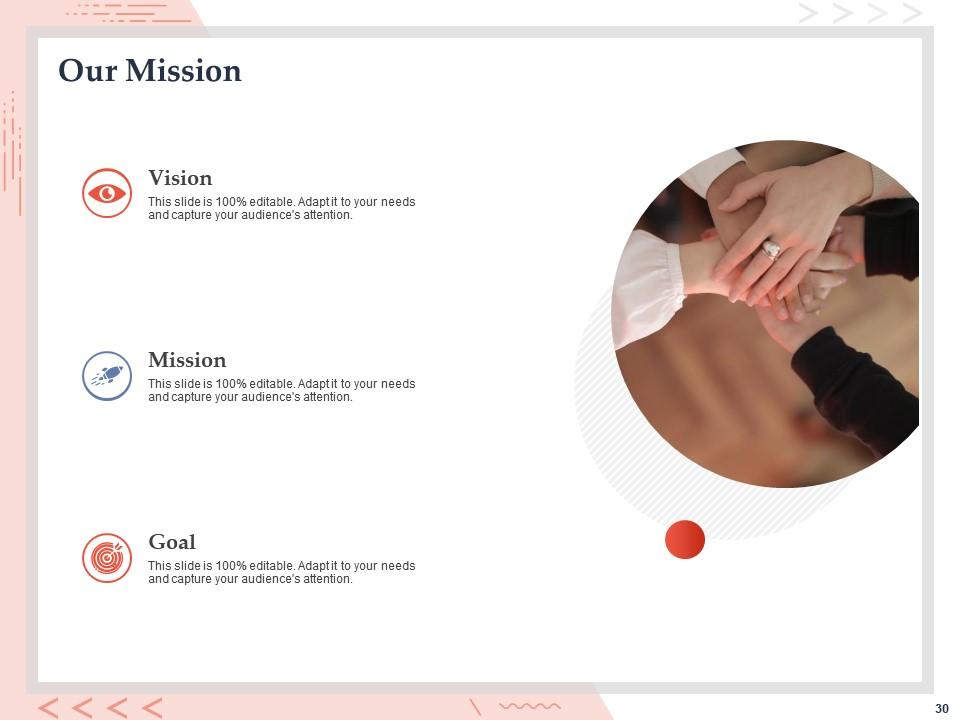
Slide 30: This slide Vision, Mission and Goal of the Organization.
Slide 31: This slide displays Goals of the Organization
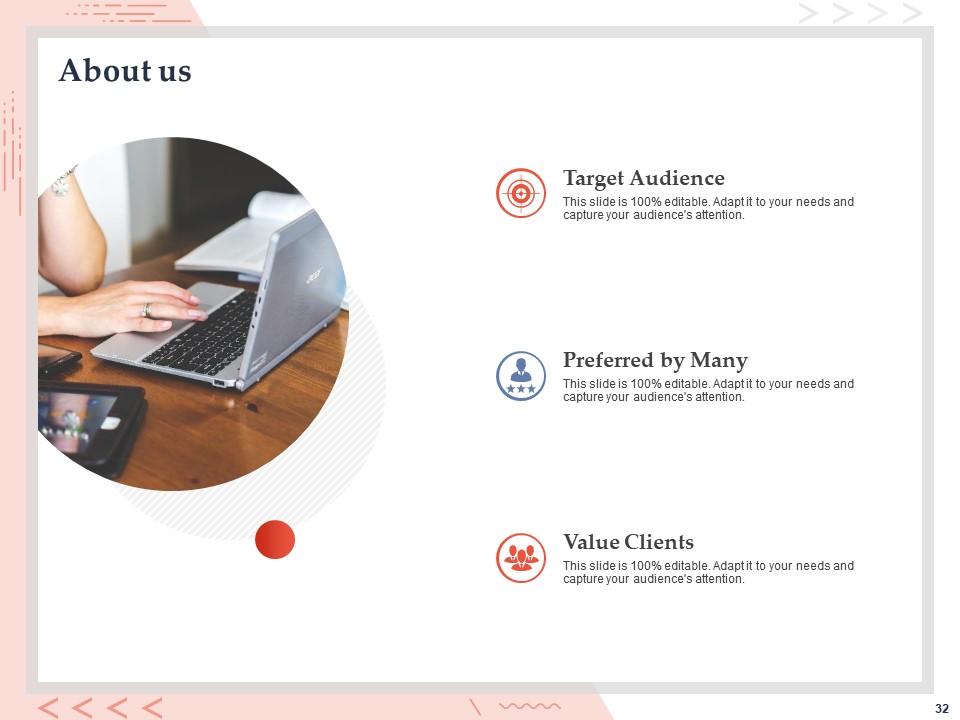
Slide 32: This is About Us slide to showcase Company specifications.
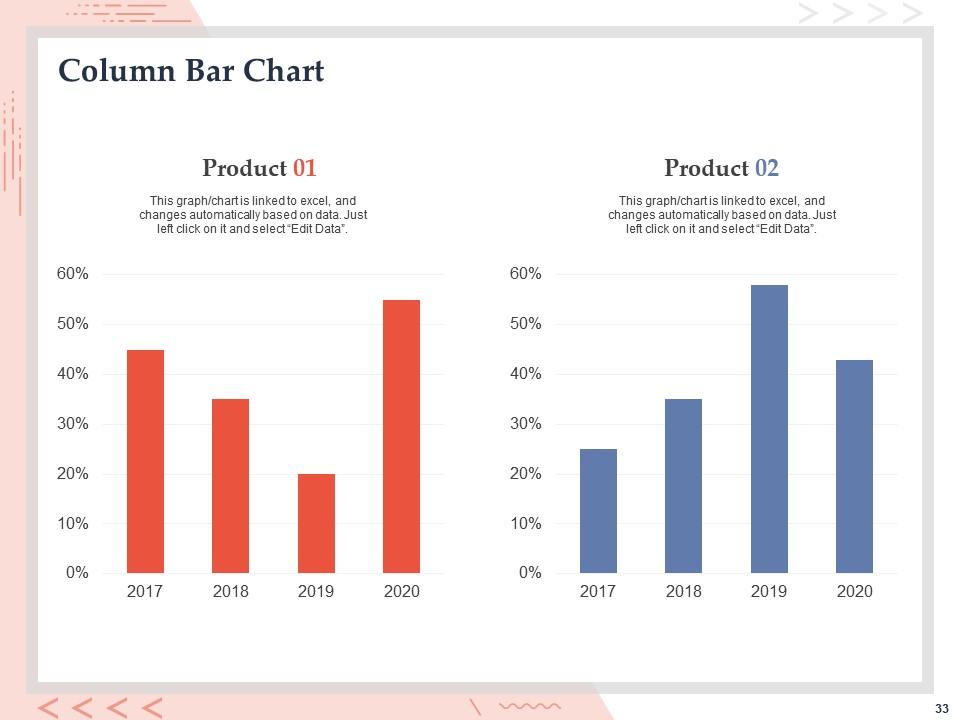
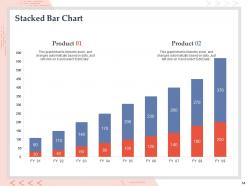
Slide 33: This slide shows Column chart for Comparison of products.
Slide 34: This slide shows comparison of products.
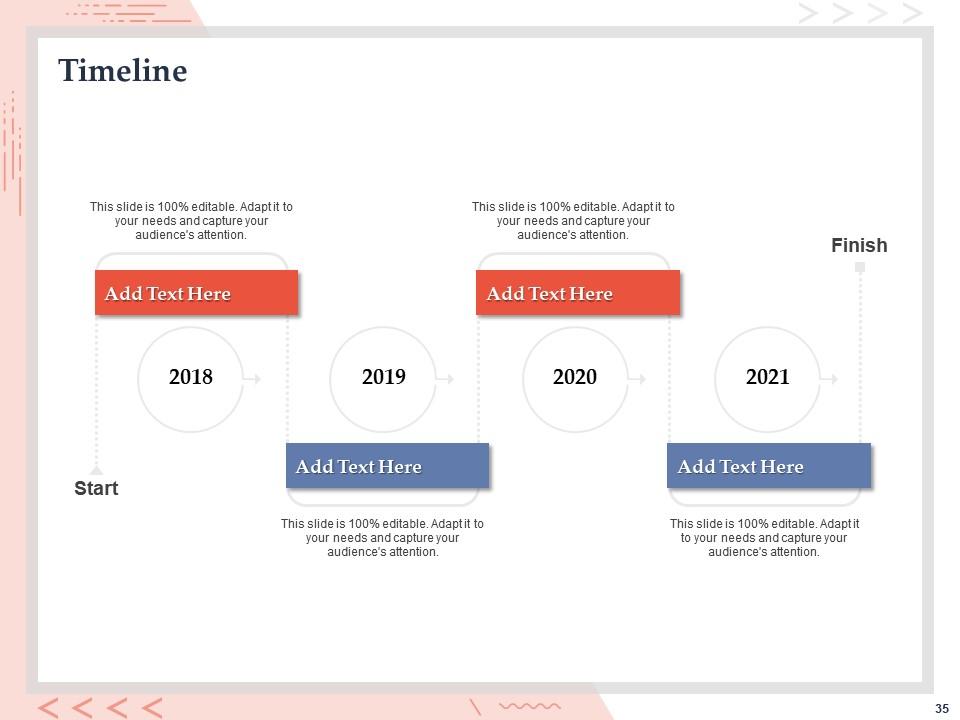
Slide 35: This slide depicts four years Timeline years.
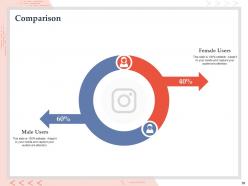
Slide 36: This slide displays Comparison between Male and female users.
Slide 37: This is Thank You slide with Contact details.
Weighted Scoring Prioritization Model Powerpoint Presentation Slides with all 37 slides:
Use our Weighted Scoring Prioritization Model Powerpoint Presentation Slides to effectively help you save your valuable time. They are readymade to fit into any presentation structure.
-
Content of slide is easy to understand and edit.
-
Colors used are bright and distinctive.
-
Nice and innovative design.
-
Very unique, user-friendly presentation interface.
-
Very unique, user-friendly presentation interface.


