A Comprehensive Guide Step 6 Kpi Dashboard To Configure User Experience Data Analytics SS
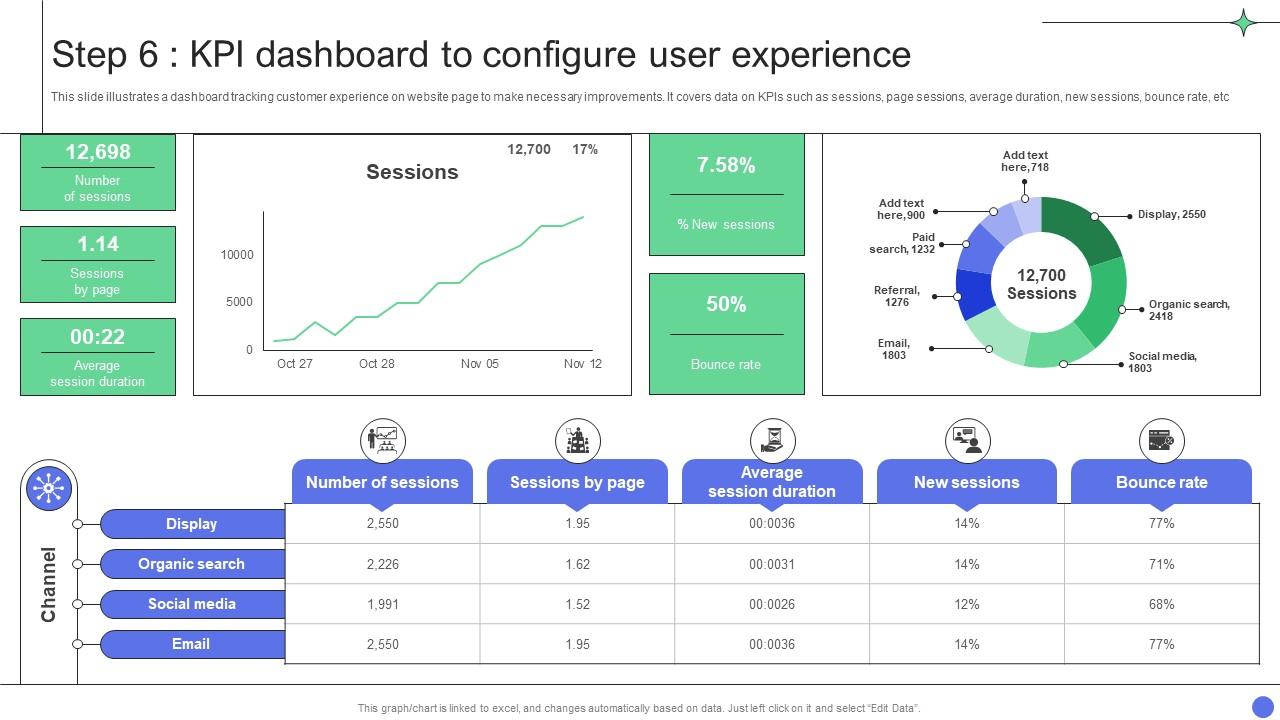
This slide illustrates a dashboard tracking customer experience on website page to make necessary improvements. It covers data on KPIs such as sessions, page sessions, average duration, new sessions, bounce rate, etc
This slide illustrates a dashboard tracking customer experience on website page to make necessary improvements. It covers d..
- Google Slides is a new FREE Presentation software from Google.
- All our content is 100% compatible with Google Slides.
- Just download our designs, and upload them to Google Slides and they will work automatically.
- Amaze your audience with SlideTeam and Google Slides.
-
Want Changes to This PPT Slide? Check out our Presentation Design Services
- WideScreen Aspect ratio is becoming a very popular format. When you download this product, the downloaded ZIP will contain this product in both standard and widescreen format.
-

- Some older products that we have may only be in standard format, but they can easily be converted to widescreen.
- To do this, please open the SlideTeam product in Powerpoint, and go to
- Design ( On the top bar) -> Page Setup -> and select "On-screen Show (16:9)” in the drop down for "Slides Sized for".
- The slide or theme will change to widescreen, and all graphics will adjust automatically. You can similarly convert our content to any other desired screen aspect ratio.
Compatible With Google Slides

Get This In WideScreen
You must be logged in to download this presentation.
PowerPoint presentation slides
This slide illustrates a dashboard tracking customer experience on website page to make necessary improvements. It covers data on KPIs such as sessions, page sessions, average duration, new sessions, bounce rate, etc Deliver an outstanding presentation on the topic using this A Comprehensive Guide Step 6 Kpi Dashboard To Configure User Experience Data Analytics SS Dispense information and present a thorough explanation of Bounce Rate, New Sessions, Average Session Duration using the slides given. This template can be altered and personalized to fit your needs. It is also available for immediate download. So grab it now.
People who downloaded this PowerPoint presentation also viewed the following :
A Comprehensive Guide Step 6 Kpi Dashboard To Configure User Experience Data Analytics SS with all 11 slides:
Use our A Comprehensive Guide Step 6 Kpi Dashboard To Configure User Experience Data Analytics SS to effectively help you save your valuable time. They are readymade to fit into any presentation structure.
-
SlideTeam is the best in the business. Their templates are engaging and customizable. You can rely on them.
-
Appreciate the research and its presentable format.


