The ability to schedule is a challenging science and art to master. As you manage multiple projects, it might not be easy to track of your responsibilities and priorities, a key ingredient for success. A schedule chart template is the answer to resolving this pain point of all businesses. It lists all your unfinished activities, their due dates, and estimated completion times. A schedule chart template is a practical tool for work planning, management, and execution. You may allocate your time to finish the appropriate chores at the correct times, increasing your productivity.
Our 100% customizable schedule chart templates are the best in-class templates for this purpose. These presentations can all be modified entirely and edited, proving you both structure and design.
Let’s explore this universe of templates.
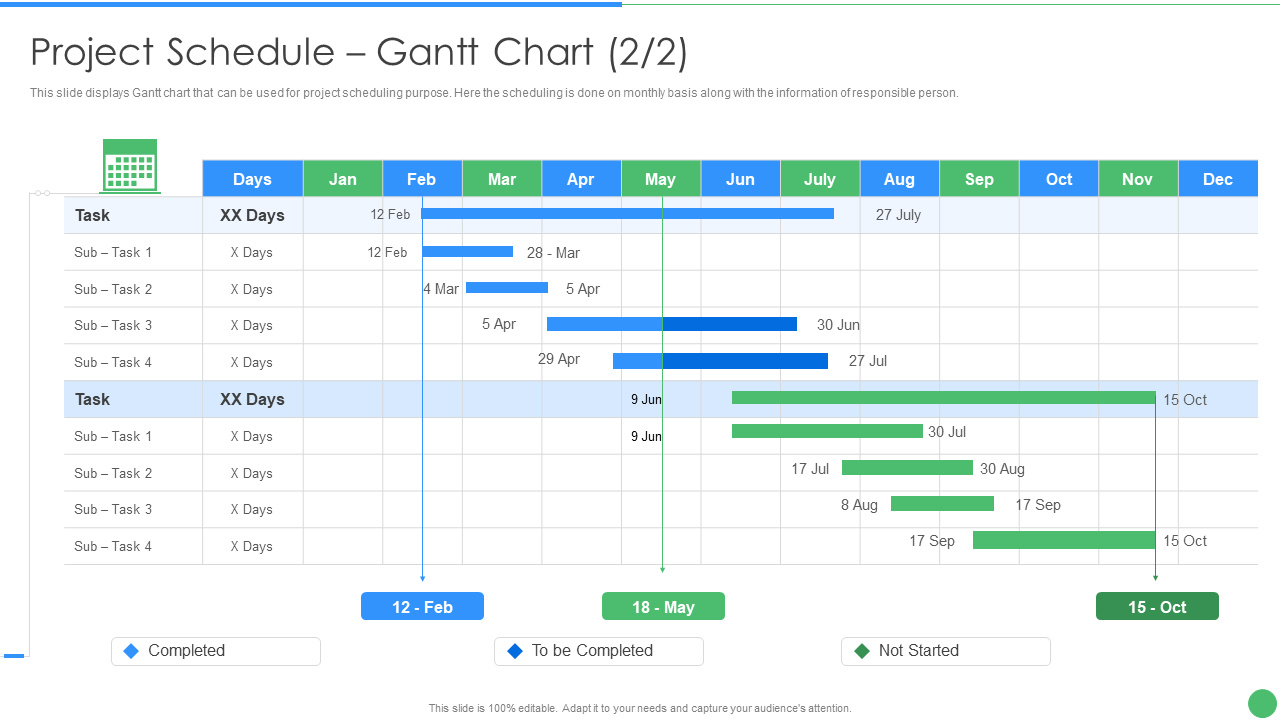
Template 1: Project Schedule Gantt Chart Toolkit
Gantt Charts are the bedrock of this template, with scheduling carried out monthly. Use this information to know all about information on the responsible party. With the help of this project schedule, elaborate more on the subject. Use the Gantt chart to discuss and navigate the project schedule using color coding as the relevant tool.
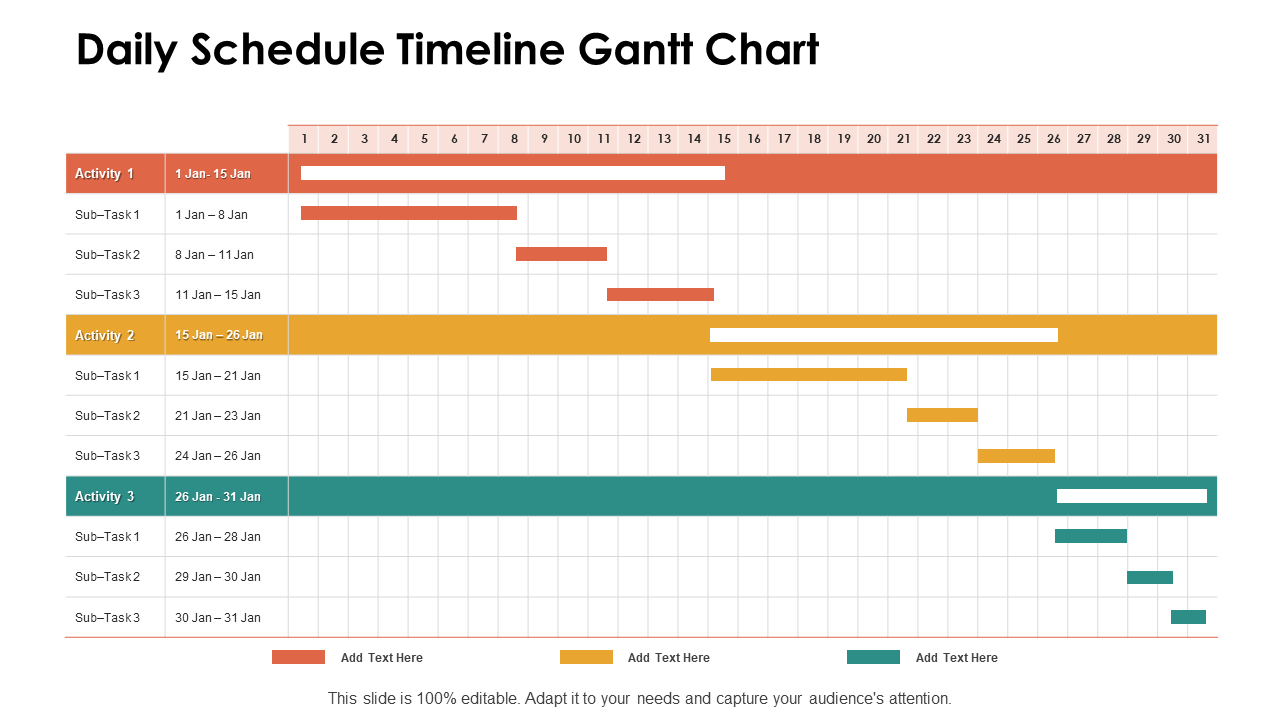
Template 2: Daily Schedule Timeline Gantt Chart PPT PowerPoint Presentation Infographics
You can create a highly optimized project management report using this content-ready Gantt Chart PPT diagram. This layout is a valuable tool for presenting professional detail of tasks or activity because it is simple yet effective. With this Gantt chart PPT theme, you can display activities and time allotted to business executives. Use this presentation template to showcase specific projects in this chart and illustrate to project members on how they can participate in the overall development. Not only that, but our PPT template can assist you in displaying the work breakdown structure of your project.
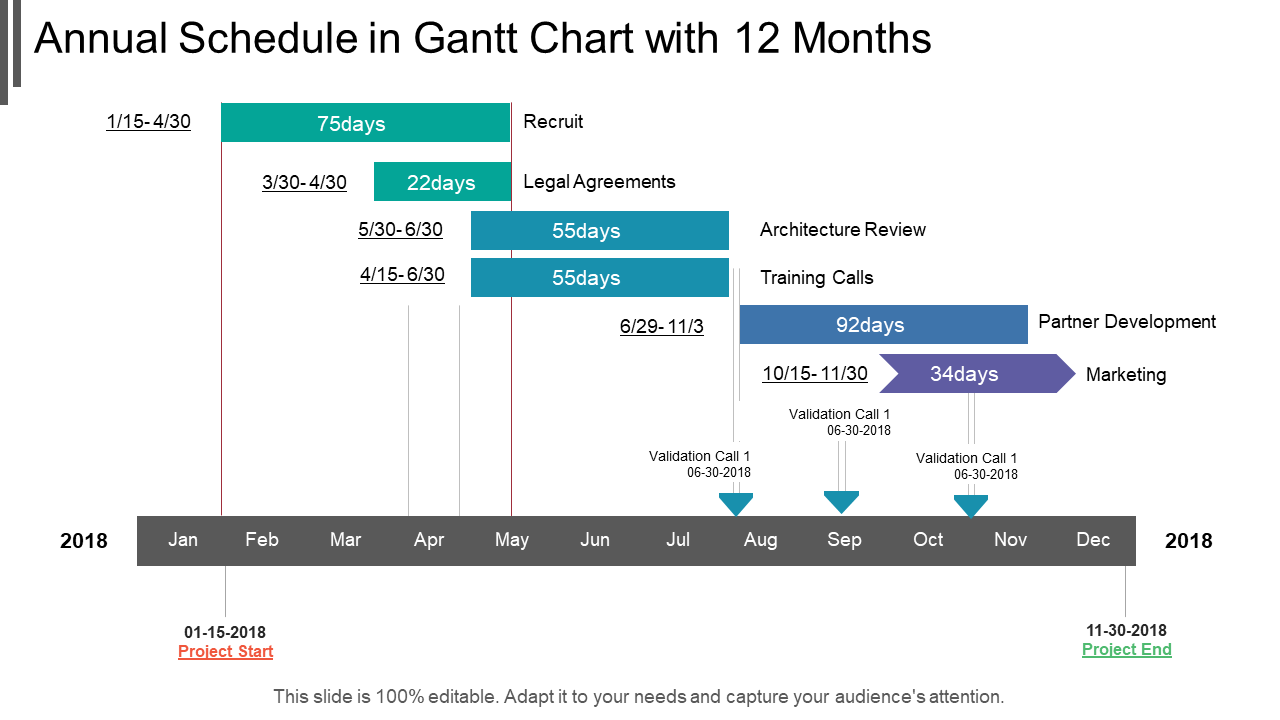
Template 3: Annual Schedule in Gantt Chart with 12 Months
With our annual schedule in Gantt Chart with 12 months, you can help people create the right image. It aids in dispelling false impressions. This set of slides is titled Annual Schedule in Gantt Chart with 12 months. This is a three-step procedure. Annual schedule, yearly schedule, and annual plan are the stages.
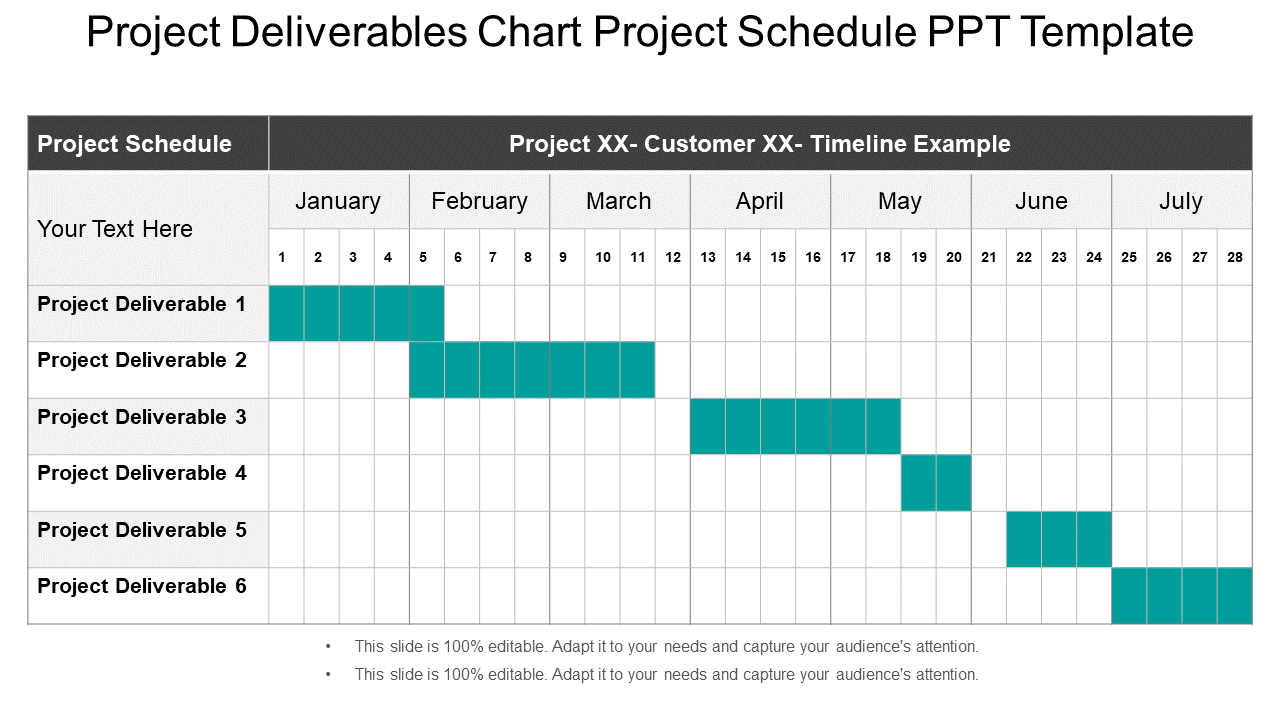
Template 4: Project Deliverables Chart Project Schedule PPT Template
Use our project deliverables chart project schedule PPT template to create flawless project status slides. This PPT slide, with experienced designers curating it, assists you in keeping track of your due dates and measurable key performance indicators. Please share it with your team to estimate completion and deadlines. Use it to display project schedules and save time. This predesigned template is compatible with software options and is fully customizable, including font, color, and visuals. It is helpful for everyday business presenters, salespeople, business leaders, and marketing professionals, and it is simple to incorporate it into ongoing presentations.
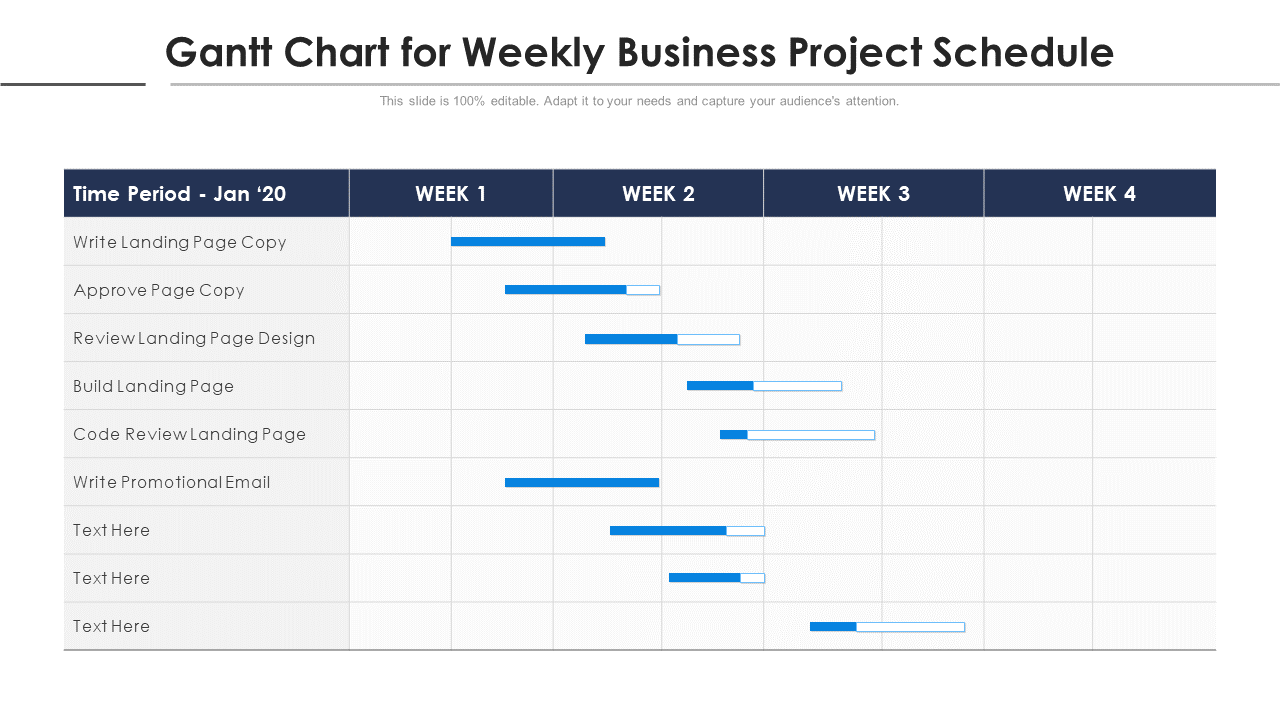
Template 5: Gantt Chart for Weekly Business Project Schedule
With our Gantt chart for weekly business project schedules, get a peek into how to organize tasks for a weekly task. For instance, in this schedule, learn that weeks 1-2 would have to involve writing landing page copy. Then, approval of the copy from the management has to follow and so on. Download now and wow your audience with the detailed attention you pay to tasks for that consummate big-ticket success is all important projects.
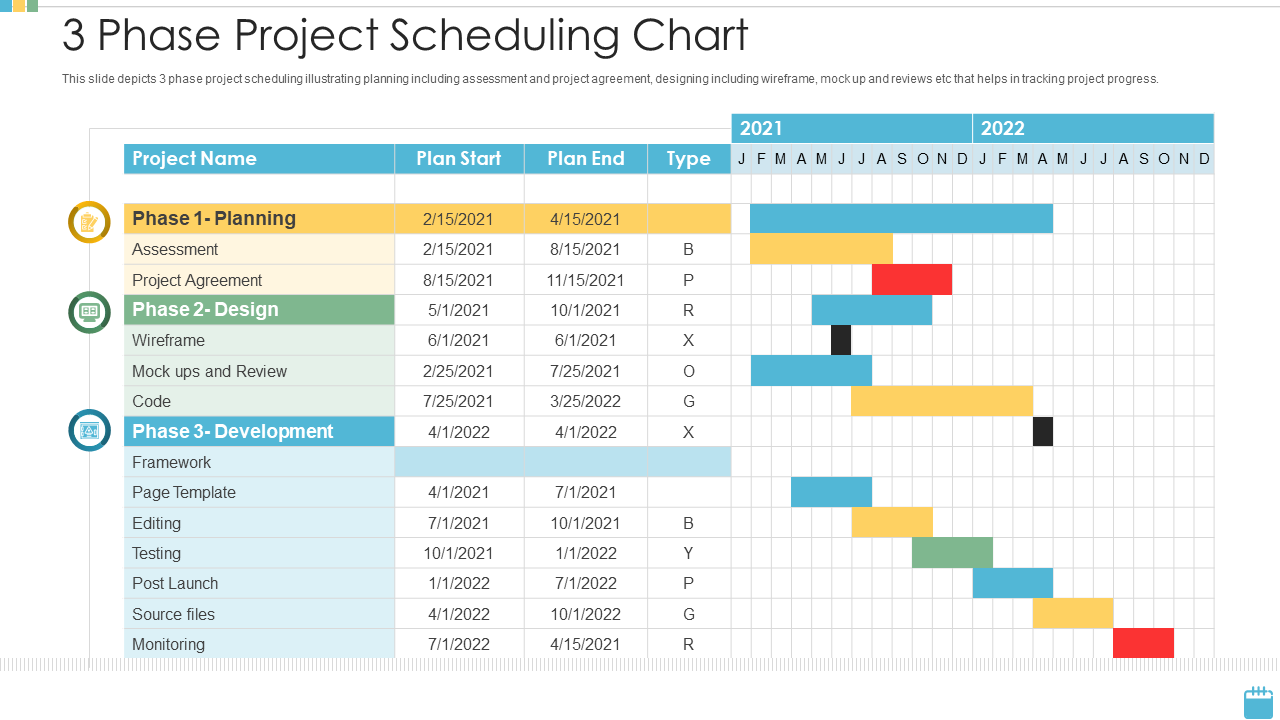
Template 6: Three-phase Project Scheduling Chart
Our three-phase project scheduling chart is typically designed to provide a visually appealing backdrop to any subject. Make yourself look like a presentation pro by using this structure, design and ideas. Planning, design, and development are the topics covered in these slides.
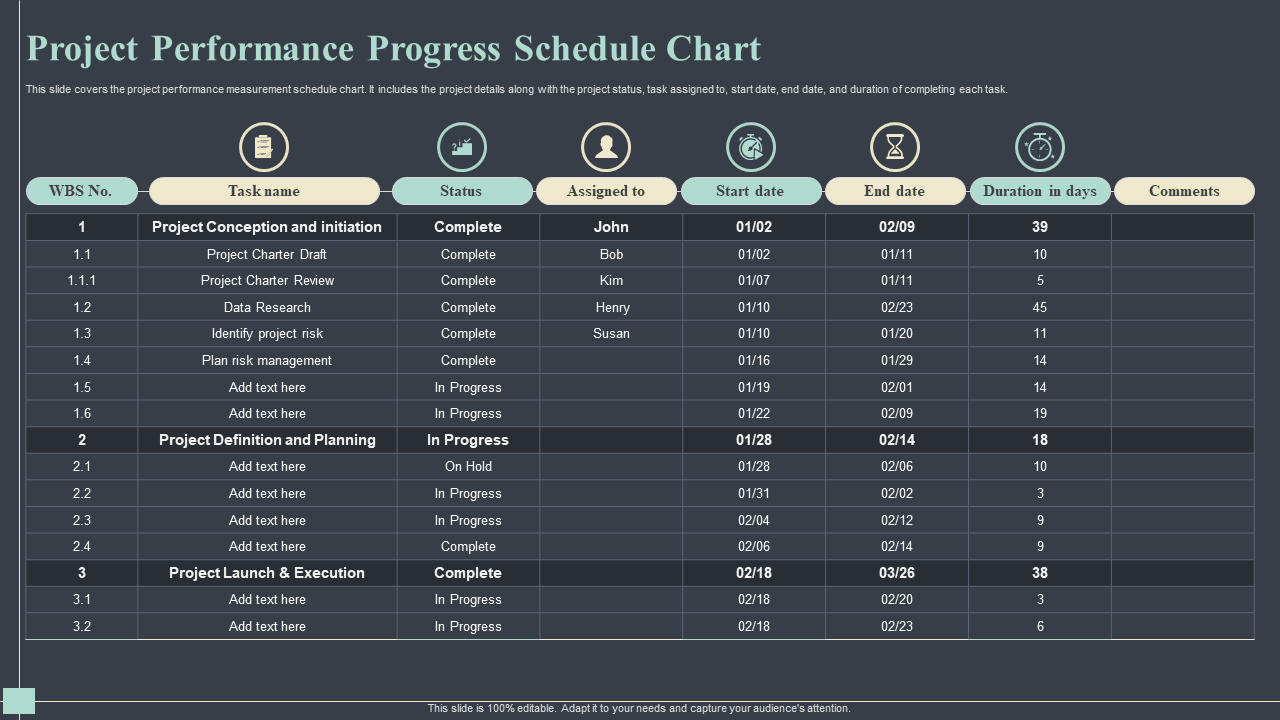
Template 7: Project Performance Progress Schedule Chart
Introducing the project performance progress schedule chart, which displays project details, project status, assigned tasks, start and end dates, and tasks completion duration. Also, study each of the major stages of the project into its sub-stages like data research, project charter draft in project planning etc., to really illustrate your hands-on knowledge of the craft of scheduling.
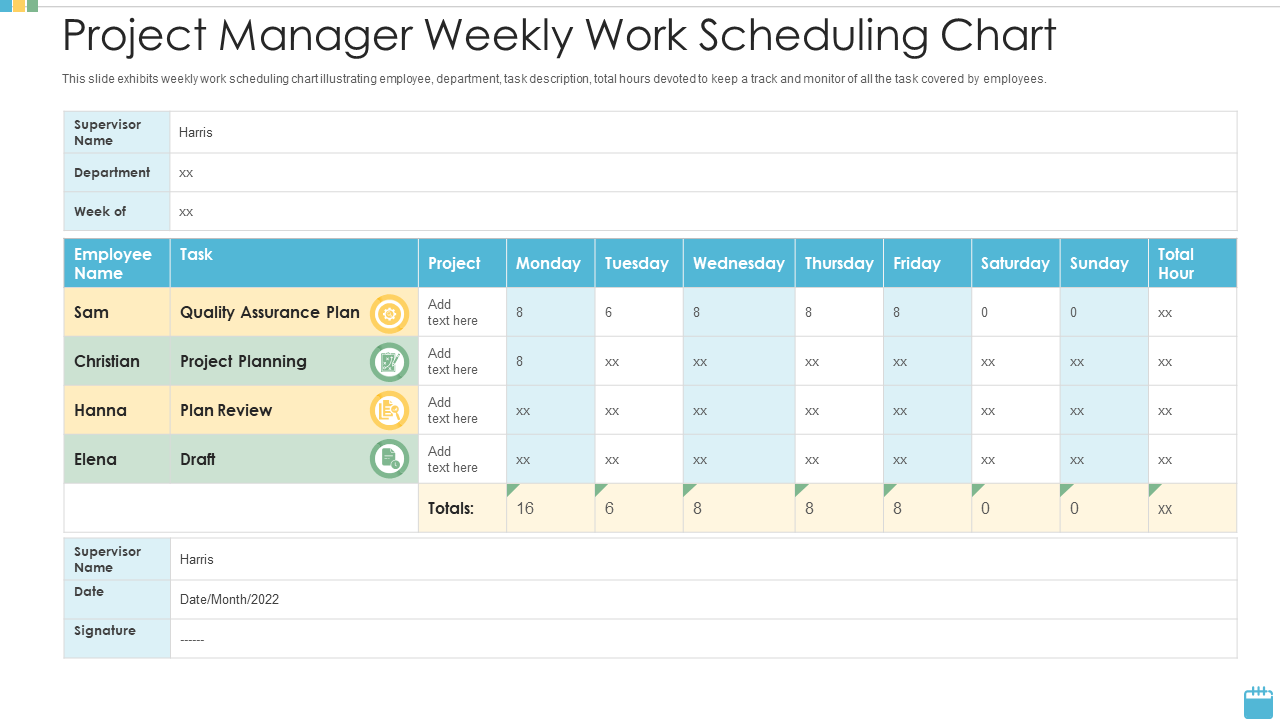
Template 8: Project Manager's Weekly Work Scheduling Chart
Our project manager's weekly work scheduling chart is designed to provide an appealing backdrop to any subject. Here is our well-organised project manager's weekly work scheduling chart. This slide covers the following topics: quality assurance plan, project planning, and plan review.
BREAK IT DOWN, MANAGE WELL
A Schedule Gantt chart is a powerful tool to visualize your project timeline, track the progress of your tasks, and allocate resources efficiently. It enables you to divide large projects into manageable tasks and track their dependencies helping you to meet your project objectives within a given timeframe and under budget. It can also help you to communicate your project plan with your team, stakeholders, and clients using a Schedule Gantt chart, allowing you to succeed in all your projects.
FAQs on Project Schedule Chart
What is a project schedule chart?
A project schedule chart is a graphical presentation that shows task or activities that must be accomplished for the execution of the project, their estimated length, and the order in which they need to be completed. It visually presents the project timeline, highlighting significant checkpoints, due dates, and task dependencies. Project schedule charts are frequently used in project management to keep teams organized, spot potential delays or obstacles, and monitor progress. Depending on the project's complexity and the group's requirement, these might be a Gantt chart, Pert chart, or critical path diagram.
How do you create a project schedule chart?
To create a project schedule chart, you can plan and track project activity more successfully by following a few steps. An instruction manual for making a project schedule chart is:
- Describe the project's actions: - Make a list of steps needed to finish the project. Divide activities into small tasks and give each start and finish date.
- Specify the project's checkpoint: - Determine the significant turning point that marks the end of the project's main stage or phases.
- Identify the dependencies for the project: - Determine the tasks that must be finished before others can begin. It will enable you to plan your activities appropriately.
- Determine the length: - Determine the size of each work based on the resources and the constraint.
- Create project schedule: - Make a project schedule chart using the data you acquire in the earlier sections. The start and finish dates of each task’s project milestones and task dependencies should be highlighted in these charts, showing project activities.
- Examine and modify schedule: - check the project schedule to ensure it is feasible and attainable. Adapt the program as necessary to account for modifications or unforeseen events.
- Provide the timetable: - To ensure that everyone is informed of the project timeframe and can make plans, accordingly, distribute the project schedule chart to stakeholders.
Identifying project activity, establishing milestones, identifying dependencies, estimating tasks time, developing the project schedule, evaluating and updating the program, and communicating the plan with stakeholders are all steps in constructing a project schedule chart.
What chart is used for scheduling projects?
A Gantt Chart is a popular tool for planning projects. A Gantt Chart is a horizontal bar graph used to show a project's schedule. The graph shows a timeline with a flat bar for each action or activity. The bar indicates when the training begins and stops, and it denotes the activity's duration. Using the Gantt chart, dependencies between actions are demonstrate. The project uses Gantt charts, which are helpful for highlighting essential paths and milestones and monitoring the plan's progress. Gantt charts are a common element of many project management software programs.
What is a schedule chart used for?
A schedule chart, sometimes called a project schedule chart, is employed for long-term planning and tracking of project progress. It serves as a visual depiction of the project schedule, highlighting all of the activities or tasks that must carry out, their interdependencies, and the time frame by which they are to finish.
A schedule chart’s objective is to assist project managers and stakeholders comprehend the project scope, timetable, and task dependencies. It is a crucial tool for scheduling and controlling project resources, ensuring deadlines are fulfilled, and guaranteeing that the project is finished on time and under budget.
Project managers can spot potential issues and hazards in the project schedule, including bottlenecks or delays, by schedule chart., and then take corrective action to keep the project on track. The chart makes it easier to see the project’s important route and pinpoint any tasks for meeting deadlines.
What are the six steps to developing a project schedule?
Processes are involved in creating a project schedule that guarantees the project is planned and carried out. The six steps to creating a project schedule are as follows:
- Defining the project scope: - This includes specifying deliverables, benchmarks, and deadlines, which is the first phase. You will better grasp the project’s workload using this information.
- Divide work: - The next step is to divide work into smaller, easier-to-manage pieces.
- Estimating time and resources Once you have a list of activities, the following step is to calculate how much time and money will be needed to finish each.
- Create a project schedule: - It entails developing a timeline that specifies the sequence in which tasks finish and the anticipated time for each job.
- Adjust and review Once you have created a rough timetable, complete it to ensure its attainable and practical. If required, update the schedule to account for modification or unforeseen circumstances.
- Finalize schedule After it has been examined and modified, finalize it and let project stakeholders know about it.




 Customer Reviews

