Breakeven Point Graph With Operational Leverage
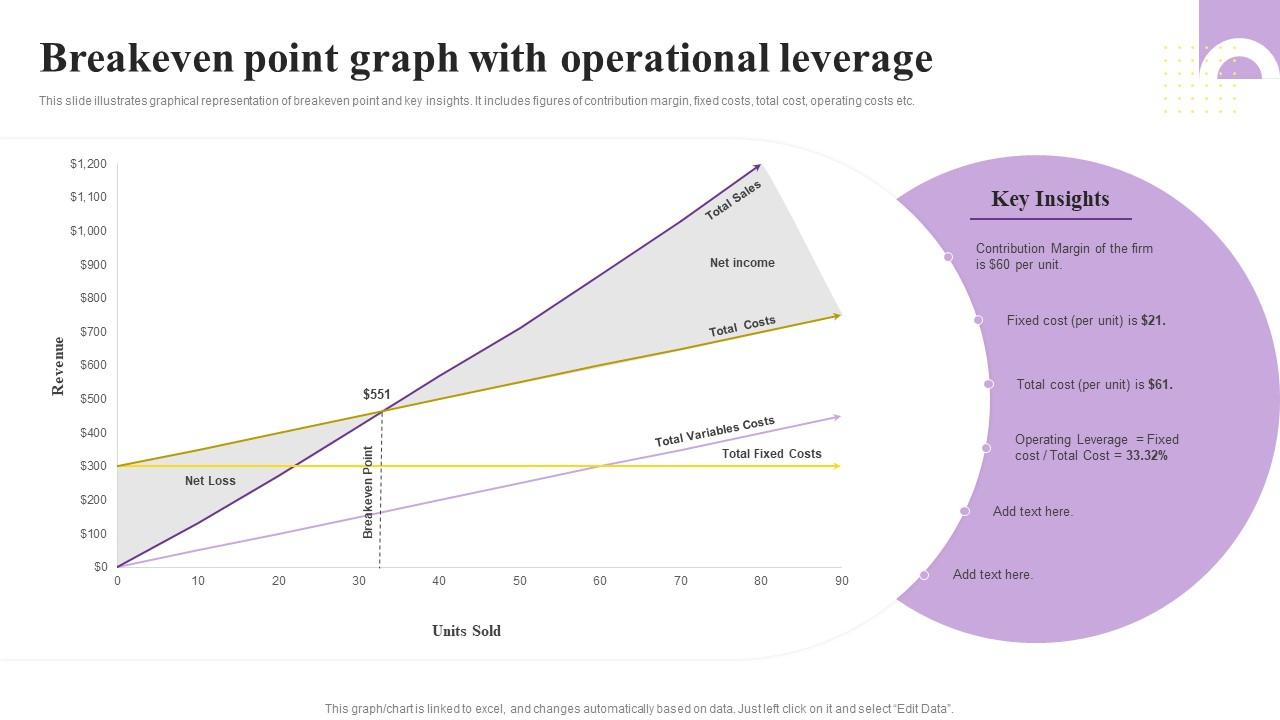
This slide illustrates graphical representation of breakeven point and key insights. It includes figures of contribution margin, fixed costs, total cost, operating costs etc.
This slide illustrates graphical representation of breakeven point and key insights. It includes figures of contribution ma..
- Google Slides is a new FREE Presentation software from Google.
- All our content is 100% compatible with Google Slides.
- Just download our designs, and upload them to Google Slides and they will work automatically.
- Amaze your audience with SlideTeam and Google Slides.
-
Want Changes to This PPT Slide? Check out our Presentation Design Services
- WideScreen Aspect ratio is becoming a very popular format. When you download this product, the downloaded ZIP will contain this product in both standard and widescreen format.
-

- Some older products that we have may only be in standard format, but they can easily be converted to widescreen.
- To do this, please open the SlideTeam product in Powerpoint, and go to
- Design ( On the top bar) -> Page Setup -> and select "On-screen Show (16:9)” in the drop down for "Slides Sized for".
- The slide or theme will change to widescreen, and all graphics will adjust automatically. You can similarly convert our content to any other desired screen aspect ratio.
Compatible With Google Slides

Get This In WideScreen
You must be logged in to download this presentation.
PowerPoint presentation slides
This slide illustrates graphical representation of breakeven point and key insights. It includes figures of contribution margin, fixed costs, total cost, operating costs etc. Introducing our Breakeven Point Graph With Operational Leverage set of slides. The topics discussed in these slides are Contribution Margin, Fixed Cost, Total Cost, Operating Leverage. This is an immediately available PowerPoint presentation that can be conveniently customized. Download it and convince your audience.
People who downloaded this PowerPoint presentation also viewed the following :
Breakeven Point Graph With Operational Leverage with all 7 slides:
Use our Breakeven Point Graph With Operational Leverage to effectively help you save your valuable time. They are readymade to fit into any presentation structure.
-
The PPTs are extremely simple to modify. Thank you for providing the slides that are ready to be used. They assist me in saving a lot of time.
-
They saved me a lot of time because they had exactly what I was looking for. Couldn’t be happier!


