All Excel Linked Bar Chart Graph Powerpoint Diagram Slide
-
 56567305 style concepts 1 growth 7 piece powerpoint presentation diagram infographic slide
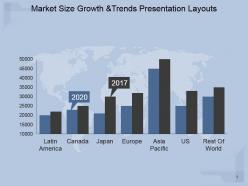
Presenting market size growth and trends presentation layouts. This is a market size growth and trends presentation layouts. This is a seven stage process. The stages in this process are latin america, canada, japan, europe, asia pacific, us, rest of world.
-
 78469958 style concepts 1 growth 7 piece powerpoint presentation diagram infographic slide
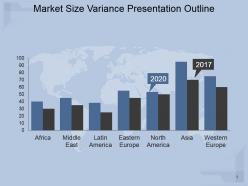
Presenting market size variance presentation outline. This is a market size variance presentation outline. This is a seven stage process. The stages in this process are africa, middle east, latin america, eastern europe, north america, asia, western europe.
-
 98704348 style division pie 2 piece powerpoint presentation diagram infographic slide
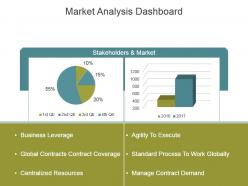
Presenting market analysis dashboard powerpoint slide designs. This is a market analysis dashboard powerpoint slide designs. This is a two stage process. The stages in this process are stakeholders and market, business leverage, global contracts contract coverage, centralized resources, agility to execute, standard process to work globally, manage contract demand.
-
 61984689 style essentials 2 financials 5 piece powerpoint presentation diagram infographic slide
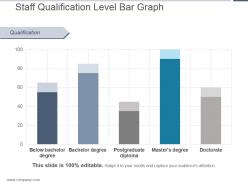
Presenting staff qualification level bar graph presentation powerpoint. This is a staff qualification level bar graph presentation powerpoint. This is a five stage process. The stages in this process are qualification, below bachelor degree, post graduate diploma, bachelor degree, masters degree, doctorate.
-
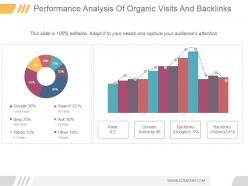 68433724 style division donut 2 piece powerpoint presentation diagram infographic slide
Presenting performance analysis of organic visits and backlinks powerpoint guide. This is a performance analysis of organic visits and backlinks powerpoint guide. This is a two stage process. The stages in this process are rank, domain authority, backlinks google, backlinks yahoo, google, bing, yahoo, search, ask, other.
-
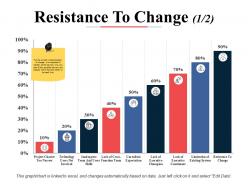 50534518 style essentials 2 financials 9 piece powerpoint presentation diagram infographic slide
This is a nine stages process. The stages in this process are Finance, Marketing, Management, Investment, Analysis.
-
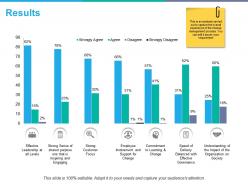 75114268 style essentials 2 financials 7 piece powerpoint presentation diagram infographic slide
This is a seven stages process. The stages in this process are Finance, Marketing, Management, Investment, Analysis.
-
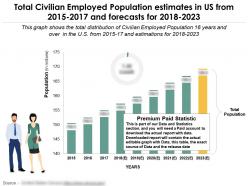 Total civilian employed population estimates in us from 2015-2017 and forecasts for 2018-2023
Total Civilian Employed Population estimates in US from 2015 to 2017 and forecasts for 2018 to 2023. This is part of our Data and Statistics products selection, and you will need a Paid account to download the actual report with accurate data. Downloaded report will contain the actual editable graph with the actual data, an excel table with the actual data, the exact source of the data and the release date. This graph shows the total distribution of Civilian Employed Population 16 years and over in the U.S. from 2015 to 17 and estimations for 2018 to 2023. It covers topic Civilian Employed Population by Age for region USA and is for date range 2015 to 23. Download it immediately and use it for your business.
-
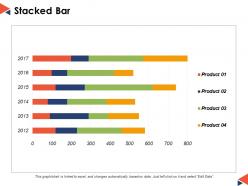 82767250 style essentials 2 financials 4 piece powerpoint presentation diagram infographic slide
This is a four stages process. The stages in this process are Finance, Marketing, Management, Investment, Analysis.
-
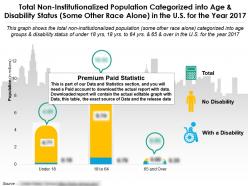 Total non institutionalized population of some other race alone by disability and age group in us for 2017
Presenting this set of slides with name - Total Non Institutionalized Population Of Some Other Race Alone By Disability And Age Group In Us For 2017. Total Non Institutionalized Population categorized into Age and Disability Status Some Other Race Alone in the U.S. for the year 2017. This is part of our Data and Statistics products selection, and you will need a Paid account to download the actual report with accurate data. Downloaded report will contain the actual editable graph with the actual data, an excel table with the actual data, the exact source of the data and the release date. This graph shows the Total Non Institutionalized Population Some Other Race Alone categorized into Age Groups and Disability Status of Under 18 Yrs, 18Yrs to 64 yrs and 65 and Over in the U.S. for the year 2017. It covers topic Disability Status for Non Institutionalized Population Some Other Race Alone by Age Groups for region USA and is for date range 2017. Download it immediately and use it for your business.
-
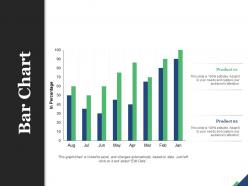 23036860 style essentials 2 financials 2 piece powerpoint presentation diagram infographic slide
Presenting this set of slides with name - Bar Chart Finance Marketing Management Investment Analysis. This is a two stage process. The stages in this process are Finance, Marketing, Management, Investment, Analysis.
-
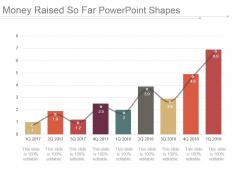 24314316 style concepts 1 growth 9 piece powerpoint presentation diagram infographic slide
Presenting money raised so far powerpoint shapes. This is a money raised so far powerpoint shapes. This is a nine stage process. The stages in this process are business, marketing, growth, rising, management.
-
 41836520 style layered vertical 8 piece powerpoint presentation diagram infographic slide
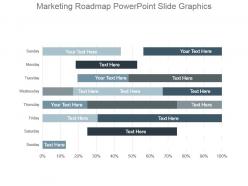
Presenting marketing roadmap powerpoint slide graphics. This is a marketing roadmap powerpoint slide graphics. This is a eight stage process. The stages in this process are sunday, monday, tuesday, wednesday, thursday, friday, saturday.
-
 80617227 style concepts 1 growth 8 piece powerpoint presentation diagram infographic slide
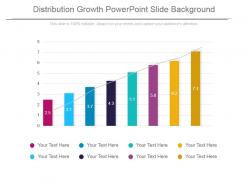
Presenting distribution growth powerpoint slide background. This is a distribution growth powerpoint slide background. This is a eight stage process. The stages in this process are growth, business, marketing, analysis, strategy, success, management.
-
 76187774 style essentials 2 financials 4 piece powerpoint presentation diagram infographic slide
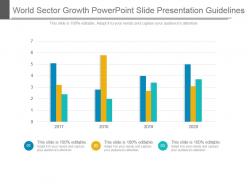
Presenting world sector growth powerpoint slide presentation guidelines. This is a world sector growth powerpoint slide presentation guidelines. This is a four stage process. The stages in this process are business, process, growth, success, marketing, strategy.
-
 9315762 style essentials 2 financials 2 piece powerpoint presentation diagram template slide
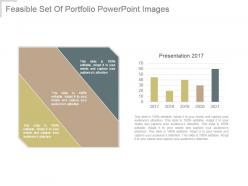
Presenting feasible set of portfolio powerpoint images. This is a feasible set of portfolio powerpoint images. This is a two stage process. The stages in this process are years, planning, business, finance, marketing.
-
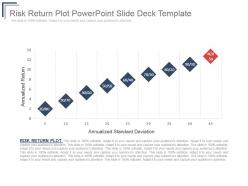 47436647 style concepts 1 growth 9 piece powerpoint presentation diagram infographic slide
Presenting risk return plot powerpoint slide deck template. This is a risk return plot powerpoint slide deck template. This is a nine stage process. The stages in this process are annualized return, annualized standard deviation.
-
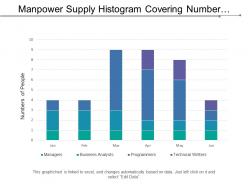 1144459 style essentials 2 financials 6 piece powerpoint presentation diagram infographic slide
Presenting this set of slides with name - Manpower Supply Histogram Covering Number Of Recruitment At Different Positions In Percent. This is a six stage process. The stages in this process are Manpower Supply, Manpower Service, Manpower Recruitment.
-
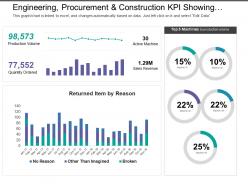 45297808 style essentials 2 financials 4 piece powerpoint presentation diagram infographic slide
Presenting this set of slides with name - Engineering Procurement And Construction Kpi Showing Production Volume And Quantity Ordered. This is a four stage process. The stages in this process are Engineering, Procurement And Construction, Construction Management, Engineering, Purchasing And Construction .
-
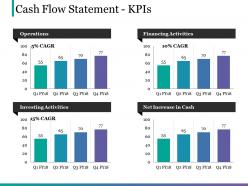 16094070 style essentials 2 financials 4 piece powerpoint presentation diagram infographic slide
Presenting this set of slides with name - Cash Flow Statement Kpis Ppt Slides. This is a four stage process. The stages in this process are Business, Operations, Financing Activities, Net Increase In Cash, Investing Activities.
-
 42932588 style concepts 1 growth 2 piece powerpoint presentation diagram infographic slide
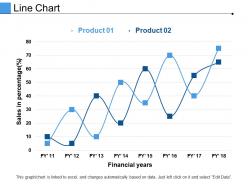
Presenting this set of slides with name - Line Chart Presentation Ideas. This is a two stage process. The stages in this process are Finance, Marketing, Bar, Planning, Growth.
-
 12986757 style essentials 2 financials 2 piece powerpoint presentation diagram infographic slide
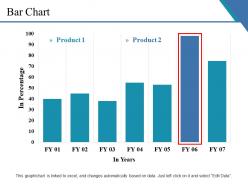
Presenting this set of slides with name - Bar Chart Ppt Examples. This is a two stage process. The stages in this process are Business, Marketing, In Percentage, In Years, Finance.
-
 28890850 style essentials 2 financials 3 piece powerpoint presentation diagram infographic slide
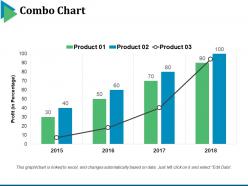
Presenting this set of slides with name - Combo Chart Ppt Samples. This is a three stage process. The stages in this process are Profit, Years, Business, Marketing, Finance, Graph.
-
 64460087 style concepts 1 growth 2 piece powerpoint presentation diagram template slide
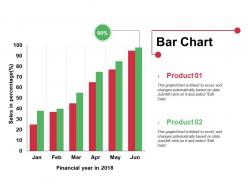
Presenting this set of slides with name - Bar Chart Ppt Visual Aids Infographics. This is a two stage process. The stages in this process are Product, Financial Years In, Sales In Percentage.
-
 46735026 style essentials 2 financials 3 piece powerpoint presentation diagram infographic slide
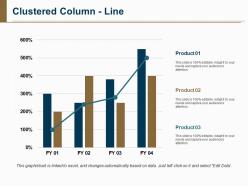
Presenting a PowerPoint slide with name Clustered column line PowerPoint layout. Individualize the presentation and give it the look as you want. Quality content can be added anywhere in the PPT slide. Easily change colors, text, fonts and backgrounds. The release plan roadmap template is convertible in PDF or JPG formats. Customize the shape, size or color in the slide. It’s compatibility with Google slides make it available anywhere .You can easily add or remove the icons in the slide to make it more impactful. Link the graph with excel sheet to make the desired changes. Download this PPT layout and save your time.
-
 10986754 style division donut 4 piece powerpoint presentation diagram infographic slide
Presenting this set of slides with name - Our Market Share Ppt Professional Objects. This is a four stage process. The stages in this process are Donut Chart, Marketing, Strategy, Planning, Finance.
-
 46808919 style essentials 2 financials 3 piece powerpoint presentation diagram infographic slide
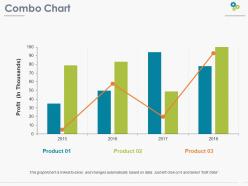
Presenting this set of slides with name - Combo Chart Ppt Pictures Diagrams. This is a three stage process. The stages in this process are Profit, Chart, Years, Business, Marketing.
-
 10971349 style division pie 5 piece powerpoint presentation diagram infographic slide
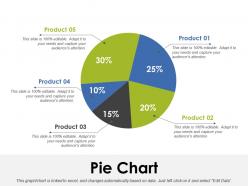
Presenting pie chart PPT inspiration slide portrait PPT slide. The graphical pie chart PowerPoint slide designed professionally by the team of SlideTeam for making a comprehensive PPT of big data. The pie chart graphic template is the data driven template and the user can edit the percentage as the slide gets linked with the Excel spreadsheet. The graphical pie chart slide is customizable in PowerPoint along with that it is compatible with Google Slide so a user can share it with others on the internet. You can make changes in the visual pie chart template such as font size, font type, color and dimensions of icons to make the concepts easier for the audience.
-
 18912881 style essentials 2 financials 3 piece powerpoint presentation diagram infographic slide
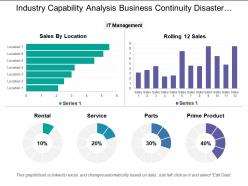
Presenting this set of slides with name - Industry Capability Analysis Business Continuity Disaster Recovery Costs. This is a stage process. The stages in this process are Industry Capability Analysis, Industry Potential Analysis, Industry Competency Analysis.
-
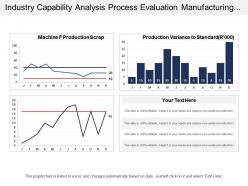 635301 style essentials 2 financials 3 piece powerpoint presentation diagram infographic slide
The best feature of this slide is that it’s 100% editable; you can modify and customize the design the way you want, all the design elements are editable. Also, the slide is linked with excel, just put your business figures on excel and it will automatically get changed on PPT design charts. The design is 100% downloadable; you can download it as JPEG or PDF formats in a single click. Design can be opened with Google Slides and MS PowerPoint software.
-
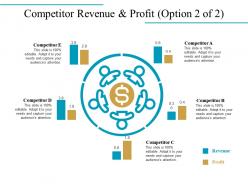 76728770 style essentials 2 financials 5 piece powerpoint presentation diagram infographic slide
Presenting this set of slides with name - Competitor Revenue And Profit Powerpoint Slide Designs. This is a five stage process. The stages in this process are Revenue, Profit, Business, Marketing, Strategy, Finance.
-
 69687115 style essentials 2 financials 6 piece powerpoint presentation diagram infographic slide
Presenting this set of slides with name - Loyalty Program Performance Dashboard Powerpoint Slide Inspiration. This is a six stage process. The stages in this process are Average Sale By Loyalty Member Type, Average Sale By Loyalty Segment, Sales By Channel, All Orders By Promotions, Average Award By Customer.
-
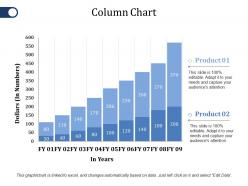 15662845 style concepts 1 growth 2 piece powerpoint presentation diagram infographic slide
Presenting this set of slides with name - Column Chart Ppt File Styles. This is a two stage process. The stages in this process are Product, Dollars, In Years, Growth, Success.
-
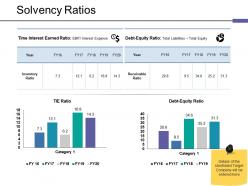 56280625 style essentials 2 financials 2 piece powerpoint presentation diagram infographic slide
Presenting this set of slides with name - Solvency Ratios Ppt Influencers. This is a two stage process. The stages in this process are Solvency Ratios, Finance, Business, Analysis, Management.
-
 28641127 style essentials 2 financials 5 piece powerpoint presentation diagram infographic slide
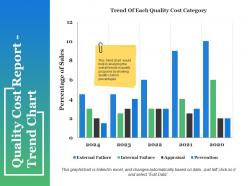
Presenting this set of slides with name - Quality Cost Report Trend Chart Ppt Sample. This is a five stage process. The stages in this process are Business, Marketing, Strategy, Planning, Bar.
-
 51485054 style concepts 1 growth 5 piece powerpoint presentation diagram infographic slide
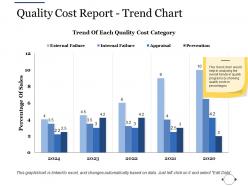
Presenting this set of slides with name - Quality Cost Report Trend Chart Ppt File Guidelines. This is a five stage process. The stages in this process are Percentage Of Sales, Appraisal, Prevention, External Failure, Internal Failure.
-
 67597230 style concepts 1 growth 2 piece powerpoint presentation diagram infographic slide
Presenting this set of slides with name - Stacked Column Ppt Slide. This is a two stage process. The stages in this process are Business, Marketing, Graph, Strategy, Growth.
-
 43885472 style essentials 2 financials 4 piece powerpoint presentation diagram infographic slide
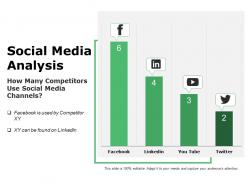
Presenting this set of slides with name - Social Media Analysis Presentation Layouts. This is a four stage process. The stages in this process are Business, Finance, Marketing, Strategy, Analysis, Social, Media.
-
 51398278 style essentials 2 financials 4 piece powerpoint presentation diagram infographic slide
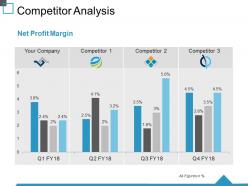
Presenting this set of slides with name - Competitor Analysis Ppt Summary Outfit. This is a four stage process. The stages in this process are Analysis, Business, Marketing, Finance, Net Profit Margin.
-
 28557336 style essentials 2 financials 4 piece powerpoint presentation diagram infographic slide
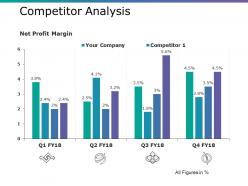
Presenting this set of slides with name - Competitor Analysis Ppt Summary Ideas. This is a four stage process. The stages in this process are Net Profit Margin, Your Company, Competitor.
-
 77165047 style essentials 2 financials 4 piece powerpoint presentation diagram infographic slide
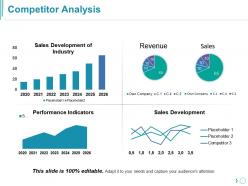
Presenting this set of slides with name - Competitor Analysis Presentation Images. This is a four stage process. The stages in this process are Competitor Analysis, Finance, Compare, Strategy, Analysis, Business.
-
 78232075 style essentials 2 financials 2 piece powerpoint presentation diagram template slide
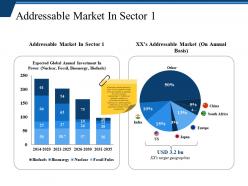
Presenting this set of slides with name - Addressable Market In Sector Ppt Examples Professional. This is a two stage process. The stages in this process are Business, Finance, Marketing, Analysis, Strategy.
-
 76597210 style essentials 2 financials 3 piece powerpoint presentation diagram infographic slide
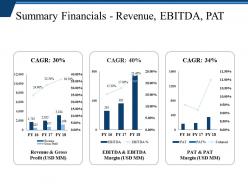
Presenting this set of slides with name - Summary Financials Revenue Ebitda Pat Presentation Powerpoint Templates. This is a three stage process. The stages in this process are Finance, Marketing, Analysis, Business, Growth.
-
 3519146 style essentials 2 financials 7 piece powerpoint presentation diagram template slide
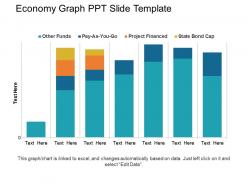
Presenting economy graph PPT slide template. Modify able wordings, pigmentation PowerPoint design, and plans. The PPT diagram maintains the immense accuracy even after the required customization. Consonant with Google Slides and also runs with other software system. A simple downloading process which spares time. Can be easily accessible into different file formats such as PDF or JPG. The image quality remains unaffected when anticipated on the wide screen.
-
 76870825 style essentials 2 financials 3 piece powerpoint presentation diagram template slide
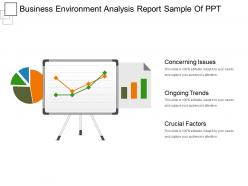
Presenting Business Environment Analysis Report Sample Of PPT. New content such as charts and graphs can be added to the presentation. This PowerPoint template supports both widescreen (16:9) and standard screen aspect ratio(4:3) which is an added advantage. The slide is even compatible with Google Slides. This slide can be saved into image formats such as JPEG, PNG or document formats such as PDF.
-
 7474588 style concepts 1 growth 4 piece powerpoint presentation diagram template slide
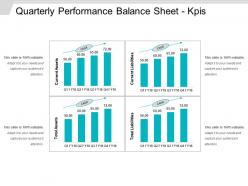
Presenting Quarterly Performance Balance Sheet KPI’s Presentation slide. This is a technically developed Presentation design. The PPT design is professionally defined with the high quality resolutions. The PPT slide is also very easy to download. Offers modifiable graphs, outlines, plans, designs, sizes, hues, and PowerPoint image and more. It is also well consistent with all Google Slides and other working applications. The PPT structure can be altered into various document designs, for example, PDF or JPG.
-
 35133867 style concepts 1 growth 3 piece powerpoint presentation diagram infographic slide
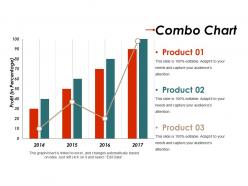
Presenting combo chart good ppt example. This is a combo chart good ppt example. This is a three stage process. The stages in this process are product, profit, business, bar graph, success.
-
 64212525 style essentials 2 financials 2 piece powerpoint presentation diagram infographic slide
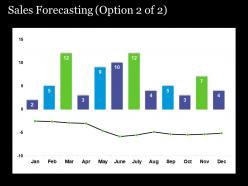
Presenting sales forecasting powerpoint slide templates. This is a sales forecasting powerpoint slide templates. This is a two stage process. The stages in this process are bar, business, success, marketing, graph.
-
 89387895 style concepts 1 growth 9 piece powerpoint presentation diagram infographic slide
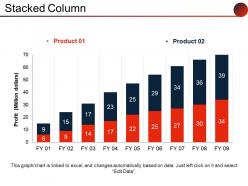
Presenting stacked column powerpoint slide ideas. This is a stacked column powerpoint slide ideas. This is a nine stage process. The stages in this process are profit, product, graph, growth, business.
-
 1606144 style concepts 1 growth 2 piece powerpoint presentation diagram infographic slide
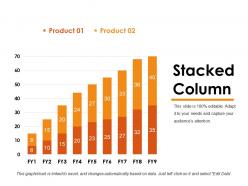
Presenting stacked column powerpoint templates microsoft. This is a stacked column powerpoint templates microsoft. This is a two stage process. The stages in this process are business, marketing, growth, strategy, graph.
-
 97114194 style essentials 2 financials 4 piece powerpoint presentation diagram infographic slide
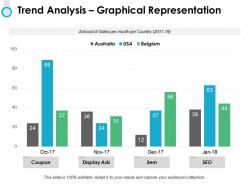
Presenting this set of slides with name - Trend Analysis Graphical Representation Ppt Powerpoint Presentation Gallery Design Ideas. This is a four stage process. The stages in this process are Percentage, Product, Business, Management, Marketing.
-
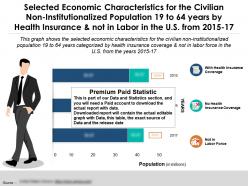 Economic characteristics population 19 to 64 years by health insurance not labor in us 2015-17
Presenting this set of slides with name - Economic Characteristics Population 19 To 64 Years By Health Insurance Not Labor In US 2015-17. Selected Economic Characteristics For The Civilian Noninstitutionalized Population 19 To 64 Years By Health Insurance And Not In Labor In The U.S From 2015 TO 17. This is part of our Data and Statistics products selection, and you will need a Paid account to download the actual report with accurate data. Downloaded report will contain the actual editable graph with the actual data, an excel table with the actual data, the exact source of the data and the release date. This graph shows the selected economic characteristics for the civilian noninstitutionalized population 19 to 64 years categorized by health insurance coverage and not in labor force in the U.S from the years 2015 TO 17. It covers topic Selected economic characteristics for population by health insurance and not in labor force for region USA and is for date range 2015 TO 17. Download it immediately and use it for your business.
-
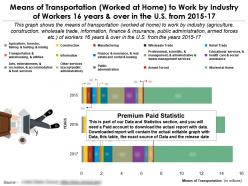 Means of transportation worked at home to work by industry of workers 16 years in us 2015-17
Presenting this set of slides with name - Means Of Transportation Worked At Home To Work By Industry Of Workers 16 Years In US 2015-17. Means Of Transportation Worked At Home To Work By Industry Of Workers 16 Years And Over In The U.S From 2015 to 17. This is part of our Data and Statistics products selection, and you will need a Paid account to download the actual report with accurate data. Downloaded report will contain the actual editable graph with the actual data, an excel table with the actual data, the exact source of the data and the release date. This graph shows the means of transportation worked at home to work by industry agriculture, construction, wholesale trade, information, finance and insurance, public administration, armed forces etc. of workers 16 years and over in the U.S from the years 2015 to 17. It covers topic Means of transportation by working from home for region USA and is for date range 2015 to 17. Download it immediately and use it for your business.
-
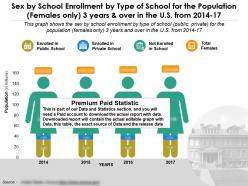 Sex by school enrollment by type of school population females only 3 years in us 2014-17
Presenting this set of slides with name - Sex By School Enrollment By Type Of School Population Females Only 3 Years In US 2014-17. Sex By School Enrollment By Type Of School For The Population Females Only 3 Years And Over In The U.S From 2014 TO 17. This is part of our Data and Statistics products selection, and you will need a Paid account to download the actual report with accurate data. Downloaded report will contain the actual editable graph with the actual data, an excel table with the actual data, the exact source of the data and the release date. This graph shows the sex by school enrollment by type of school public, private for the population females only 3 years and over in the U.S from 2014 TO 17. It covers topic School Enrollment for the population 3 years and over for females for region USA and is for date range 2014 TO 17. Download it immediately and use it for your business.
-
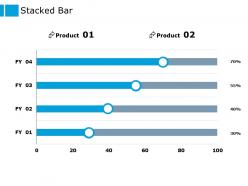 60154734 style essentials 2 financials 2 piece powerpoint presentation diagram infographic slide
Presenting this set of slides with name - Stacked Bar Finance Ppt Powerpoint Presentation Pictures Background Image. This is a two stages process are. The stages in this process are Stacked Bar, Marketing, Management, Investment, Analysis.
-
 6780403 style essentials 2 financials 4 piece powerpoint presentation diagram infographic slide
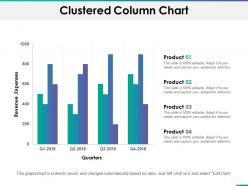
Presenting this set of slides with name - Clustered Column Chart Ppt Summary Design Templates. This is a four stage process. The stages in this process are Business, Management, Strategy, Analysis, Marketing.
-
 16588381 style essentials 2 financials 2 piece powerpoint presentation diagram infographic slide
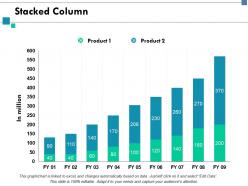
Presenting this set of slides with name - Stacked Column Finance Ppt Slides Graphics Tutorials. This is a two stage process. The stages in this process are Stacked Column, Finance, Marketing, Analysis, Investment.
-
 70063231 style essentials 2 financials 4 piece powerpoint presentation diagram infographic slide
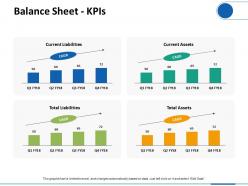
Presenting this set of slides with name - Balance Sheet KPIs Ppt Visual Aids Infographic Template. This is a four stage process. The stages in this process are Finance, Analysis, Business, Investment, Marketing.
-
 67720204 style essentials 2 financials 5 piece powerpoint presentation diagram infographic slide
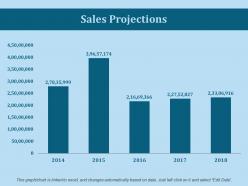
Presenting this set of slides with name - Sales Projections Ppt Slides Template. This is a five stage process. The stages in this process are Business, Management, Strategy, Analysis, Marketing.
-
 75319334 style essentials 2 financials 3 piece powerpoint presentation diagram infographic slide
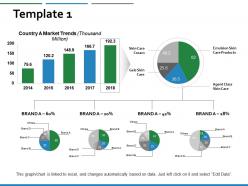
Presenting this set of slides with name - Market Business Management Ppt Powerpoint Presentation Inspiration Portfolio. This is a three stages process. The stages in this process are Bar Graph, Finance, Marketing, Business, Analysis.


