All Excel Linked Donut Chart Graph Powerpoint Diagram Slide
-
 59630190 style division donut 3 piece powerpoint presentation diagram infographic slide
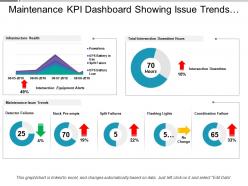
Presenting this set of slides with name - Maintenance Kpi Dashboard Showing Issue Trends And Infrastructure Health. This is a three stage process. The stages in this process are Maintenance, Preservation, Conservation.
-
 58317857 style division donut 4 piece powerpoint presentation diagram infographic slide
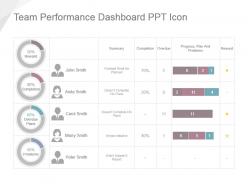
Presenting team performance dashboard ppt icon. This is a team performance dashboard snapshot ppt icon. This is a four stage. The Stages in this process are john smith, anita smith, carol smith, marry smith, peter smith, reward, completion, overdue plans, problems, summary, finished what he planned, doesn?t complete his plans, doesnt complete his plans, shows initiative, didnt submit a report, completion, overdue, progress, plan and problems, reward.
-
 46497456 style division donut 2 piece powerpoint presentation diagram infographic slide
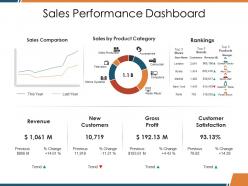
Presenting this set of slides with name - Sales Performance Dashboard Snapshot Ppt Deck. This is a two stage process. The stages in this process are Revenue, New Customers, Gross, Profit, Customer Satisfaction, Sales Comparison.
-
 33914793 style essentials 2 financials 4 piece powerpoint presentation diagram infographic slide
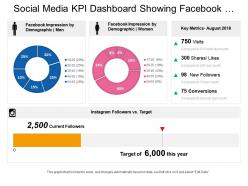
Presenting this set of slides with name - Social Media Kpi Dashboard Showing Facebook Impression By Demographic Instagram Key Metrics. This is a four stage process. The stages in this process are Social Media, Digital Marketing, Social Marketing.
-
 19714613 style essentials 2 financials 6 piece powerpoint presentation diagram infographic slide
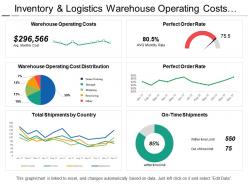
Presenting inventory and logistics warehouse operating costs dashboard PPT slideshow. Editable charts, visuals, colors and text. Presentable and easy to comprehend info graphic format. The presentation template can be downloaded and saved in any desired format. Privilege of insertion of logo and trademarks for more personalization. Adaptable to wide screen view without the problem of pixilation. Can be used with Google slides. Easy to edit and customize as per your needs. Beneficial for industry professionals, managers, executives, researchers, sales people, etc.
-
 64816763 style essentials 2 financials 2 piece powerpoint presentation diagram infographic slide
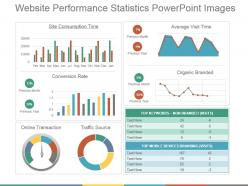
We present to you our website performance statistics PowerPoint images. You can change the placement, the size or the color of the graphical images used in the template. You can make numerous changes by following the instructions given in sample slides, as this PPT is fully editable. This template can be saved in either PDF or JPG format. You can view the presentation in widescreen display ratio of 16:9 or standard size display ratio of 4:3. So download, edit and present it.
-
 60356460 style essentials 2 financials 6 piece powerpoint presentation diagram infographic slide
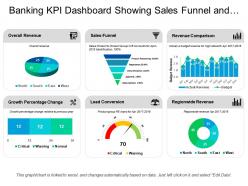
Presenting this set of slides with name - Banking Kpi Dashboard Showing Sales Funnel And Overall Revenue. This is a six stage process. The stages in this process are Banking, Finance, Money.
-
 53868423 style essentials 2 financials 3 piece powerpoint presentation diagram infographic slide
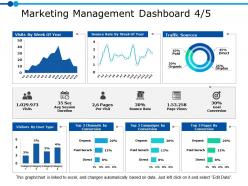
Presenting this set of slides with name - Marketing Management Dashboard 4 5 Ppt Powerpoint Presentation Gallery Example. This is a three stage process. The stages in this process are Business, Management, Strategy, Analysis, Marketing.
-
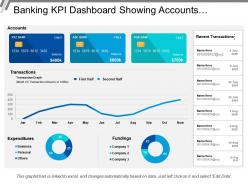 89540797 style essentials 2 financials 3 piece powerpoint presentation diagram infographic slide
Presenting this set of slides with name - Banking Kpi Dashboard Showing Accounts Expenditures Fundings. This is a three stage process. The stages in this process are Banking, Finance, Money.
-
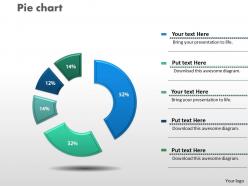 0414 pie chart data driven layout powerpoint graph
Flawless presentation of ideas. High resolution visual ensures zero pixilation at any size output. Splendid mix of color, design, format and fonts. Ease of download. Ease of saving it in any desired format. Compatible with numerous online and offline software options. Thoroughly editable slide design background. Ease of inclusion and exclusion of data. Ease of personalization with company specific name, logo and trademark. Used by marketing professionals, sales people, students and teachers.
-
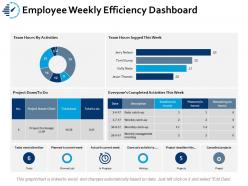 3616780 style essentials 2 financials 2 piece powerpoint presentation diagram infographic slide
Presenting this set of slides with name - Employee Weekly Efficiency Dashboard Snapshot Ppt Portfolio Brochure. This is a two stage process. The stages in this process are Business, Management, Strategy, Sales, Marketing.
-
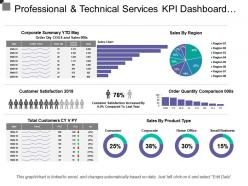 71135471 style essentials 2 financials 3 piece powerpoint presentation diagram infographic slide
Presenting this set of slides with name - Professional And Technical Services Kpi Dashboard Showing Sales By Region. This is a three stage process. The stages in this process are Professional And Technical Services, Services Management, Technical Management.
-
 20077957 style essentials 2 financials 3 piece powerpoint presentation diagram infographic slide
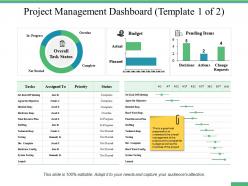
Presenting this set of slides with name - Project Management Dashboard Snapshot Ppt Professional Example Introduction. This is a three stage process. The stages in this process are Percentage, Product, Management, Marketing, Business.
-
 82071137 style essentials 2 financials 4 piece powerpoint presentation diagram infographic slide
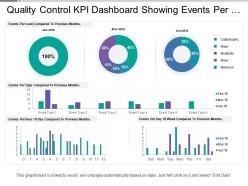
Presenting this set of slides with name - Quality Control Kpi Dashboard Showing Events Per Hour And Day. This is a four stage process. The stages in this process are Quality Management, Quality Control, Quality Assurance.
-
 59274613 style essentials 2 financials 3 piece powerpoint presentation diagram infographic slide
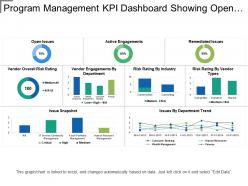
Presenting this set of slides with name - Program Management Kpi Dashboard Showing Open Issues And Risk Rating. This is a three stage process. The stages in this process are Program Development, Human Resource Management, Program Management.
-
 78346647 style division donut 4 piece powerpoint presentation diagram infographic slide
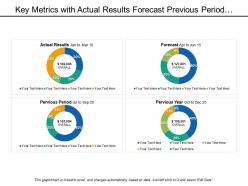
Presenting this set of slides with name - Key Metrics With Actual Results Forecast Previous Period And Year. This is a four stage process. The stages in this process are Key Metrics, Key Performance Indicator, Kpi.
-
 27854810 style division donut 4 piece powerpoint presentation diagram infographic slide
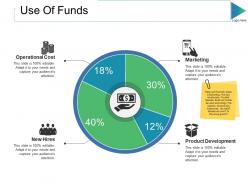
Presenting this set of slides with name - Use Of Funds Ppt Slides Clipart. This is a four stage process. The stages in this process are Operational Cost, New Hires, Product Development, Marketing, Business.
-
 44987331 style essentials 2 financials 6 piece powerpoint presentation diagram infographic slide
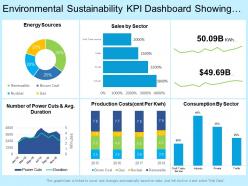
Presenting this set of slides with name - Environmental Sustainability Kpi Dashboard Showing Total Consumption Sales Energy Sources. This is a six stage process. The stages in this process are Environment Sustainability, Environment Continual, Environment Feasibility.
-
 21329409 style essentials 2 financials 4 piece powerpoint presentation diagram infographic slide
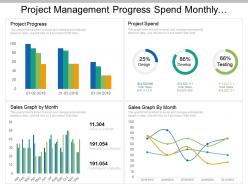
Presentation design is easy download and can be changed into other software programs such as JPEG and PDF. Personalize the PowerPoint template with brand name, logo and image. Presentation slide is available with choice to download with different nodes and stages. Completely editable PPT slide can be edited as colors, icons, and text. Easy to present amongst large set of audience as accessible in widescreen view option. PowerPoint graphic can be merged with Google slides as fully compatible with them.
-
 85649127 style division donut 5 piece powerpoint presentation diagram infographic slide
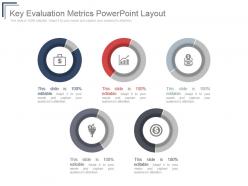
Presenting key evaluation metrics powerpoint layout. This is a key evaluation metrics powerpoint layout. This is a five stage process. The stages in this process are icons, business, marketing, presentation, management.
-
 80236546 style concepts 1 decline 2 piece powerpoint presentation diagram template slide
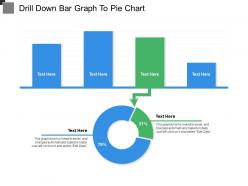
Presenting this set of slides with name - Drill Down Bar Graph To Pie Chart. This is a two stage process. The stages in this process are Drill Down, Hierarchy, Top Downwards.
-
 11402695 style essentials 2 financials 4 piece powerpoint presentation diagram infographic slide
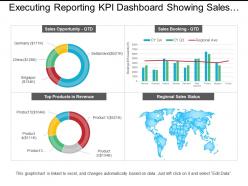
Presenting this set of slides with name - Executing Reporting Kpi Dashboard Showing Sales Opportunity And Sales Booking. This is a four stage process. The stages in this process are Executive Reporting, Executive Analysis, Executive Performance.
-
 10090115 style essentials 2 financials 4 piece powerpoint presentation diagram infographic slide
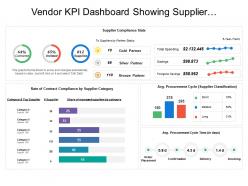
Presenting this set of slides with name - Vendor Kpi Dashboard Showing Supplier Compliance Stats And Procurement Cycle Time. This is a four stage process. The stages in this process are Vendor, Supplier, Retailer.
-
 9772956 style division donut 2 piece powerpoint presentation diagram template slide
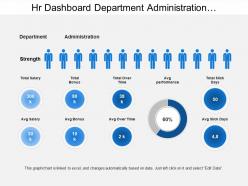
Presenting this set of slides with name - Hr Dashboard Department Administration Workforce Strength. This is a two stage process. The stages in this process are Hr Dashboard, Human Resource Dashboard, Hr Kpi.
-
 28952104 style layered funnel 3 piece powerpoint presentation diagram infographic slide
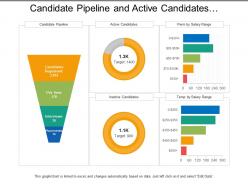
Presenting this set of slides with name - Candidate Pipeline And Active Candidates Recruitment Dashboard. This is a three stage process. The stages in this process are Staffing Plan, Recruitment, Staff Management.
-
 20611160 style essentials 2 financials 3 piece powerpoint presentation diagram infographic slide
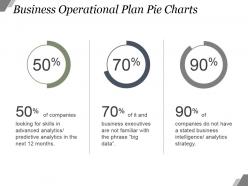
Presenting business operational plan pie charts powerpoint presentation. This is a business operational plan pie charts powerpoint presentation. This is a three stage process. The stages in this process are business, operation, plan, percentage, financial.
-
 38851727 style essentials 2 compare 2 piece powerpoint presentation diagram infographic slide
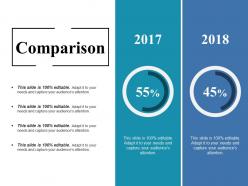
Presenting this set of slides with name - Comparison Ppt Good. This is a two stage process. The stages in this process are Comparison, Years, Percentage, Business, Finance.
-
 21233097 style division donut 4 piece powerpoint presentation diagram template slide
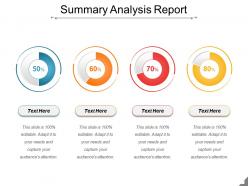
Presenting Summary Analysis Report Presentation PowerPoint Example. It is fully editable in PowerPoint and the slide can be modified as per your requirements. Edit the fonts, colors and slide background. When you download the presentation, you get the PPT files in both widescreen (16:9) and standard screen (4:3) aspect ratio. Our presentation is compatible with Google Slides and can be saved in JPG or PDF format. Get this template with high resolution graphics and deliver presentations in no time.
-
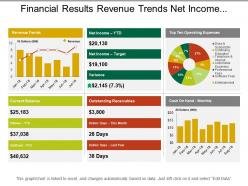 70903479 style essentials 2 financials 6 piece powerpoint presentation diagram infographic slide
Presenting financial results revenue trends net income cash on hand layout. Change PowerPoint structure, font, text, color and design as per your requirements. Easy to input data with excel linked charts, just right to click to input data. This presentation theme is totally attuned with Google slide. Easy conversion to other software’s like JPG and PDF formats. Image quality of these PPT diagram remains the unchanged even when you resize the image or portray on large screens.
-
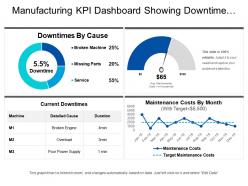 Manufacturing kpi dashboard showing downtime by cause and current downtimes
Presenting this set of slides with name - Manufacturing Kpi Dashboard Showing Downtime By Cause And Current Downtimes. This is a four stage process. The stages in this process are Manufacturing, Production, Manufacture.
-
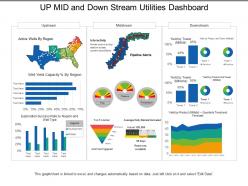 35860831 style essentials 2 financials 3 piece powerpoint presentation diagram infographic slide
Presenting this set of slides with name - Up Mid And Down Stream Utilities Dashboard. This is a three stage process. The stages in this process are Utilities, Use, Advantage.
-
 Bulb with process icons for data driven analysis powerpoint slides
Download in an instant in simple steps. Change orientation and sizes of PPT images to suit your need. High resolution PPT infographics that do not pixelate on wide screen projection. Modify color scheme and contrast as per need. No length constraints on fully modifiable text in titles and subtitles. Runs smoothly with Google slides and easily convertible to PDF or JPG.
-
 58868710 style essentials 2 financials 3 piece powerpoint presentation diagram infographic slide
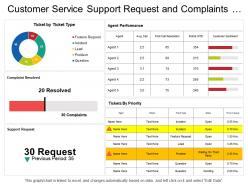
Presenting this set of slides with name - Customer Service Support Request And Complaints Resolved Dashboard. This is a three stage process. The stages in this process are Customer Base, Recurring Customers, Customer Services.
-
 24389755 style essentials 2 financials 5 piece powerpoint presentation diagram infographic slide
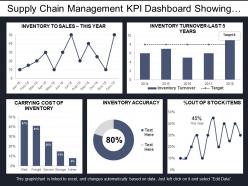
Presenting this set of slides with name - Supply Chain Management Kpi Dashboard Showing Inventory Accuracy And Turnover. This is a five stage process. The stages in this process are Demand Forecasting, Predicting Future Demand, Supply Chain Management.
-
 65676513 style essentials 2 compare 2 piece powerpoint presentation diagram infographic slide
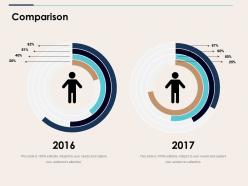
Presenting this set of slides with name - Comparison Ppt Portfolio. This is a two stage process. The stages in this process are Business, Marketing, Compare, Years, Percentage.
-
 3572746 style essentials 2 financials 7 piece powerpoint presentation diagram infographic slide
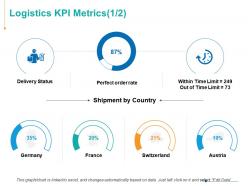
Presenting this set of slides with name - Logistics KPI Metrics Ppt Powerpoint Presentation Model. This is a seven stage process. The stages in this process are Delivery Status, Finance, Analysis, Business, Investment.
-
 2613259 style division donut 4 piece powerpoint presentation diagram infographic slide
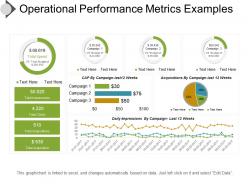
Presenting operational performance metrics PPT image layout. This is competently constructed and readily useable PowerPoint template. Amend able subject matter, PowerPoint image, types, fonts etc. Prompt content with flexible option to insert company logo, trademark, or name. High resolution PPT template. Well served with all Google Slides. Projected on wide screen with high quality PPT graphic. Beneficial for the business managers and other professionals.
-
 41192728 style essentials 2 compare 2 piece powerpoint presentation diagram infographic slide
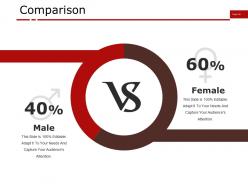
Presenting comparison powerpoint templates microsoft. Presenting comparison powerpoint templates microsoft. This is a comparison powerpoint templates microsoft. This is a two stage process. The stages in this process are male, female, percentage, business, marketing.
-
 Devops kpi dashboard showing build and quality health
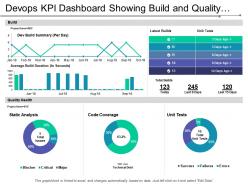
Presenting this set of slides with name - Devops Kpi Dashboard Showing Build And Quality Health. This is a four stage process. The stages in this process are Development And Operations, Devops.
-
 0414 donut chart wheels business design powerpoint graph
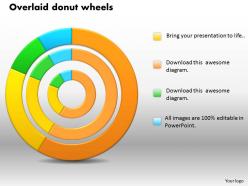
Adjust the PowerPoint slide design by addition of business name. Swift download and easy to alter into JPEG and PDF document. Presentation samples well-attuned with Google slides. Greater quality and visually appealing PPT clip art. Accurate and easy to grasp information. Availability to present design in standard and widescreen display view. Presentation guide can be accessed with different nodes and stages. Perfect for showing teamwork, collaboration, partnership related concepts.
-
 33018115 style essentials 2 financials 4 piece powerpoint presentation diagram infographic slide
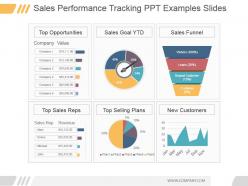
Presenting sales performance tracking ppt examples slides. This is a sales performance tracking ppt examples slides. This is a four stage process. The stages in this process are top opportunities, sales goal ytd, sales funnel, company, value, company, visitors, leads, repeat customer, customer, top sales reps, top selling plans, new customers, plan, jan, mar, may, jul, sep, nov, sales rep, mary, emma, michael, john.
-
 73302194 style essentials 2 financials 3 piece powerpoint presentation diagram infographic slide
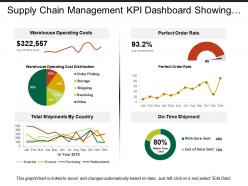
Presenting predesigned Supply Chain Management KPI Dashboard Showing Warehouse Operating Costs PPT slide. Download of the template design is simple. You can modify the layout font type, font size, colors and the background as per needs. Template slide is fully flexible with Google Slides and other online software’s. You can alter the design using the instructional slides provided with the template. You can remove the watermark with your brand name, trademark, signature or logo. You can save the template into PNG or JPEG formats. Supreme quality layouts are used to create this template which is editable in PowerPoint. Sample content can be replaced with your presentation content.
-
 81215616 style division donut 3 piece powerpoint presentation diagram infographic slide
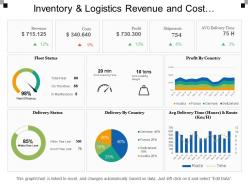
Presenting this set of slides with name - Inventory And Logistics Revenue And Cost Dashboards. This is a three stage process. The stages in this process are Inventory And Logistics, Inventory Management, Warehousing And Inventory Management.
-
 64316256 style division donut 2 piece powerpoint presentation diagram infographic slide
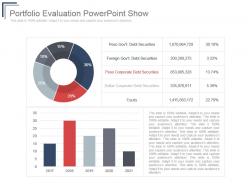
Presenting portfolio evaluation powerpoint show. This is a portfolio evaluation powerpoint show. This is a two stage process. The stages in this process are peso govt debt securities, foreign govt debt securities, peso corporate debt securities, dollar corporate debt securities, equity.
-
 38246743 style division donut 3 piece powerpoint presentation diagram infographic slide
Presenting employees who leave within first 6 months powerpoint shapes. This is a employees who leave within first 6 months powerpoint shapes. This is a three stage process. The stages in this process are employees left job within the first 6 months, felt their boss was a jerk, work was different than they expected, changed their mind on work type.
-
 11361631 style division donut 3 piece powerpoint presentation diagram infographic slide
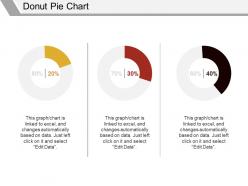
Presenting Donut Pie Chart Powerpoint Presentation PowerPoint slide. You can change the color, font size, font type and shapes of this PPT layout according to your needs. This PPT template is compatible with Google Slides and is available in both 4:3 and 16:9 aspect ratios. This ready to use PowerPoint presentation can be downloaded in various formats like PDF, JPG and PNG.
-
 3391700 style division donut 6 piece powerpoint presentation diagram infographic slide
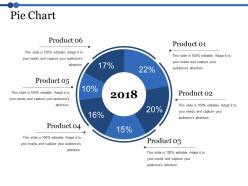
Pie Chart PPT Backgrounds PowerPoint template- a well-designed pie chart slide for visual presentation of data. This versatile PPT slide has both the standard as well as the wide-screen version available. You can easily choose from a variety of fonts, color schemes, images, and orientations on the PowerPoint interface to customize this PPT slide for your needs. This PPT model is compatible with Google Slides as well as Microsoft PowerPoint.
-
 76718518 style essentials 2 financials 5 piece powerpoint presentation diagram infographic slide
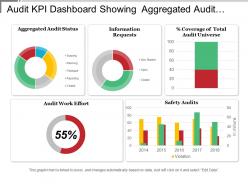
Presenting this set of slides with name - Audit Kpi Dashboard Showing Aggregated Audit Status And Audit Work Effort. This is a five stage process. The stages in this process are Audit, Examine, Survey.
-
 94292908 style essentials 2 financials 3 piece powerpoint presentation diagram infographic slide
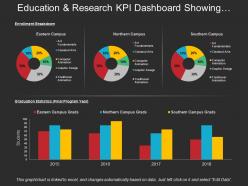
Presenting education and research KPI dashboard snapshot showing enrolment breakdown PPT slide. The student enrolment dashboard PowerPoint slide designed by the professional team of SlideTeam. The enrolment page KPI report template is fully editable in PowerPoint. The research enrolment KPI report PPT template is compatible with Google Slide so a user can share this enrolment dashboard slide with others. A user can make changes in the font size, font type, color as well as dimensions of the campus and college dashboard slide as per the requirement. You may edit the value in the enrollment reporting system dashboard template as the slide gets linked with the Excel sheet.
-
 74630549 style concepts 1 growth 3 piece powerpoint presentation diagram infographic slide
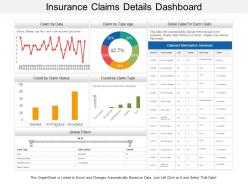
Presenting this set of slides with name - Insurance Claims Details Dashboard. This is a three stage process. The stages in this process are Assurance, Surety, Insurance.
-
 0414 human character with pie chart powerpoint graph
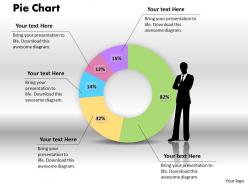
Extremely useful presentation tool to enhance the performance of your presentations. Does not make the information look messed up. Summarises large data set in a visually appealing way. Well matched framework with Google Slides. Allows changing the formats into JPG and PDF. Equipped with high-resolution pie chart which can even be viewed in big screens without compromising the quality.
-
 66914169 style essentials 2 dashboard 4 piece powerpoint presentation diagram infographic slide
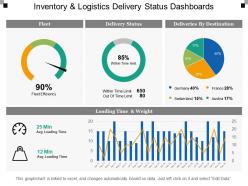
Presenting this set of slides with name - Inventory And Logistics Delivery Status Dashboards. This is a four stage process. The stages in this process are Inventory And Logistics, Inventory Management, Warehousing And Inventory Management.
-
 69251986 style essentials 2 financials 3 piece powerpoint presentation diagram infographic slide
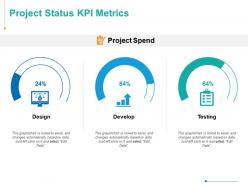
Presenting this set of slides with name - Project Status KPI Metrics Testing Ppt Powerpoint Presentation Inspiration Layouts. This is a three stage process. The stages in this process are Design, Develop, Testing, Finance, Marketing.
-
 25327450 style essentials 2 financials 4 piece powerpoint presentation diagram infographic slide
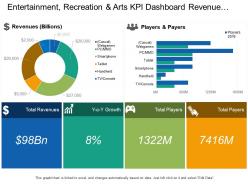
Presenting this set of slides with name - Entertainment Recreation And Arts Kpi Dashboard Revenue Players And Payers. This is a four stage process. The stages in this process are Entertainment, Recreation And Arts, Attractions, Culture, Entertainment.
-
 61395 style essentials 2 financials 4 piece powerpoint presentation diagram infographic slide
Presenting this set of slides with name - Social Media Kpi Dashboard Showing Traffic Social Events Referral Traffic. This is a four stage process. The stages in this process are Social Media, Digital Marketing, Social Marketing.
-
 36161271 style division donut 4 piece powerpoint presentation diagram infographic slide
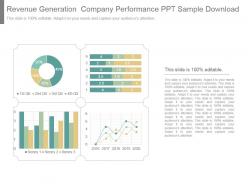
Presenting revenue generation company performance ppt sample download. This is a revenue generation company performance ppt sample download. This is a four stage process. The stages in this process are business, management, analysis, strategy, success.
-
 52249619 style division donut 4 piece powerpoint presentation diagram infographic slide
Presenting our Pie Chart PPT Slide. The template is fully editable in PowerPoint and compatible with Google Slides as well. You can adapt the slideshow according to your unique business requirements. Add your text, image, or icon with ease. The template can be converted into different formats such as JPG, PDF, etc. without any hassle. High-quality graphics ensure an attention-grabbing presentation. Additionally, it is available in both 4:3 and 16:9 aspect ratios.
-
 66241018 style essentials 2 financials 5 piece powerpoint presentation diagram infographic slide
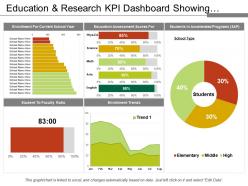
Presenting education and research KPI dashboard snapshot showing enrolment and SAP PPT slide. The enrolment and SAP analytic KPI dashboard PowerPoint template designed by the professional team of SlideTeam. The SAP package KPI report slide is fully editable in PowerPoint. The research SAP dashboard presentation slide is compatible with Google Slide so a user can share this SAP analytic dashboard slide with others. A user can make changes in the font size, font type, color as well as dimensions of the SAP analytics cloud business content dashboard PowerPoint template as per the requirement.
-
 73067181 style essentials 2 financials 4 piece powerpoint presentation diagram infographic slide
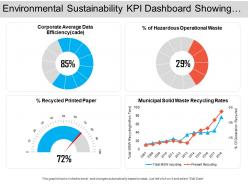
Presenting this set of slides with name - Environmental Sustainability Kpi Dashboard Showing Corporate Average Data Efficiency. This is a four stage process. The stages in this process are Environment Sustainability, Environment Continual, Environment Feasibility.
-
 42640045 style division pie 2 piece powerpoint presentation diagram infographic slide
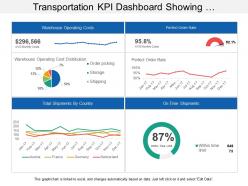
Presenting transportation KPI dashboard showing warehouse operating costs perfect order rate PPT slide. This layout is fully compatible with Google slides and data driven. User can edit the data in linked excel sheet and graphs and charts gets customized accordingly. Easy to put in company logo, trademark or name; accommodate words to support the key points. Images do no distort out even when they are projected on large screen. Adjust colors, text and fonts as per your business requirements.


