All Excel Linked Donut Chart Graph Powerpoint Diagram Slide
-
 0514 5 staged unique style data driven pie chart powerpoint slides
The PowerPoint presentation ensures proofing and editing with ease. Utmost useful to management professionals, big or small organizations and business startups. Supports recasting the color, size and orientation in presentation slide show according to the requirement. High resolution in color and art shape is offered by PPT graphic. Offers high resolution without compromising on pixels quality in PPT layout when viewed on a larger screen. PowerPoint slide is well compatible with Google slides.
-
 Pie chart with magnifier result analysis powerpoint slides
Readymade template pie chart with magnifier result analysis. Can be used for business people, sales executives and communication departments. Colors, charts and shapes can be easily changed as the PPT slide is completely editable. Simply click to add company logo, trademark or name. This PPT Slide is available in both Standard and Widescreen slide size. Easy and quick downloading process.
-
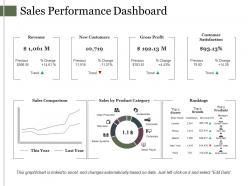 61912835 style essentials 2 financials 7 piece powerpoint presentation diagram infographic slide
Presenting this set of slides with name - Sales Performance Dashboard Presentation Diagrams. This is a seven stage process. The stages in this process are Slide Bar, Marketing, Finance, Growth, Strategy.
-
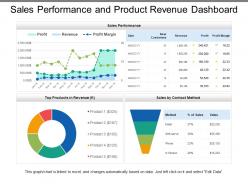 99615545 style essentials 2 financials 4 piece powerpoint presentation diagram infographic slide
Presenting this set of slides with name - Sales Performance And Product Revenue Dashboard. Amazing representation of content used in the PowerPoint slide. Good quality pixels used in the designing. High resolution presentation design does not affect the quality even when projected on wide screen. Easy convert into different formats such as JPG and PDF. Compatible with maximum number of software and Google slides. Easy to add and remove content as per business need. Totally modifiable PPT template as text, icons and graphics are editable. Insert Company’s personalized content and logo.
-
 64075871 style essentials 2 financials 6 piece powerpoint presentation diagram infographic slide
Presenting this set of slides with name - Inventory And Logistics Dashboard Ppt Powerpoint Presentation Summary Background Image. This is a six stages process. The stages in this process are Finance, Marketing, Management, Investment, Analysis.
-
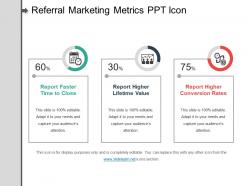 72024561 style layered horizontal 3 piece powerpoint presentation diagram infographic slide
Presenting referral marketing metrics ppt icon. This is a referral marketing metrics ppt icon. This is a three stage process. The stages in this process are Report Faster Time to Close, Report Higher Lifetime Value, Report Higher Conversion Rates.
-
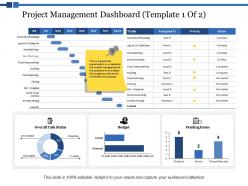 31901535 style division donut 3 piece powerpoint presentation diagram infographic slide
This is a three stages process. The stages in this process are Finance, Marketing, Management, Investment, Analysis.
-
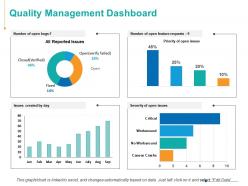 89610198 style essentials 2 financials 4 piece powerpoint presentation diagram infographic slide
Presenting this set of slides with name - Quality Management Dashboard Marketing Ppt Powerpoint Presentation Infographics Skills. This is a four stage process. The stages in this process are Finance, Analysis, Business, Investment, Marketing.
-
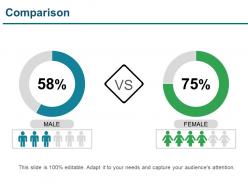 62607891 style essentials 2 compare 2 piece powerpoint presentation diagram template slide
Presenting our Comparison Presentation PowerPoint Templates. This PPT theme is available in both 4:3 and 16:9 aspect ratios. Choose this PPT graphic to display apt and suitable comparative graphs, charts, and images. This PPT layout is 100% adaptable allowing you to modify the font, color, font size, and shapes. This PPT presentation is also Google Slides compatible making it easily accessible. Without further ado, click the download button!
-
 46380030 style circular zig-zag 3 piece powerpoint presentation diagram template slide
Presenting New Business Journey PPT Slide. Individualize this PPT layout as per your requirements. You are free to change anything in this PPT slide. The colors, the font type, font size, and the background, everything is under your control. We offer you a high-resolution graphics template that is entirely compatible with Google Slides. Convert and save this slide in various formats, including JPG and PDF formats. Download this slide design in 2 screen sizes i.e., standard screen and widescreen.
-
 51641259 style division donut 5 piece powerpoint presentation diagram infographic slide
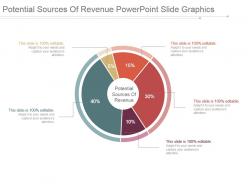
Presenting potential sources of revenue powerpoint slide graphics. This is a potential sources of revenue powerpoint slide graphics. This is a five stage process. The stages in this process are potential sources of revenue.
-
 99399496 style division donut 6 piece powerpoint presentation diagram infographic slide
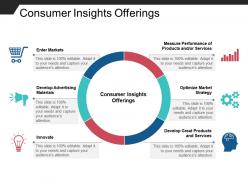
Presenting this Consumer Insights Offerings PowerPoint presentation. The slide is 100% adaptable in PowerPoint and compatible with Google Slides. Modify the font style, font color, and other components with ease. Convert this template into common document or image formats such as PDF or JPEG. High-quality graphics always ensure that quality is not affected.
-
 15007335 style essentials 2 compare 2 piece powerpoint presentation diagram infographic slide
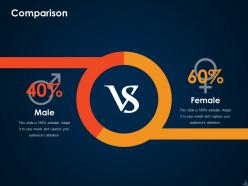
Presenting this set of slides with name - Comparison Ppt Icon Examples. This is a two stage process. The stages in this process are Business, Marketing, Male, Female, Comparison, Percentage.
-
 Data driven compare market share of brand powerpoint slides
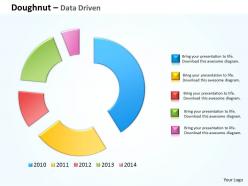
We are proud to present our data driven compare market share of brand powerpoint slides. Be The Star Of The Show With Our Data Driven Compare Market Share Of Brand Powerpoint Slides Power Point Templates. Rock The Stage With Your Ideas. Break Through With Our Data Driven Compare Market Share Of Brand Powerpoint Slides Power Point Templates. Bring Down The Mental Barriers Of Your Audience.
-
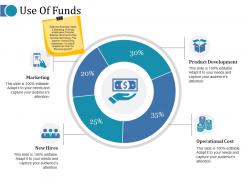 47282430 style division donut 4 piece powerpoint presentation diagram infographic slide
Presenting this set of slides with name - Use Of Funds Ppt Layouts Slide Download. This is a four stage process. The stages in this process are Marketing, New Hires, Operational Cost, Product Development.
-
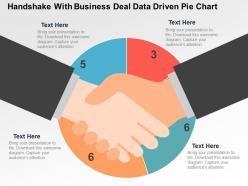 Handshake with business deal data driven pie chart powerpoint slides
We are proud to present our handshake with business deal data driven pie chart powerpoint slides. Graphic of handshake and pie chart has been used to design this power point template diagram. This PPT diagram contains the concept of data driven business deal and analysis. Use this PPT diagram for business and finance related presentations.
-
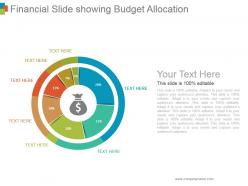 60453361 style division donut 7 piece powerpoint presentation diagram infographic slide
Presenting financial slide showing budget allocation ppt background. This is a financial slide showing budget allocation ppt background. This is a seven stage process. The stages in this process are circular, process, percentage, financial, budget.
-
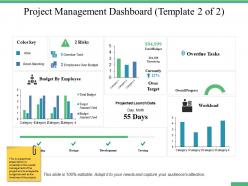 95095097 style essentials 2 financials 4 piece powerpoint presentation diagram infographic slide
Presenting this set of slides with name - Project Management Dashboard Snapshot Ppt Professional Graphic Images. This is a four stage process. The stages in this process are Percentage, Product, Management, Marketing, Business.
-
 72196408 style technology 1 servers 1 piece powerpoint presentation diagram infographic slide
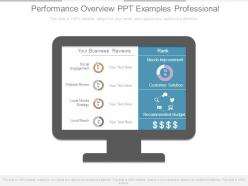
Presenting performance overview ppt examples professional. This is a performance overview ppt examples professional. This is a one stage process. The stages in this process are social engagement, website review, local mobile strategy, local reach, your business, reviews, rank, needs improvement, customer solution, recommended budget.
-
 Devops kpi dashboard showing mean time to recover
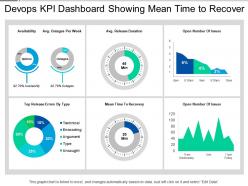
Presenting this set of slides with name - Devops Kpi Dashboard Showing Mean Time To Recover. This is a six stage process. The stages in this process are Development And Operations, Devops.
-
 Donut style pie chart for data driven analysis powerpoint slides
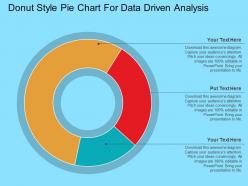
Organized slide pie diagram is totally variable. Downloading design in any configuration choices like JPEG, JPG or PDF is straightforward and lively. Provide a star point of view to your organization slides. Highly clear with Google slides. Symbols are in like way being joined. Editing of substance, portrayal, diagrams, and substance as showed up by your hurting and need. Visuals don't dark when exposed on widescreen.
-
 77576042 style essentials 2 financials 5 piece powerpoint presentation diagram infographic slide
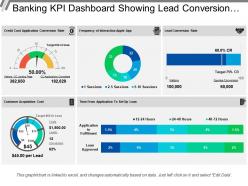
Presenting this set of slides with name - Banking Kpi Dashboard Showing Lead Conversion And Acquisition Cost. This is a five stage process. The stages in this process are Banking, Finance, Money.
-
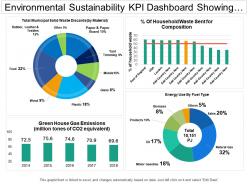 42217199 style division pie 4 piece powerpoint presentation diagram infographic slide
Presenting this set of slides with name - Environmental Sustainability Kpi Dashboard Showing Municipal Solid Waste Discard. This is a four stage process. The stages in this process are Environment Sustainability, Environment Continual, Environment Feasibility.
-
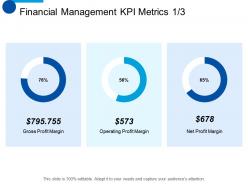 18006999 style essentials 2 financials 3 piece powerpoint presentation diagram infographic slide
Presenting this set of slides with name - Financial Management KPI Metrics Strategy Ppt Visual Aids Infographic Template. This is a three stage process. The stages in this process are Gross Profit Margin, Net Profit Margin, Operating Profit Margin, Finance, Planning.
-
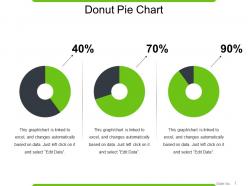 63495974 style division pie-donut 3 piece powerpoint presentation diagram infographic slide
Presenting Donut Pie Chart PowerPoint Shapes. Get this completely customizable slide and make changes in it to match it to your presentation theme. Modify the colors, background, text, and the icon. The number of points can be increased or decreased as per your choice. Adjust the shape and size of the image. Transform and save it in various formats, including JPG and PDF file formats. It is compatible with the Google Slides, and the major Microsoft versions. Can be viewed clearly on full screen because of its splendid picture quality.
-
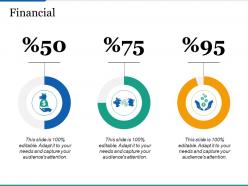 56016393 style essentials 2 financials 3 piece powerpoint presentation diagram infographic slide
This is a three stage process. The stage in this process are Business, Management, Finance, Analysis, Strategy.
-
 66203355 style division donut 3 piece powerpoint presentation diagram infographic slide
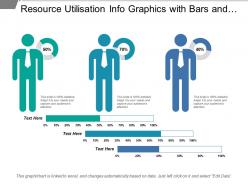
Presenting this set of slides with name - Resource Utilisation Info Graphics With Bars And Graphs. This is a three stage process. The stages in this process are Resource Management, Resource Utilization, Resource Allocation.
-
 Donut chart with icons for data driven statistics powerpoint slides
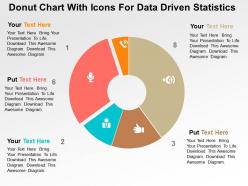
Businessmen, micro, small and medium enterprises can use the PPT visual as a master slide. PowerPoint presentation supports filling background in a different color from the text. All images are 100% editable in the presentation slide. Text can be differentiated form the background by the handy features provided by PPT layout. There is no space constrain in the PowerPoint design, thus enabling easy addition or edition of data.
-
 18075649 style essentials 2 financials 5 piece powerpoint presentation diagram template slide
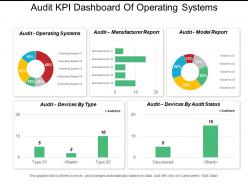
Presenting this set of slides with name - Audit Kpi Dashboard Of Operating Systems Manufacturer Report And Model Report. This is a five stage process. The stages in this process are Audit, Examine, Survey.
-
 52553811 style division donut 4 piece powerpoint presentation diagram infographic slide
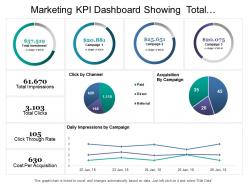
Presenting marketing KPI dashboard showing total investment impressions click cost per acquisition PPT slide. This layout is fully compatible with Google slides and data driven. User can edit the data in linked excel sheet and graphs and charts gets customized accordingly. Easy to put in company logo, trademark or name; accommodate words to support the key points. Images do no distort out even when they are projected on large screen. Adjust colors, text and fonts as per your business requirements
-
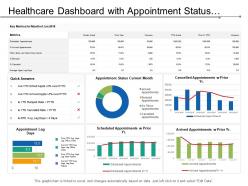 23612104 style essentials 2 financials 6 piece powerpoint presentation diagram infographic slide
Presenting this set of slides with name - Healthcare Dashboard With Appointment Status Current Month. This is a six stage process. The stages in this process are Healthcare, Health Improvement, Medical Care.
-
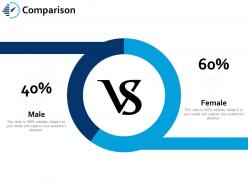 45265744 style essentials 2 compare 2 piece powerpoint presentation diagram infographic slide
Presenting this set of slides with name - Comparison Ppt Portfolio Information. This is a two stage process. The stages in this process are Business, Management, Strategy, Analysis, Comparison.
-
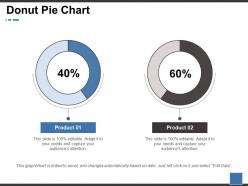 42219778 style division donut 2 piece powerpoint presentation diagram infographic slide
Explore the donut pie chart PowerPoint presentation slide. This presentation has been designed by professionals and is fully editable. You can reshape the font size, font type, colors, and even the background. This Template is attainable with Google Slide and can be saved in JPG or PDF format without any resistance created during the process. Fast download at the click of the button provided below.
-
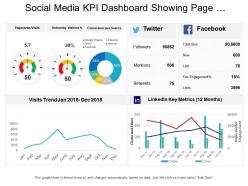 44756860 style essentials 2 financials 4 piece powerpoint presentation diagram infographic slide
Presenting this set of slides with name - Social Media Kpi Dashboard Showing Page Viewsvisits Conversion Per Source. This is a four stage process. The stages in this process are Social Media, Digital Marketing, Social Marketing.
-
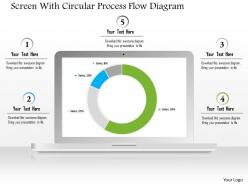 1114 screen with circular process flow diagram powerpoint template
Alteration can be possible with color, font, shape and even text. Instant download and can be altered in JPEG and PDF format. Alternate to customize the design by adding business name, icon and mark. Adjustable presentation template with wonderful picture quality. PPT design can be shown in standard and widescreen view. Availability to get similar designs with different nodes and stages as required.
-
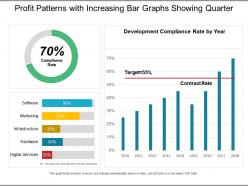 97184548 style essentials 2 financials 3 piece powerpoint presentation diagram infographic slide
Presenting this set of slides with name - Profit Patterns With Increasing Bar Graphs Showing Quarter. This is a three stage process. The stages in this process are Engineering, Procurement And Construction, Construction Management, Engineering, Purchasing And Construction .
-
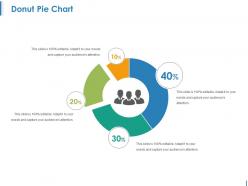 9137099 style division donut 4 piece powerpoint presentation diagram infographic slide
Presenting this set of slides with name - Donut Pie Chart Ppt Examples. This is a four stage process. The stages in this process are Donut Pie Chart, Finance, Marketing, Strategy, Analysis.
-
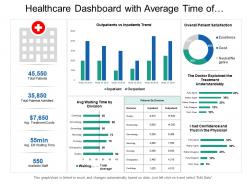 33572242 style essentials 2 financials 5 piece powerpoint presentation diagram infographic slide
Presenting this set of slides with name - Healthcare Dashboard With Average Time Of Division And Patient Satisfaction. This is a five stage process. The stages in this process are Healthcare, Health Improvement, Medical Care.
-
 1977365 style essentials 2 financials 8 piece powerpoint presentation diagram infographic slide
Presenting this set of slides with name - Government And Public Works Kpi Dashboard Showing Criminal Records. This is a eight stage process. The stages in this process are Government And Public Works, Government And Public Tasks.
-
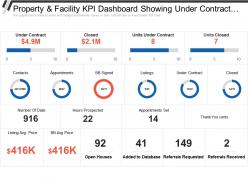 37590182 style essentials 2 financials 3 piece powerpoint presentation diagram infographic slide
Get a chance to explore, property and facility KPI dashboard showing under contract closed and monthly team pacing KPI dashboard PowerPoint Presentation Slide. This Presentation has been designed by professionals and is fully editable. You can reshape the font size, font type, colors, and even the background. This Template is cordial with Google Slide and can be saved in JPG or PDF format without any resistance created. Fast download at the click of the button.
-
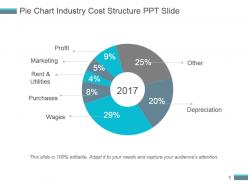 11243198 style division donut 7 piece powerpoint presentation diagram infographic slide
Presenting pie chart industry cost structure ppt slide. This is a pie chart industry cost structure ppt slide. This is a seven stage process. The stages in this process are profit, marketing, rent and utilities, purchases, wages, other, depreciation.
-
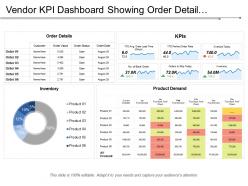 58305884 style essentials 2 financials 4 piece powerpoint presentation diagram infographic slide
Presenting this set of slides with name - Vendor Kpi Dashboard Showing Order Detail Inventory And Orders To Ship Today. This is a four stage process. The stages in this process are Vendor, Supplier, Retailer.
-
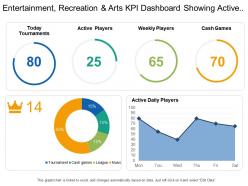 15605836 style essentials 2 financials 4 piece powerpoint presentation diagram infographic slide
Presenting this set of slides with name - Entertainment Recreation And Arts Kpi Dashboard Showing Active Daily Players And Today Tournaments. This is a four stage process. The stages in this process are Entertainment, Recreation And Arts, Attractions, Culture, Entertainment.
-
 57357502 style division donut 4 piece powerpoint presentation diagram infographic slide
Presenting comparison PowerPoint slide rules. The comparison chart template designed by professional team of SlideTeam to compare different things. The comparison analysis PowerPoint temple is completely editable in PowerPoint. The comparison chart in excel PPT slide is compatible with Google Slide and the comparison slide gets linked with Excel data sheet. You can make changes in the font size, font type, color as well as dimensions of the circular icons in the comparison chart circles diagram slide as per the requirement.
-
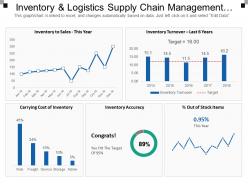 17348758 style division donut 5 piece powerpoint presentation diagram infographic slide
Presenting inventory and logistics supply chain management dashboards PowerPoint template. Access to edit the content, style, size and orientation of the PPT slides. Extremely spacious to cover all the aspects of the company profile. High resolution images do not pixelate when projected on wide screen. Personalize the PPT with your company name and logo. Modify the presentation elements as per the need of an hour. Compatible with numerous software and format options. Used by entrepreneurs, marketers, managerial department, stakeholders and students. Self-explanatory and intellectual slide charts.
-
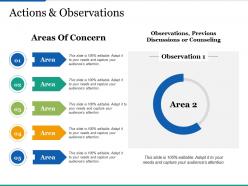 46670438 style layered vertical 5 piece powerpoint presentation diagram template slide
This is a five stage process. The stage in this process are Business, Management, Observations, Discussions, Counseling.
-
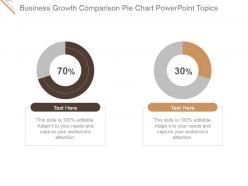 14123953 style division donut 2 piece powerpoint presentation diagram infographic slide
Presenting business growth comparison pie chart powerpoint topics. This is a business growth comparison pie chart powerpoint topics. This is a two stage process. The stages in this process are business, meter, measure, growth, comparison.
-
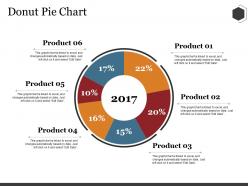 39334002 style division donut 6 piece powerpoint presentation diagram infographic slide
Presenting this set of slides with name - Donut Pie Chart Ppt Summary Rules. This is a six stage process. The stages in this process are Business, Percentage, Years, Marketing, Chart.
-
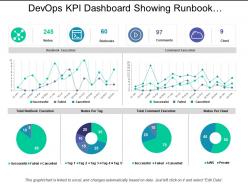 Devops kpi dashboard showing runbook execution and command execution
Presenting this set of slides with name - Devops Kpi Dashboard Showing Runbook Execution And Command Execution. This is a six stage process. The stages in this process are Development And Operations, Devops.
-
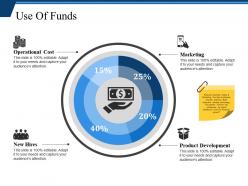 28319574 style division donut 4 piece powerpoint presentation diagram infographic slide
Presenting this set of slides with name - Use Of Funds Powerpoint Slide Templates Download. This is a four stage process. The stages in this process are Operational Cost, Marketing, New Hires, Product Development.
-
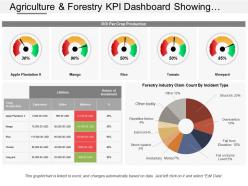 28408799 style essentials 2 dashboard 3 piece powerpoint presentation diagram infographic slide
Presenting agriculture and forestry KPI dashboard showing ROI per crop production and industry claim count PowerPoint slide. Unaffected high-resolution PowerPoint slide. Include or exclude slide content as per your individual need. Personalize the presentation with individual company name and logo. Beneficial for industry professionals, managers, executives, researchers, sales people, etc. This template is available in both Standard and Widescreen slide size. Easy and quick downloading process. Flexible option for conversion in PDF or JPG formats. Compatible with Google slides.
-
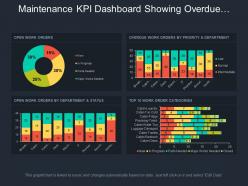 61116850 style division donut 4 piece powerpoint presentation diagram infographic slide
Presenting this set of slides with name - Maintenance Kpi Dashboard Showing Overdue Work Orders By Priority And Department. This is a four stage process. The stages in this process are Maintenance, Preservation, Conservation.
-
 27059106 style division pie 3 piece powerpoint presentation diagram infographic slide
Presenting transportation KPI dashboard snapshot showing fleet delivery status loading time and weight PPT slide. Simple data input with linked Excel chart, just right click to input values. This PowerPoint theme is fully supported by Google slides. Picture quality of these slides does not change even when project on large screen. Fast downloading speed and formats can be easily changed to JPEG and PDF applications. This template is suitable for marketing, sales persons, business managers and entrepreneurs.
-
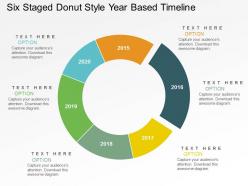 Six staged donut style year based timeline powerpoint slides
High resolution PPT example for timeline to identify sales growth. Increase the level of personalization with your company logo and name. Compatible with all software and can be saved in any format. Useful tool for business analysts, sales people, sales managers and professionals of any industry. Precise and easy to comprehend information on PPT sample. Wide screen projection does not affect the output adversely.
-
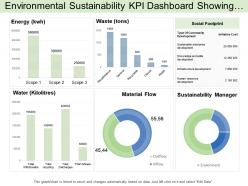 20381011 style division donut 6 piece powerpoint presentation diagram infographic slide
Presenting this set of slides with name - Environmental Sustainability Kpi Dashboard Showing Social Footprint And Supply Chain Category. This is a six stage process. The stages in this process are Environment Sustainability, Environment Continual, Environment Feasibility.
-
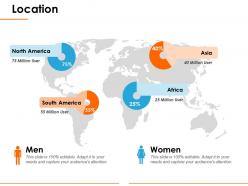 82309151 style division pie-donut 4 piece powerpoint presentation diagram infographic slide
Presenting location PPT template. This world map template for PowerPoint is fully editable and is designed by professionals. You can easily customize the objects in the slide like font size and font color. This presentation slide is fully compatible with Google Slide and can be saved in JPG or PDF file format easily. Download this fast at the click of a button.
-
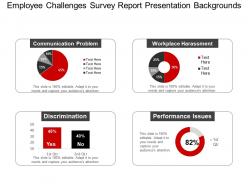 31044132 style essentials 2 financials 4 piece powerpoint presentation diagram infographic slide
Presenting employee challenges survey report presentation backgrounds. This is a employee challenges survey report presentation backgrounds. This is a four stage process. The stages in this process are survey, forecasting, statistics.
-
 93503514 style essentials 2 financials 4 piece powerpoint presentation diagram infographic slide
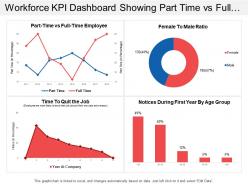
Presenting this set of slides with name - Workforce Kpi Dashboard Showing Part Time Vs Full Time Employee. This is a four stage process. The stages in this process are Staff, Personnel, Workforce.
-
 89406149 style division donut 8 piece powerpoint presentation diagram template slide
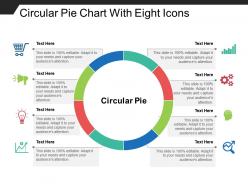
Presenting circular pie chart with eight icons. This is a circular pie chart with eight icons. This is a eight stage process. The stages in this process are customer insight, consumer insight, customer experience.
-
 62607905 style division donut 4 piece powerpoint presentation diagram infographic slide
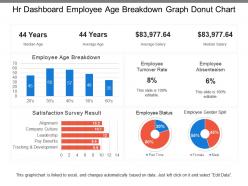
Presenting this set of slides with name - Hr Dashboard Employee Age Breakdown Graph Donut Chart. This is a four stage process. The stages in this process are Hr Dashboard, Human Resource Dashboard, Hr Kpi.


