All Excel Linked Donut Chart Graph Powerpoint Diagram Slide
-
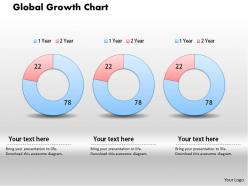 0414 global growth donut chart powerpoint graph
Straightforward download in quick and easy steps. Insert text to as per to the context without constraint on word length. High resolution PPT icons with fully modifiable size, color scheme and orientation. Add your company logo, trademark, tagline etc. for personalization. Project on wide screen without pixelation. Perfectly compatible with Google slides and easily convertible to PDF or JPG formats.
-
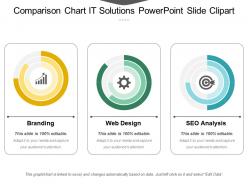 77911575 style essentials 2 compare 3 piece powerpoint presentation diagram infographic slide
Presenting our comparison chart it solutions PowerPoint slide clipart. This PPT display can be used to represent business it solutions in an approachable way. All the components used here are fully editable by means of color, shape, and orientation, font shape, font type, font size, and text. This PPT plan can be used with Google Slides and can be adjusted in any PowerPoint software. These high-quality graphics can be projected on widescreen forecasts and are available in both standard 4:3, widescreen format 16:9 after downloading.
-
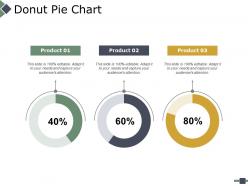 13422882 style division pie-donut 3 piece powerpoint presentation diagram infographic slide
Presenting this set of slides with name - Donut Pie Chart Ppt Powerpoint Presentation File Infographics. This is a three stage process. The stages in this process are Percentage, Product, Business, Management, Marketing.
-
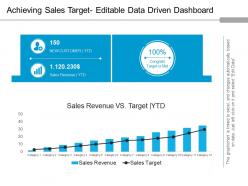 66633698 style concepts 1 growth 2 piece powerpoint presentation diagram infographic slide
The design allows full editing. You can modify and customize the design the way you want. The design makes use of excel linked chart, where you need to include business related facts on excel sheet and it will automatically get changed in the PPT design. Quick and easy downloading available. You can download the design into JPEG and PDF formats. Design template is fully compatible with Google Slides and MS PowerPoint software.
-
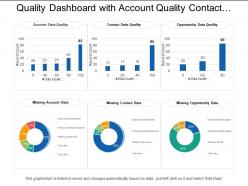 47572750 style essentials 2 financials 6 piece powerpoint presentation diagram infographic slide
Presenting this set of slides with name - Quality Dashboard Snapshot With Account Quality Contact Data Missing Account Data. This is a six stage process. The stages in this process are Quality Dashboard, Quality Kpi, Quality Metircs.
-
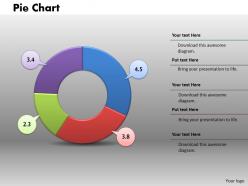 0414 colorful donut chart business graphics powerpoint graph
PPT slide works evenly and smoothly on all software. PPT example can be downloaded easily. More customization by including your company’s logo, trademark. No space constraints whatsoever. Graphics do not pixelate when displayed on widescreen format. Insert title and sub-title at your discretion. Slides compatible with Google slides for more viewership. Flexible layout including font, text, color and design. Change to JPG and PDF formats in moments.
-
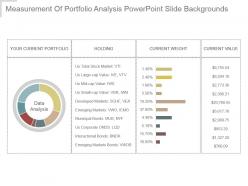 62170967 style division donut 7 piece powerpoint presentation diagram infographic slide
Presenting measurement of portfolio analysis powerpoint slide backgrounds. This is a measurement of portfolio analysis powerpoint slide backgrounds. This is a seven stage process. The stages in this process are data analysis, your current portfolio, holding, current weight, current value.
-
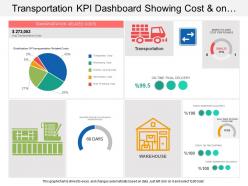 27914762 style division pie 2 piece powerpoint presentation diagram template slide
Presenting transportation KPI dashboard showing cost and on time final delivery PPT slide. This deck offers you plenty of space to put in titles and sub titles. This template is Excel linked just right click to input your information. High resolution based layout, does not change the image even after resizing. This presentation icon is fully compatible with Google slides. Quick downloading speed and simple editing options in color text and fonts.PPT icons can easily be changed into JPEG and PDF applications.
-
 14716698 style division donut 4 piece powerpoint presentation diagram infographic slide
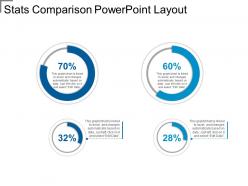
Presenting, our, stats comparison PowerPoint layout. Download this design within a few seconds and add your company logo. Alter the text to suit the context and justify your data. Use this stats comparison layout in your business meetings and use in both standard 4:3 and widescreen format 16:9 after downloading. No difference in the quality of PPT models after editing. Transform into jpeg/pdf as per term. This design is entirely compatible with Google Slides and various online and offline software. Pitch this PPT deck on widescreens to for an impactful activity. Personalize the color schemes, text and font as needed.
-
 98670159 style essentials 2 compare 2 piece powerpoint presentation diagram infographic slide
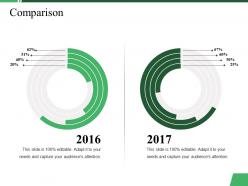
Presenting this set of slides with name - Comparison Ppt Summary Rules. This is a two stage process. The stages in this process are Comparison, Years, Business, Marketing, Strategy.
-
 96573578 style essentials 2 financials 5 piece powerpoint presentation diagram infographic slide
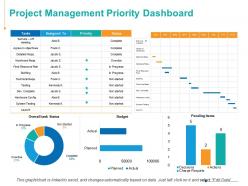
Presenting this set of slides with name - Project Management Priority Dashboard Marketing Ppt Powerpoint Presentation Inspiration Outline. This is a five stage process. The stages in this process are Staffing, Priority, Budget, Planned, Actual.
-
 47412084 style division donut 5 piece powerpoint presentation diagram infographic slide
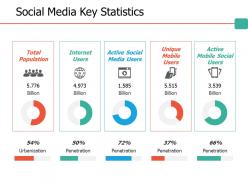
Presenting this set of slides with name - Social Media Key Statistics Ppt Professional Files. This is a five stage process. The stages in this process are Business, Management, Strategy, Analysis, Icons.
-
 40601208 style division donut 3 piece powerpoint presentation diagram infographic slide
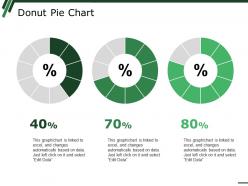
Presenting Donut Pie Chart PPT Summary Background Images PPT slide. The donut design template designed by the professional team of SlideTeam to present the numerical data. The fully editable donut pie chart PowerPoint slide is compatible with Google Slide. You can modify the font size, font type, color, and shape of the donut design as the pie chart template can help a user in processing the data. You can insert the text related to the sales distribution of your organization. Numerous customized icons available at SlideTeam website, you can download and insert icons in your presentation.
-
 80114677 style division donut 4 piece powerpoint presentation diagram infographic slide
Presenting this set of slides with name - Our Market Share Ppt Show. This is a four stage process. The stages in this process are Wages, Depreciation, Rent And Utilities, Marketing.
-
 11580578 style essentials 2 financials 5 piece powerpoint presentation diagram infographic slide
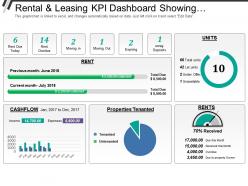
Presenting this set of slides with name - Rental And Leasing Kpi Dashboard Showing Rent Due Today Rent Overdue Properties Tenanted. This is a five stage process. The stages in this process are Rental And Leasing, Dealing And Leasing, Rental And Engage.
-
 64224612 style division donut 3 piece powerpoint presentation diagram template slide
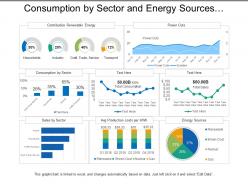
Presenting this set of slides with name - Consumption By Sector And Energy Sources Utilities Dashboard. This is a three stage process. The stages in this process are Utilities, Use, Advantage.
-
 88683392 style essentials 2 dashboard 3 piece powerpoint presentation diagram infographic slide
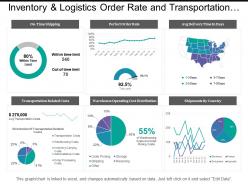
Presenting this set of slides with name - Inventory And Logistics Order Rate And Transportation Costs Dashboards. This is a three stage process. The stages in this process are Inventory And Logistics, Inventory Management, Warehousing And Inventory Management.
-
 73577270 style division donut 5 piece powerpoint presentation diagram infographic slide
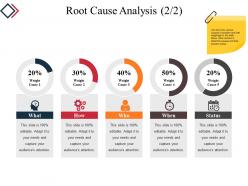
Presenting root cause analysis powerpoint slide deck template. This is a root cause analysis powerpoint slide deck template. This is a five stage process. The stages in this process are donut, business, marketing, strategy, planning.
-
 12442202 style essentials 2 compare 2 piece powerpoint presentation diagram infographic slide
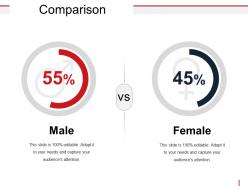
Presenting comparison powerpoint guide. This is a comparison powerpoint guide. This is a two stage process. The stages in this process are comparison, percentage, male, female, business.
-
 57543070 style essentials 2 financials 3 piece powerpoint presentation diagram infographic slide
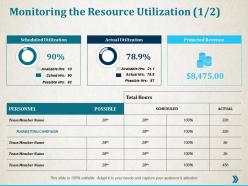
Presenting this set of slides with name - Monitoring The Resource Utilization Ppt Professional Infographic Template. This is a three stage process. The stages in this process are Finance, Analysis, Business, Investment, Marketing.
-
 44821695 style division donut 6 piece powerpoint presentation diagram infographic slide
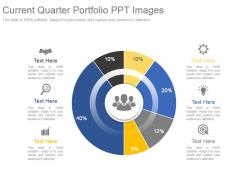
Presenting current quarter portfolio ppt images. This is a current quarter portfolio ppt images. This is a six stage process. The stages in this process are pie, business, marketing, finance, management.
-
 21004700 style division donut 4 piece powerpoint presentation diagram infographic slide
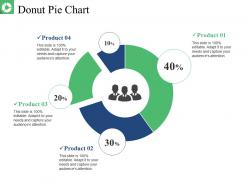
Presenting this set of slides with name - Donut Pie Chart Presentation Layouts. This is a four stage process. The stages in this process are Donut Pie Chart, Finance, Marketing, Strategy, Analysis.
-
 84618710 style essentials 2 financials 6 piece powerpoint presentation diagram infographic slide
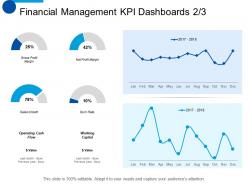
Presenting this set of slides with name - Financial Management KPI Dashboards Snapshot Planning Ppt Summary Smartart. This is a six stage process. The stages in this process are Sales Growth, Gross Profit Margin, Net Profit Margin, Planning, Marketing.
-
 76047564 style essentials 2 financials 3 piece powerpoint presentation diagram infographic slide
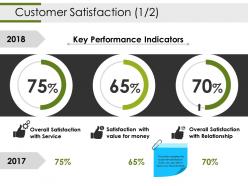
Presenting customer satisfaction powerpoint slide backgrounds. This is a customer satisfaction powerpoint slide backgrounds. This is a three stage process. The stages in this process are donut, marketing, planning, finance, success.
-
 0514 data driven donut diagram powerpoint slides
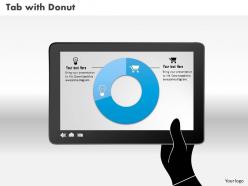
We are proud to present our 0514 data driven donut diagram powerpoint slides. This Business power Point template is designed with unique donut shape diagram. Enhance the beauty of your presentation with our unique template collection.
-
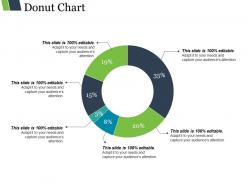 64961481 style division donut 6 piece powerpoint presentation diagram infographic slide
Presenting donut chart presentation ideas. This is a donut chart presentation ideas. This is a six stage process. The stages in this process are percentage, finance, donut, business.
-
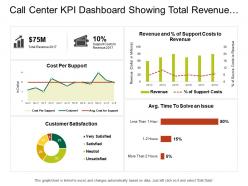 75556366 style essentials 2 financials 4 piece powerpoint presentation diagram infographic slide
Presenting this set of slides with name - Call Center Kpi Dashboard Showing Total Revenue Customer Satisfaction Costs Per Support. This is a four stage process. The stages in this process are Call Center Agent, Customer Care, Client Support.
-
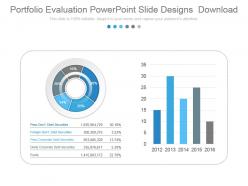 14845295 style division donut 2 piece powerpoint presentation diagram infographic slide
Presenting portfolio evaluation powerpoint slide designs download. This is a portfolio evaluation powerpoint slide designs download. This is a two stage process. The stages in this process are peso govt debt securities, foreign govt debt securities, peso corporate debt securities, dollar corporate debt securities, equity.
-
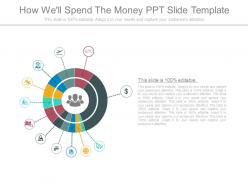 66897743 style division donut 12 piece powerpoint presentation diagram infographic slide
Presenting how well spend the money ppt slide template. This is a how well spend the money ppt slide template. This is a twelve stage process. The stages in this process are business, management, strategy, icons, process.
-
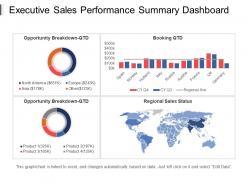 77240525 style division donut 4 piece powerpoint presentation diagram infographic slide
Presenting executive sales performance summary dashboard PPT slide templates PPT slide. Vector-based designing. High-resolution visuals which do not pixelate when projected on a wide screen. Ease of personalization and customization. Add or exclude company-specific content at your choice. Guidelines for executing the changes have been provided for convenience. PPT is compatible with Windows, Mac and other formats and software options. Used by professionals belonging to multiple organizations. Ease of download.
-
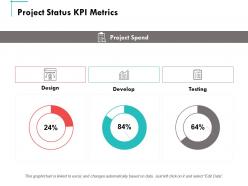 38022365 style essentials 2 financials 3 piece powerpoint presentation diagram infographic slide
Presenting this set of slides with name - Project Status Kpi Metrics Develop Ppt Powerpoint Presentation Summary Aids. This is a three stages process. The stages in this process are Finance, Marketing, Management, Investment, Analysis.
-
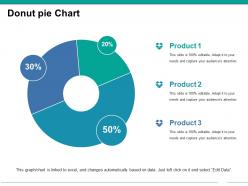 62266666 style division donut 3 piece powerpoint presentation diagram infographic slide
Presenting this set of slides with name - Donut Pie Chart Ppt Images. This is a three stage process. The stages in this process are Business, Marketing, Planning, Finance, Donut.
-
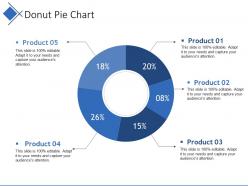 16263694 style division donut 5 piece powerpoint presentation diagram infographic slide
Presenting this set of slides with name - Donut Pie Chart Presentation Backgrounds. This is a five stage process. The stages in this process are Business, Marketing, Percentage, Chart, Process.
-
 81702472 style concepts 1 decline 2 piece powerpoint presentation diagram infographic slide
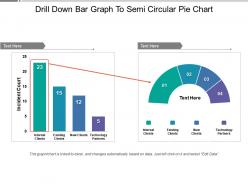
Presenting this set of slides with name - Drill Down Bar Graph To Semi Circular Pie Chart. This is a two stage process. The stages in this process are Drill Down, Hierarchy, Top Downwards.
-
 31623030 style essentials 2 financials 5 piece powerpoint presentation diagram infographic slide
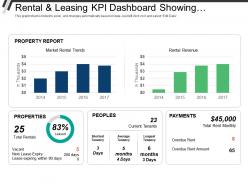
Presenting this set of slides with name - Rental And Leasing Kpi Dashboard Showing Properties People Payments Rental Revenue. This is a five stage process. The stages in this process are Rental And Leasing, Dealing And Leasing, Rental And Engage.
-
 31738902 style division donut 12 piece powerpoint presentation diagram infographic slide
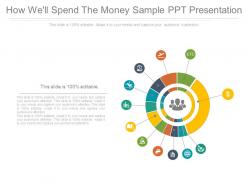
Presenting how well spend the money sample ppt presentation. This is a how well spend the money sample ppt presentation. This is a twelve stage process. The stages in this process are business, marketing, process, analysis, strategy, management.
-
 97073123 style essentials 2 financials 6 piece powerpoint presentation diagram template slide
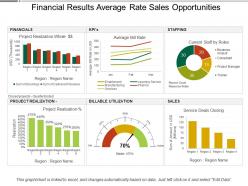
Introducing financial results average rates sales opportunities Presentation template. Pre-designed PowerPoint slide assist you in saving time and effort. Color, text and font can be easily edited as the PPT graphic is completely editable. Adaptable as can be transformed into PDF or JPEG formats. Fast download and easy to share with large set of audience. Presentation diagram is presentable in standard and widescreen display. Innovatively created PPT design familiar with Google slides.
-
 80781080 style essentials 2 financials 4 piece powerpoint presentation diagram template slide
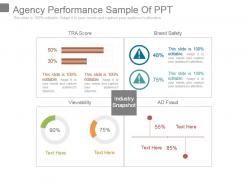
Presenting agency performance sample of ppt. This is a agency performance sample of ppt. This is a four stage process. The stages in this process are tra score, brand safety, viewability, industry snapshot, ad fraud.
-
 67270048 style essentials 2 financials 7 piece powerpoint presentation diagram infographic slide
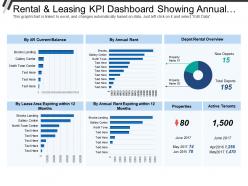
Presenting this set of slides with name - Rental And Leasing Kpi Dashboard Showing Annual Rent Depot Rental Overview. This is a seven stage process. The stages in this process are Rental And Leasing, Dealing And Leasing, Rental And Engage.
-
 45675590 style essentials 2 financials 3 piece powerpoint presentation diagram infographic slide
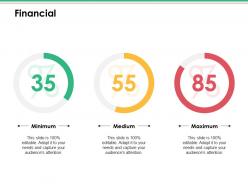
Presenting this set of slides with name - Financial Ppt Infographics Design Ideas. This is a three stage process. The stages in this process are Business, Management, Strategy, Analysis, Financial.
-
 24940980 style division donut 6 piece powerpoint presentation diagram infographic slide
Presenting lead scoring ppt infographic template. This is a lead scoring ppt infographic template. This is a six stage process. The stages in this process are measurable roi on lead generation program, increased conversion rates from qualified lead to opportunity, increased sales productivity and effectiveness, better alignment of marketing and sales efforts, better forecast and pipeline visibility, shortened sales cycle.
-
 77168075 style division donut 6 piece powerpoint presentation diagram infographic slide
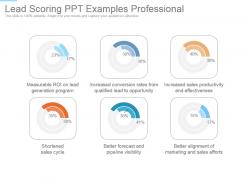
Presenting lead scoring ppt examples professional. This is a lead scoring ppt examples professional. This is a six stage process. The stages in this process are measurable roi on lead generation program, increased conversion rates from qualified lead to opportunity, increased sales productivity and effectiveness, shortened sales.
-
 31218719 style division donut 1 piece powerpoint presentation diagram infographic slide
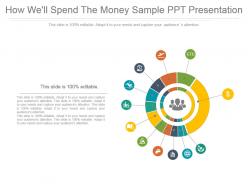
Presenting new method for expenditure management sample ppt presentation. This is a new method for expenditure management sample ppt presentation. This is a one stage process. The stages in this process are business, process, marketing, success, icons, strategy, management.
-
 53879803 style division donut 6 piece powerpoint presentation diagram infographic slide
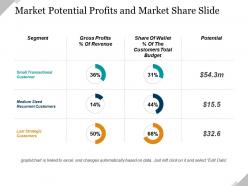
Presenting market potential profits and market share ppt presentation. This is a market potential profits and market share ppt presentation. This is a six stage process. The stages in this process are business, finance, marketing, strategy, success, analysis.
-
 21288193 style essentials 2 financials 2 piece powerpoint presentation diagram infographic slide
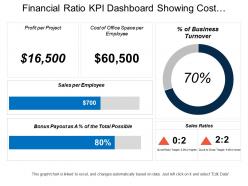
Presenting this set of slides with name - Financial Ratio Kpi Dashboard Showing Cost Of Office Space Per Employee And Sales Per Employee. This is a two stage process. The stages in this process are Accounting Ratio, Financial Statement, Financial Ratio.
-
 86826462 style division donut 2 piece powerpoint presentation diagram infographic slide
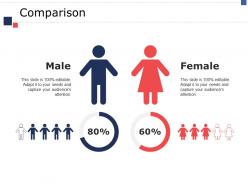
Presenting this set of slides with name - Comparison Ppt Infographics Diagrams. This is a two stage process. The stages in this process are Male, Female, Comparison.
-
 39443197 style division donut 10 piece powerpoint presentation diagram template slide
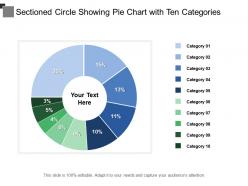
Presenting sectioned circular presentation template. This PowerPoint presentation template is fully customizable and is designed by professionals looking for an impressive visual presentation. The user can edit the objects in the slide like font size and font color without going through any fuss. This presentation slide is 100% compatible with Google Slide and can be saved in JPG or PDF file format easily. Fast download this at a click of the button.
-
 72304757 style essentials 2 financials 6 piece powerpoint presentation diagram infographic slide
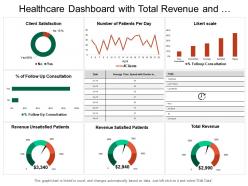
Presenting this set of slides with name - Healthcare Dashboard With Total Revenue And Patients Per Day. This is a six stage process. The stages in this process are Healthcare, Health Improvement, Medical Care.
-
 5707476 style division donut 8 piece powerpoint presentation diagram infographic slide
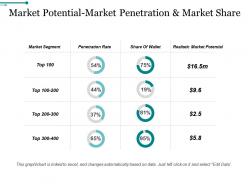
Presenting market potential market penetration and market share ppt images gallery. This is a market potential market penetration and market share ppt images gallery. This is a eight stage process. The stages in this process are market segment, penetration rate, share of wallet, realistic market potential.
-
 85792200 style division donut 3 piece powerpoint presentation diagram infographic slide
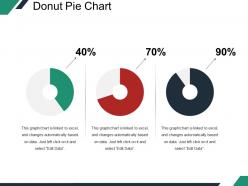
Presenting Donut Pie Chart PPT Background. This PPT presentation is Google Slides compatible hence it is easily accessible. You can download and save this PowerPoint layout in different formats like PDF, PNG, and JPG. This PPT theme is available in both 4:3 and 16:9 aspect ratios. This PowerPoint template is customizable so you can modify the font size, font type, color and shapes as per your requirements.
-
 73798409 style division donut 3 piece powerpoint presentation diagram infographic slide
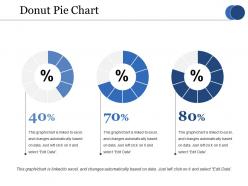
Presenting this set of slides with name - Donut Pie Chart Ppt Portfolio Summary. This is a three stage process. The stages in this process are Percentage, Finance, Donut, Business.
-
 48213725 style layered horizontal 3 piece powerpoint presentation diagram infographic slide
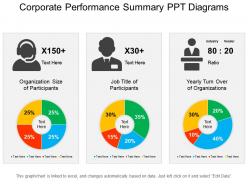
Presenting a PPT template named Corporate Performance Summary PPT Diagram. You can edit the color, style and size of the font. You can replace and rewrite the text as per your requirement. Add or delete the content anywhere in the deck of PPT slides. We at SlideTeam offer you with high-quality visuals and graphics to enhance your presentation. Provide your audience with the needful visual aid by using this template. This PowerPoint slide is compatible with Google Slides. You can export the slide anywhere in any format like JPG or PDF formats.
-
 0414 percentage values donut and column chart powerpoint graph
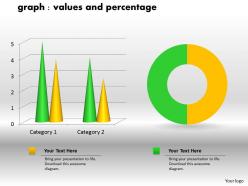
Easy proofing and editing is added on feature of presentation visual. Presentation slide is useful in business marketing, management and recourse disbursement. Basic theme yet it can modified with respect to font, color and layout. Attractive color scheme gives a professional look to PPT layout. Conversion into PDF or JPG formats is very easy and handy. PPT graphic offers font size which can be read from a distance.
-
 6686810 style division donut 7 piece powerpoint presentation diagram infographic slide
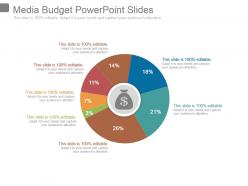
Presenting media budget powerpoint slides. This is a media budget powerpoint slides. This is a seven stage process. The stages in this process are donut, strategy, management, finance, business.
-
 84402050 style division donut 5 piece powerpoint presentation diagram infographic slide
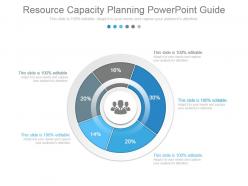
Presenting resource capacity planning powerpoint guide. This is a resource capacity planning powerpoint guide. This is a five stage process. The stages in this process are business, process, marketing, management, strategy, success.
-
 87232752 style division donut 9 piece powerpoint presentation diagram infographic slide
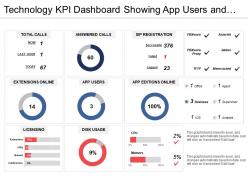
Presenting this set of slides with name - Technology Kpi Dashboard Showing App Users And Disk Usage. This is a nine stage process. The stages in this process are Technology, IT, IOT.
-
 66534082 style essentials 2 financials 3 piece powerpoint presentation diagram template slide
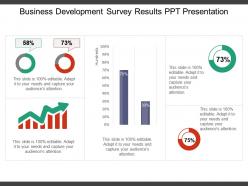
Presenting business development survey results PPT presentation slideshow PPT which is 100% editable. This PPT template easy to customize and enables you to personalize it as per your own criteria. The presentation slide is data driven that is excel linked chart and fully compatible with Google slides, multiple format and software options. In case of any assistance, kindly take instructions from our presentation design services and it is easy to download in a very short span of time. The images, layouts, designs are of high quality and ensures quality in widescreen.
-
 28035032 style essentials 2 financials 4 piece powerpoint presentation diagram infographic slide
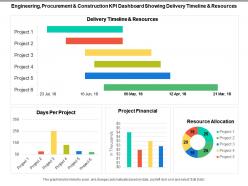
Presenting this set of slides with name - Engineering Procurement And Construction Kpi Dashboard Showing Delivery Timeline And Resources. This is a four stage process. The stages in this process are Engineering, Procurement And Construction, Construction Management, Engineering, Purchasing And Construction .
-
 14441458 style division donut 3 piece powerpoint presentation diagram infographic slide
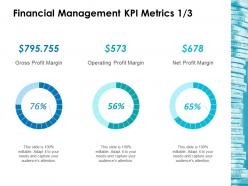
Presenting this set of slides with name - Financial Management Kpi Metrics 1 3 Ppt Layouts Backgrounds. This is a three stage process. The stages in this process are Business, Management, Strategy, Analysis, Marketing.
-
 37524085 style essentials 2 financials 3 piece powerpoint presentation diagram infographic slide
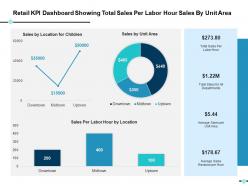
Presenting this set of slides with name - Retail Kpi Dashboard Showing Total Sales Per Labor Hour Sales By Unit Area Ppt Slides Gallery. This is a three stage process. The stages in this process are Business, Management, Strategy, Analysis, Marketing.


