Financial Reviews and Accounting PPT Slides
-
 67270048 style essentials 2 financials 7 piece powerpoint presentation diagram infographic slide
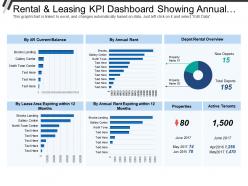
Presenting this set of slides with name - Rental And Leasing Kpi Dashboard Showing Annual Rent Depot Rental Overview. This is a seven stage process. The stages in this process are Rental And Leasing, Dealing And Leasing, Rental And Engage.
-
 39358768 style essentials 2 financials 5 piece powerpoint presentation diagram infographic slide
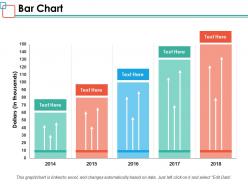
Presenting this set of slides with name - Bar Chart Ppt Powerpoint Presentation Inspiration Images. This is a five stage process. The stages in this process are Business, Management, Strategy, Analysis, Marketing.
-
 9317861 style essentials 2 financials 2 piece powerpoint presentation diagram infographic slide
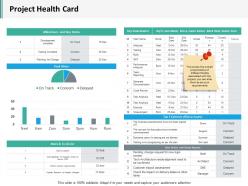
Presenting this set of slides with name - Project Health Card Slide2 Ppt Infographics Structure. This is a two stage process. The stages in this process are Business, Management, Strategy, Analysis, Marketing.
-
 Manual Payroll Management Challenges
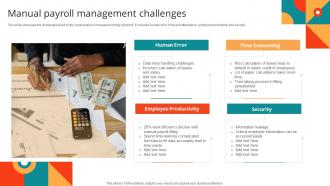
This slide showcase the challenges faced by the organisation in manual recording of payroll. It includes human error, time and attendance, employee productivity and security. Introducing our premium set of slides with Manual Payroll Management Challenges. Ellicudate the one stages and present information using this PPT slide. This is a completely adaptable PowerPoint template design that can be used to interpret topics like Human Error, Time Consuming, Employee Productivity, Security. So download instantly and tailor it with your information.
-
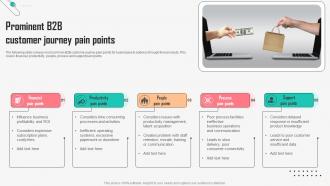 Prominent B2B Customer Journey Pain Points
The following slide conveys most common B2B customer journey pain points for businesses to address through their products. This covers financial, productivity, people, process and support pain points. Introducing our premium set of slides with Prominent B2B Customer Journey Pain Points. Ellicudate the Five stages and present information using this PPT slide. This is a completely adaptable PowerPoint template design that can be used to interpret topics like Financial Pain Points, Productivity Pain Points. So download instantly and tailor it with your information.
-
 19145329 style essentials 2 financials 3 piece powerpoint presentation diagram infographic slide
We are proud to present our hour glass with gold coins clock time management flat powerpoint design. Graphic of hour glass with gold coins and clock has been used to design this power point template diagram. This PPT diagram contains the concept of time management. Use this PPT diagram for business and marketing related presentations.
-
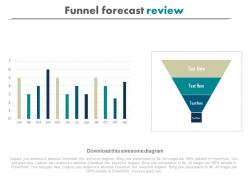 42244890 style essentials 2 financials 1 piece powerpoint presentation diagram infographic slide
Presenting download funnel forecast review powerpoint slides. This Power Point template slide has been crafted with graphic of funnel and bar graph charts. This PPT slide contains the concept of result analysis. Use this PPT slide for business and marketing related presentations.
-
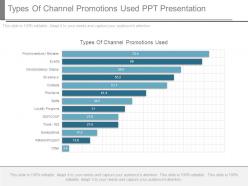 56973478 style essentials 2 financials 13 piece powerpoint presentation diagram infographic slide
Presenting types of channel promotions used ppt presentation. This is a types of channel promotions used ppt presentation. This is a thirteen stage process. The stages in this process are types of channel promotions used, loyalty programs.
-
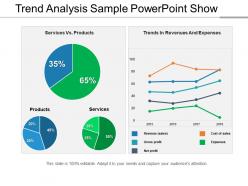 93006645 style essentials 2 financials 4 piece powerpoint presentation diagram infographic slide
Presenting a PowerPoint slide named Trend Analysis Sample PowerPoint Show. Create a compelling presentation with this PPT diagram, which is both professional and editable. Customize colors, choose font styles, and size. You can choose from a wide variety of icons. Resize and scale the images to fit any content. The PPT slide is compatible with Google Slides and can be fetched at once. You can save it as both PDF and JPG format. This PPT slide is data-driven and linked to the Excel sheet.
-
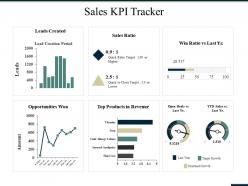 99002480 style essentials 2 financials 6 piece powerpoint presentation diagram infographic slide
Presenting this set of slides with name - Sales Kpi Tracker Ppt Summary Grid. This is a six stage process. The stages in this process are Leads Created, Sales Ratio, Opportunities Won, Products In Revenue, Open Deals Vs.
-
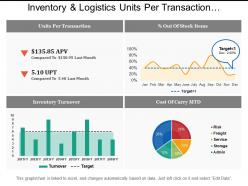 8772479 style essentials 2 financials 4 piece powerpoint presentation diagram infographic slide
Spectacular inventory and logistics units per transaction dashboards PPT template. Top quality and creative PowerPoint slide design. Adjustable presentation graphic as compatible with Google slides. Perfect for sales executives, marketers, business professionals, analysts, strategists, students, teachers, etc. Information on making the changes has been provided for your provision. Download is rapid and can be displayed in widescreen view mode also. 100% editable PPT designs as completely modifiable such as icons, text, colors, etc. Effortlessly convertible into JPEG and PDF file formats.
-
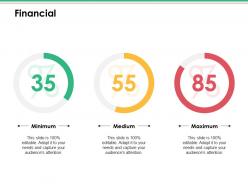 45675590 style essentials 2 financials 3 piece powerpoint presentation diagram infographic slide
Presenting this set of slides with name - Financial Ppt Infographics Design Ideas. This is a three stage process. The stages in this process are Business, Management, Strategy, Analysis, Financial.
-
 59036591 style essentials 1 our team 4 piece powerpoint presentation diagram infographic slide
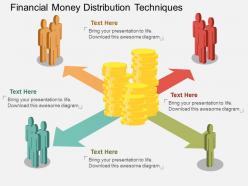
Presenting wp financial money distribution techniques flat powerpoint design. This Power Point template diagram has been crafted with graphic of finance diagram. This PPT diagram contains the concept of financial money distribution techniques. Use this PPT diagram for business and finance related presentations.
-
 48612969 style essentials 2 financials 4 piece powerpoint presentation diagram infographic slide
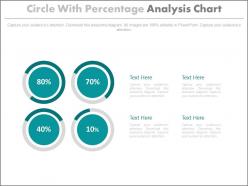
Presenting four circle with percentage analysis chart powerpoint slides. This Power Point template slide has been crafted with graphic of four circle and percentage icons. This PPT slide contains the concept of percentage analysis representation. Use this PPT slide for business and finance related presentations.
-
 67165596 style essentials 2 financials 2 piece powerpoint presentation diagram infographic slide
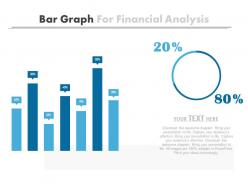
Presenting bar graph for financial analysis powerpoint slides. This Power Point template slide has been crafted with graphic of bar graph. This PPT slide contains the concept of financial data analysis. Use this PPT slide for business and finance related presentations.
-
 88352771 style essentials 1 location 2 piece powerpoint presentation diagram infographic slide
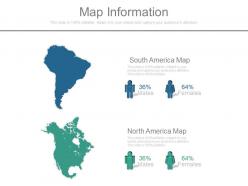
Presenting original map information. This is a map information. This is a two stage process. The stages in this process are south america map, north america map.
-
 15765546 style layered horizontal 3 piece powerpoint presentation diagram infographic slide
Presenting price chart design PowerPoint images which is 100% editable. This PPT slide is easy to customize and enables you to personalize it as per your own criteria. The presentation slide is fully compatible with Google slides, multiple format and software options. In case of any assistance, kindly take instructions from our presentation design services and it is easy to download in a very short span of time. The images, layouts, designs are of high quality and ensures quality in widescreen.
-
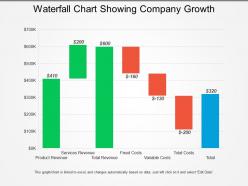 92578159 style essentials 2 financials 7 piece powerpoint presentation diagram infographic slide
Presenting Waterfall Chart showing Company Growth PPT slide. This presentation diagram is fully editable in PowerPoint and adaptable with Google slides. You can customize the font type, font size, colors of the diagram, and background color as per your requirement. Also, you can incorporate your company name and logo in the slide. Replace the dummy content in text placeholders with your presentation content. Fast download at click of a button.
-
 91366990 style essentials 2 financials 3 piece powerpoint presentation diagram infographic slide
Presenting this set of slides with name - Customer Lifetime Value And Total Mrr Sales Dashboards. This is a three stage process. The stages in this process are Sales Dashboard, Sales Kpis, Sales Performance.
-
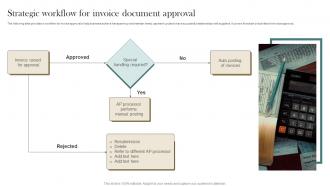 Strategic Workflow For Invoice Document Approval
The following slide provides a workflow for invoice approval to help business achieve transparency and maintain timely payment cycles to have successful relationships with suppliers. It covers flowchart of activities for invoice approval. Presenting our set of slides with Strategic Workflow For Invoice Document Approval. This exhibits information on one stages of the process. This is an easy to edit and innovatively designed PowerPoint template. So download immediately and highlight information on Strategic Workflow, Invoice Document Approval.
-
 Business Transformation Strategies Icon For Digital Payments
Introducing our premium set of slides with Business Transformation Strategies Icon For Digital Payments. Ellicudate the three stages and present information using this PPT slide. This is a completely adaptable PowerPoint template design that can be used to interpret topics like Business Transformation, Strategies Icon, Digital Payments. So download instantly and tailor it with your information.
-
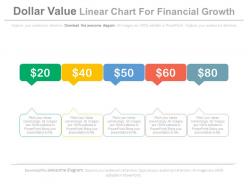 92407063 style essentials 2 financials 5 piece powerpoint presentation diagram infographic slide
Presenting dollar value linear chart for financial growth powerpoint slides. This Power Point template slide has been crafted with graphic of dollar value linear chart icons. This PPT slide contains the concept of financial growth analysis. Use this PPT slide for business and finance related presentations.
-
 24693885 style essentials 2 financials 2 piece powerpoint presentation diagram infographic slide
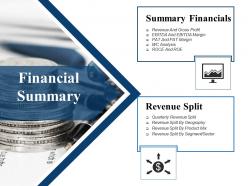
Presenting this set of slides with name - Financial Summary Ppt Images Gallery. This is a two stage process. The stages in this process are Summary Financials, Revenue Split, Marketing, Strategy, Business.
-
 Construction Cost Icon With Architect Holding Project Model
Presenting our set of slides with Construction Cost Icon With Architect Holding Project Model. This exhibits information on three stages of the process. This is an easy to edit and innovatively designed PowerPoint template. So download immediately and highlight information on Construction Cost Icon, Architect Holding Project Model.
-
 68825227 style essentials 2 financials 3 piece powerpoint presentation diagram template slide
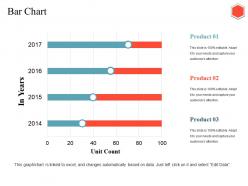
Presenting this set of slides with name - Bar Chart Ppt Inspiration. This is a three stage process. The stages in this process are Bar Chart, Business, Finance, Analysis, Management.
-
 66161814 style division donut 6 piece powerpoint presentation diagram infographic slide
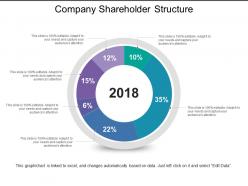
Presenting this set of slides with name - Company Shareholder Structure. This is a six stage process. The stages in this process are Shareholder Structure, Stockholder Structure.
-
 21288193 style essentials 2 financials 2 piece powerpoint presentation diagram infographic slide
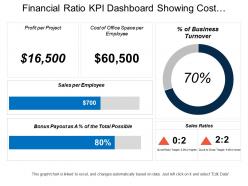
Presenting this set of slides with name - Financial Ratio Kpi Dashboard Showing Cost Of Office Space Per Employee And Sales Per Employee. This is a two stage process. The stages in this process are Accounting Ratio, Financial Statement, Financial Ratio.
-
 58654182 style essentials 2 financials 3 piece powerpoint presentation diagram infographic slide
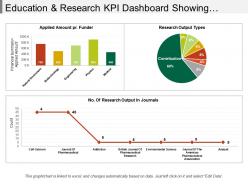
Presenting education and research KPI dashboard snapshot showing research outputs and amount PPT slide. The research data metric presentation slide designed by professional team of SlideTeam. The education and research report PPT slide is 100% customizable in PowerPoint. The research amount KPI dashboard slide is also compatible with Google Slide so a user can share this slide with others. A user can make changes in the font size, font type, color as well as dimensions of the research key measure PPT template as per the requirement. You may edit the value in the research key measure PPT template as the slide gets linked with the Excel sheet.
-
 85594769 style essentials 2 financials 2 piece powerpoint presentation diagram infographic slide
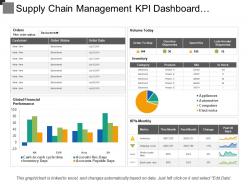
Presenting this set of slides with name - Supply Chain Management Kpi Dashboard Showing Order Status Volume And Inventory. This is a two stage process. The stages in this process are Demand Forecasting, Predicting Future Demand, Supply Chain Management.
-
 Accounting And Finance Budget Process Icon
Presenting our set of slides with Accounting And Finance Budget Process Icon. This exhibits information on three stages of the process. This is an easy to edit and innovatively designed PowerPoint template. So download immediately and highlight information on Accounting And Finance, Budget Process Icon.
-
 15877560 style concepts 1 opportunity 2 piece powerpoint presentation diagram infographic slide
Presenting bl magnifier with dollar search financial analysis flat powerpoint design. This Power Point template diagram has been crafted with graphic of magnifier and dollar .This PPT diagram contains the concept of financial analysis. Use this PPT diagram for business and finance related presentations.
-
 36869578 style essentials 2 financials 3 piece powerpoint presentation diagram infographic slide
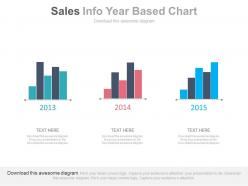
Presenting three staged sales info year based chart powerpoint slides. This Power Point template diagram with graphic of three staged year info chart diagram. This PPT diagram contains the concept of year based sales planning. Use this PPT diagram for business and sales related presentations.
-
 39026421 style circular semi 5 piece powerpoint presentation diagram template slide
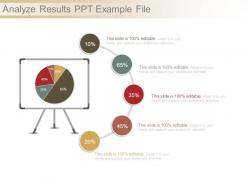
Presenting analyze results ppt example file. This is a analyze results ppt example file. This is five stage process. The stages in this process are business, pie chart, finance, strategy, success, analysis.
-
 59224367 style essentials 2 financials 10 piece powerpoint presentation diagram infographic slide
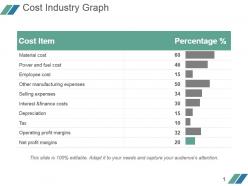
Presenting cost industry graph powerpoint slide background image. This is a cost industry graph powerpoint slide background image. This is a ten stage process. The stages in this process are cost item, material cost, power and fuel cost, employee cost, other manufacturing expenses, selling expenses, interest and finance costs, depreciation, tax, operating profit margins, net profit margins, percentage.
-
 74657362 style essentials 2 financials 4 piece powerpoint presentation diagram template slide
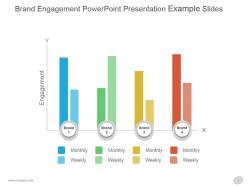
Presenting brand engagement powerpoint presentation example slides. This is a brand engagement powerpoint presentation example slides. This is a four stage process. The stages in this process are engagement, monthly, weekly, brand.
-
 53879803 style division donut 6 piece powerpoint presentation diagram infographic slide
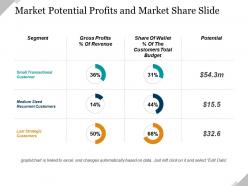
Presenting market potential profits and market share ppt presentation. This is a market potential profits and market share ppt presentation. This is a six stage process. The stages in this process are business, finance, marketing, strategy, success, analysis.
-
 17551351 style essentials 2 financials 5 piece powerpoint presentation diagram infographic slide
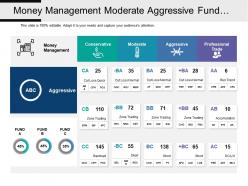
Presenting this set of slides with name - Money Management Moderate Aggressive Fund Market Analytics Table With Icons. This is a five stage process. The stages in this process are Marketing Analytics, Marketing Performance, Marketing Discovery.
-
 75124089 style concepts 1 growth 4 piece powerpoint presentation diagram infographic slide
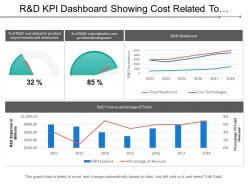
Presenting this set of slides with name - R And D Kpi Dashboard Showing Cost Related To Product Improvements And Extensions. This is a four stage process. The stages in this process are R And D, Research And Development, Research And Technological Development.
-
 Project Cost Expense Report Icon
Presenting our set of slides with Project Cost Expense Report Icon. This exhibits information on three stages of the process. This is an easy to edit and innovatively designed PowerPoint template. So download immediately and highlight information on Project Cost, Expense Report Icon.
-
 20571553 style concepts 1 growth 6 piece powerpoint presentation diagram infographic slide
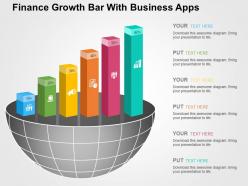
Simplified and not cluttered slides with maximum visual appeal. Clean and clear PPT presentation with high resolution content. Easy to customize presentation model for inclusion and exclusion of data as per individual choice. Fruitful pre designed PowerPoint model for Students, teachers, financial analysts and other business professionals. Personalize the slides with your company name and logo. Easy to download and save in format of your choice. Compatible with multiple software options.
-
 35955327 style essentials 2 financials 5 piece powerpoint presentation diagram infographic slide
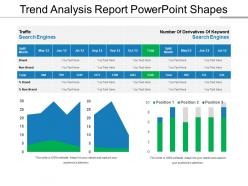
Presenting Trend Analysis Report PowerPoint Shapes. Customize the slide as per your wants. You are free to change anything in the slide. Modify the colors, background, font type, and font size. It can be transformed and saved in various formats like JPG, PNG, PDF, and JPEG. The slide goes well with the Google Slides and major Microsoft versions. It can be viewed on standard screen size and widescreen size as well.
-
 4593973 style essentials 2 financials 5 piece powerpoint presentation diagram infographic slide
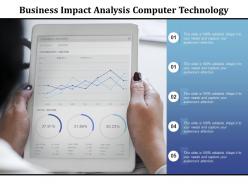
Presenting this set of slides with name - Business Impact Analysis Computer Technology. This is a five stage process. The stages in this process are Business Continuity Planning, Business Impact Analysis.
-
 57130285 style essentials 2 financials 3 piece powerpoint presentation diagram infographic slide
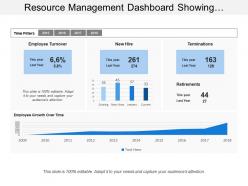
Presenting this set of slides with name - Resource Management Dashboard Showing Employee Turnover And Terminations. This is a three stage process. The stages in this process are Resource Management, Wealth Management, Capital Management.
-
 2585523 style essentials 2 financials 3 piece powerpoint presentation diagram infographic slide
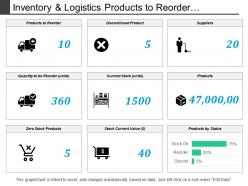
Presenting this set of slides with name - Inventory And Logistics Products To Reorder Dashboards. This is a three stage process. The stages in this process are Inventory And Logistics, Inventory Management, Warehousing And Inventory Management.
-
 81371379 style essentials 2 financials 3 piece powerpoint presentation diagram infographic slide
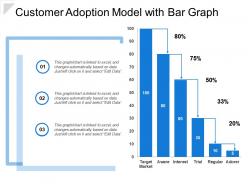
Presenting this set of slides with name - Customer Adoption Model With Bar Graph. This is a three stages process. The stages in this process are Customer Adoption, Customer Service, Customer Success.
-
 5 Stages Of GRC Maturity Model
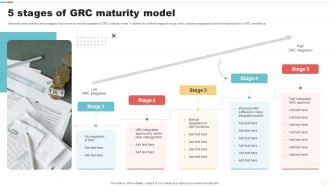
Mentioned slide outlines various stages of governance, risk and compliance GRC maturity model. It defines the different stages through which company progress to achieve the desired level of GRC excellence. Introducing our premium set of slides with 5 Stages Of GRC Maturity Model. Ellicudate the five stages and present information using this PPT slide. This is a completely adaptable PowerPoint template design that can be used to interpret topics like Low GRC Integration, High GRC Integration. So download instantly and tailor it with your information.
-
 19803467 style essentials 2 financials 3 piece powerpoint presentation diagram infographic slide
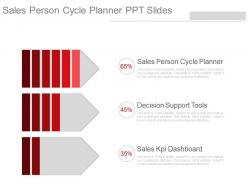
Use of high-level of picture quality images and icons. Provided instructions to edit and modify the slide design. Easy to download and save. Instant addition of your company name or brand logo in the background. Edit the size, style and orientation of the slide icons. Beneficial for the sales and marketing professional s or the business managers The stages in this process are sales person cycle planner, decision support tools, sales kpi dashboard.
-
 65465252 style essentials 2 financials 6 piece powerpoint presentation diagram infographic slide
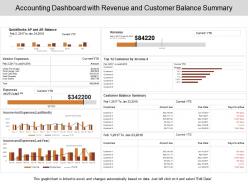
Pre-designed accounting dashboard with revenue and customer balance summary PPT template. High-resolution PowerPoint presentation backgrounds for better clarity of the information displayed. Offers wide variety of options and colors to alter the appearance. Allows adding of enterprise personal details such as brand name, logo and much more. Enough space available to enter text and its related points in the PPT slide. This slide is available in both Standard and Widescreen slide size. Compatible with multiple formats like JPEG, PDF and Google slides.
-
 Cost price icon with tag and dollar sign
Presenting this set of slides with name Cost Price Icon With Tag And Dollar Sign. This is a three stage process. The stages in this process are Cost Price Icon With Tag And Dollar Sign. This is a completely editable PowerPoint presentation and is available for immediate download. Download now and impress your audience.
-
 Payment card icon with pos device for digital transaction
Presenting this set of slides with name Payment Card Icon With POS Device For Digital Transaction. This is a three stage process. The stages in this process are Payment Card Icon With POS Device For Digital Transaction. This is a completely editable PowerPoint presentation and is available for immediate download. Download now and impress your audience.
-
 Growth Opportunities For Company Future Sales Icon
Introducing our premium set of slides with Growth Opportunities For Company Future Sales Icon. Elucidate the three stages and present information using this PPT slide. This is a completely adaptable PowerPoint template design that can be used to interpret topics like Growth Opportunities, Company Future Sales, Icon. So download instantly and tailor it with your information.
-
 55974439 style concepts 1 growth 3 piece powerpoint presentation diagram infographic slide
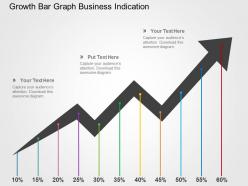
We are proud to present our growth bar graph business indication flat powerpoint design. Graphic of growth bar graph has been used to craft this power point template diagram. This PPT diagram contains the concept of business growth indication and search .Use this PPT diagram for global business and finance related presentations.
-
 35369604 style essentials 2 financials 3 piece powerpoint presentation diagram infographic slide
Presenting one partition aware routing powerpoint templates microsoft. This is a partition aware routing powerpoint templates microsoft. This is a three stage process. The stages in this process are additional routing, partition aware routing, voldemort cluster.
-
 88314993 style essentials 2 financials 2 piece powerpoint presentation diagram infographic slide
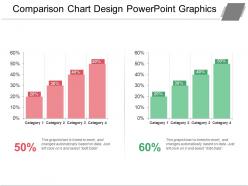
Presenting comparison chart design PowerPoint graphics PPT slide. The bar chart diagram slide specially designed by SlideTeam for professionals for sharing the required strategies for project or process. The chart design slide is 100% editable in PowerPoint and gets synced with Google Slides. A user can easily edit the font type, font size, color & size of bar graph and aspect ratios of this template, without affecting template's quality. The text placeholder is editable and you can edit as per your preference.
-
 74983409 style essentials 2 financials 3 piece powerpoint presentation diagram infographic slide
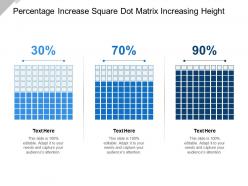
Presenting this set of slides with name - Percentage Increase Square Dot Matrix Increasing Height. This is a three stage process. The stages in this process are Percentage Increase, Net Operating Income, Growth.
-
 98165138 style essentials 2 financials 4 piece powerpoint presentation diagram infographic slide
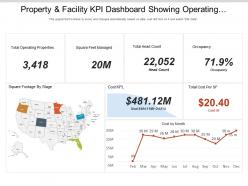
Showing, property and facility KPI dashboard showing operating properties headcount and occupancy PowerPoint Presentation Slide. This Presentation has been designed under the keen supervision of professionals and is fully editable. You can have the feasibility to change the font size, font type, colors, and even the background. This Template is obedient with Google Slide and can be saved in JPG or PDF format without any fuss created during the saving process. Fast download at the click of the button provided below.
-
 41786823 style essentials 2 financials 3 piece powerpoint presentation diagram infographic slide
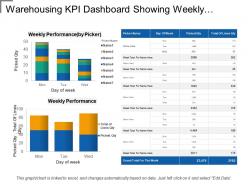
The best part of this PPT design is the use of excel linked editable charts. You can change your business related information, statistics and figures in excel sheet and changes will reflect in PPT design. PPT design is 100% editable; you can change the design elements according to your business needs. You can download and save this design as JPEG or PDF formats. Design is fully supported on Google Slides and MS PowerPoint software.
-
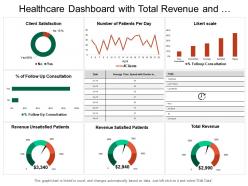 72304757 style essentials 2 financials 6 piece powerpoint presentation diagram infographic slide
Presenting this set of slides with name - Healthcare Dashboard With Total Revenue And Patients Per Day. This is a six stage process. The stages in this process are Healthcare, Health Improvement, Medical Care.
-
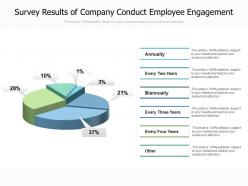 Survey results of company conduct employee engagement
Presenting this set of slides with name Survey Results Of Company Conduct Employee Engagement. This is a six stage process. The stages in this process are Survey Results Of Company Conduct Employee Engagement. This is a completely editable PowerPoint presentation and is available for immediate download. Download now and impress your audience.
-
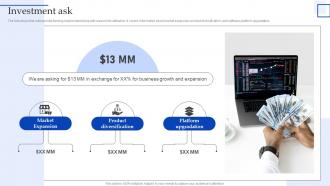 Investment Ask Sample Pitch Deck For Asset Management
The following slide outlines total funding requirement along with reasons for utilization. It covers information about market expansion, product diversification, and software platform upgradation. Introducing Investment Ask Sample Pitch Deck For Asset Management to increase your presentation threshold. Encompassed with four stages, this template is a great option to educate and entice your audience. Dispence information on Market Expansion, Product Diversification, Platform Upgradation, using this template. Grab it now to reap its full benefits.


