Financial Reviews and Accounting PPT Slides
-
 94523666 style concepts 1 growth 4 piece powerpoint presentation diagram template slide
Adjustable PPT slides as well-matched with Google slides. Completely modifiable PowerPoint design. Presentation design can be shared in standard and widescreen view. Fast download and can be easily transformed into JPEG and PDF document. Similar designs available with different nodes and stages. Alternate to add or remove logo, icon and image as required. Useful for Business professionals, executives and leaders.
-
 53389357 style concepts 1 opportunity 2 piece powerpoint presentation diagram infographic slide
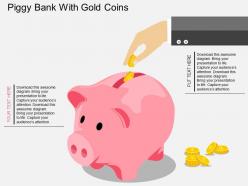
Presenting gm piggy bank with gold coins flat powerpoint design. Presenting gm piggy bank with gold coins flat powerpoint design. This Power Point template diagram has been crafted with graphic of piggy bank and gold coins. This PPT diagram contains the concept of financial planning and saving techniques representation. This PPT diagram can be used for business and finance related presentations.
-
 90381149 style essentials 2 financials 5 piece powerpoint presentation diagram infographic slide
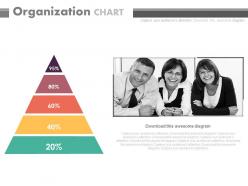
Presenting triangle with percentage organization chart powerpoint slides. This Power Point template slide has been crafted with graphic of triangle and percentage..This PPT slide contains the concept of financial data analysis. Use this PPT slide for business and finance related presentations.
-
 41676910 style essentials 2 financials 6 piece powerpoint presentation diagram infographic slide
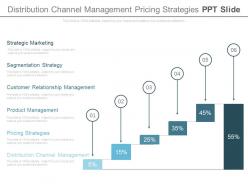
Presenting distribution channel management pricing strategies ppt slide. This is a distribution channel management pricing strategies ppt slide. This is a six stage process. The stages in this process are management, finance.
-
 24860000 style essentials 2 financials 4 piece powerpoint presentation diagram infographic slide
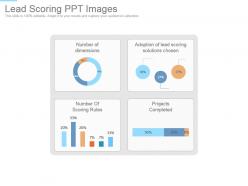
Presenting lead scoring ppt images. This is a lead scoring ppt images. This is a four stage process. The stages in this process are adoption of lead scoring solutions chosen, projects completed, number of scoring rules, number of dimensions.
-
 33336045 style essentials 2 financials 3 piece powerpoint presentation diagram infographic slide
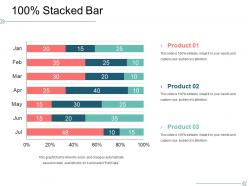
Presenting this set of slides with name - Stacked Bar Powerpoint Slide Presentation Guidelines Template 1. This is a three stage process. The stages in this process are Business, Marketing, Strategy, Percentage, Graph.
-
 58464769 style variety 2 currency 1 piece powerpoint presentation diagram infographic slide
Presenting this set of slides with name - Coin Icon Showing Pile Of Coins With Dollar Currency Sign. This is a one stage process. The stages in this process are Coin Icon, Penny Icon, Stack Icon.
-
 14188912 style essentials 2 financials 3 piece powerpoint presentation diagram infographic slide
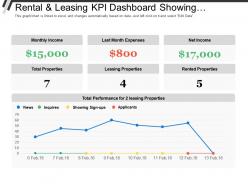
Presenting this set of slides with name - Rental And Leasing Kpi Dashboard Showing Monthly Income Total Properties Net Income. This is a three stage process. The stages in this process are Rental And Leasing, Dealing And Leasing, Rental And Engage.
-
 89173791 style essentials 2 financials 4 piece powerpoint presentation diagram infographic slide
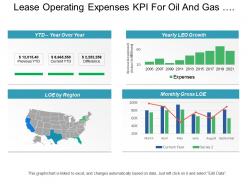
Presenting this set of slides with name - Lease Operating Expenses Kpi For Oil And Gas Industry Kpi Dashboard. This is a four stage process. The stages in this process are Mining, Oil And Gas Extraction, Refinery, Natural Gas.
-
 91774238 style essentials 2 financials 4 piece powerpoint presentation diagram infographic slide
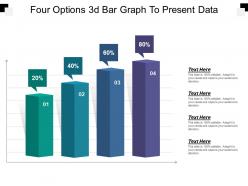
Presenting this set of slides with name - Four Options 3d Bar Graph To Present Data. This is a four stage process. The stages in this process are Paint Brush, Art, Coloring.
-
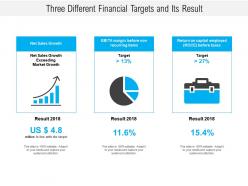 Three different financial targets and its result
Presenting this set of slides with name Three Different Financial Targets And Its Result . This is a three stage process. The stages in this process are Financial Target, Financial Target Objectives, Financial Targets Sales. This is a completely editable PowerPoint presentation and is available for immediate download. Download now and impress your audience.
-
 Financial icons of debit or credit card
Presenting this set of slides with name Financial Icons Of Debit Or Credit Card. This is a one stage process. The stages in this process are Financial Icons, Debit, Credit Card. This is a completely editable PowerPoint presentation and is available for immediate download. Download now and impress your audience.
-
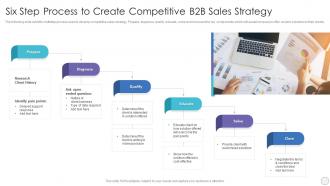 Six Step Process To Create Competitive B2B Sales Strategy
The following slide exhibits multistep process used to develop competitive sales strategy. Prepare, diagnose, qualify, educate, solve and close are the key components which will assist company to offer custom solutions to their clients. Introducing our premium set of slides with Six Step Process To Create Competitive B2B Sales Strategy. Ellicudate the six stages and present information using this PPT slide. This is a completely adaptable PowerPoint template design that can be used to interpret topics like Research, Client History, Qualify, Educate, Solve, Diagnose, Prepare. So download instantly and tailor it with your information.
-
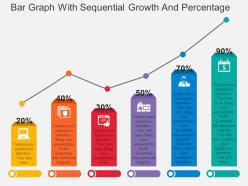 55756447 style concepts 1 growth 6 piece powerpoint presentation diagram template slide
Presenting ppt bar graph with sequential growth and percentage flat powerpoint design. This Power Point template diagram has been crafted with graphic of bar graph and percentage icons. This PPT diagram contains the concept of sequential growth and financial planning. Use this PPT diagram for business and finance related presentations.
-
 35369147 style division pie 4 piece powerpoint presentation diagram infographic slide
They will have an eye-opening impact on the audience by their astounding looks. They can be converted into different formats. They are result and technology oriented. They can be customised by changing the size and shape of icons and also by adding logos and images. They are compatible with google. The stages in this process are e vision, technology drivers, finance, marketing.
-
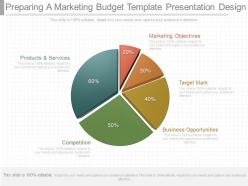 18150264 style division pie 5 piece powerpoint presentation diagram infographic slide
Presenting one preparing a marketing budget template presentation design. This is a preparing a marketing budget template presentation design. This is a five stage process. The stages in this process are marketing objectives, target mark, business opportunities, competition, products and services.
-
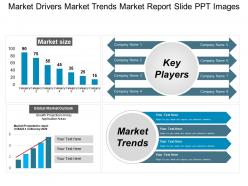 41352436 style essentials 2 financials 4 piece powerpoint presentation diagram infographic slide
Presenting market drivers market trends market report slide PPT images which is fully editable, data driven i.e. excel linked and fast to download. The presenter can customize and personalize this PPT slide it to meet his / her own specifications. This presentation has been designed by plethora of professional expertise. This PowerPoint shape is fully compatible with Google Slides, multiple software and format options. This slideshow can be saved as JPG and / or in PDF. For your kind assistance, editing instructions are also provided. Business analysts, business and sales managers and entrepreneurs picks this PPT.
-
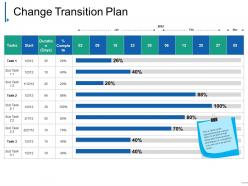 16228225 style essentials 2 financials 9 piece powerpoint presentation diagram infographic slide
Presenting change transition plan powerpoint slide themes. This is a change transition plan powerpoint slide themes. This is a nine stage process. The stages in this process are task, sub task, complete, duration, percentage.
-
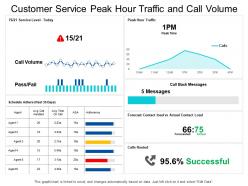 56223243 style essentials 2 financials 4 piece powerpoint presentation diagram infographic slide
Showcasing customer service peak hour traffic and call volume dashboard PowerPoint template slide. This template slide is completely flexible with Google Slide. You can alter the hues, text style, font size of the slide data as per need. The slide is quick to download and can be saved in PDF, and JPEG formats. For guidance, additional educational slides are provided. Best quality graphics are utilized. The quality of the slide graphics does not blur when displayed on a broad screen. Dummy data can be added with other valuable content. You can personalize the slide by adding your organization name, and signature.
-
 88346689 style essentials 2 financials 8 piece powerpoint presentation diagram infographic slide
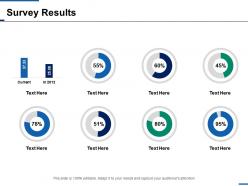
Presenting this set of slides with name - Survey Results Finance Ppt Inspiration Background Designs. This is a eight stage process. The stages in this process are Finance, Analysis, Business, Investment, Marketing.
-
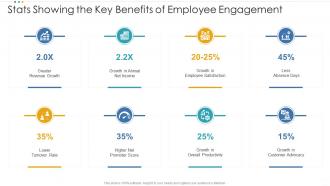 Stats showing the key benefits of employee engagement
Introducing our premium set of slides with Stats Showing The Key Benefits Of Employee Engagement. Ellicudate the eight stages and present information using this PPT slide. This is a completely adaptable PowerPoint template design that can be used to interpret topics like Greater Revenue Growth, Growth In Annual Net Income, Lower Turnover Rate. So download instantly and tailor it with your information.
-
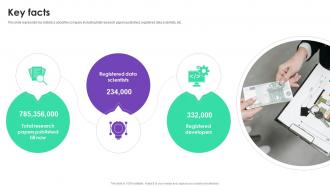 Key Facts Bytez Investor Funding Elevator Pitch Deck
This slide represents key statistics about the company including total research papers published, registered data scientists, etc. Increase audience engagement and knowledge by dispensing information using Key Facts Bytez Investor Funding Elevator Pitch Deck This template helps you present information on Three stages. You can also present information on Total Research, Registered Data Scientists, Registered Developers using this PPT design. This layout is completely editable so personaize it now to meet your audiences expectations.
-
 96323215 style essentials 2 financials 1 piece powerpoint presentation diagram infographic slide
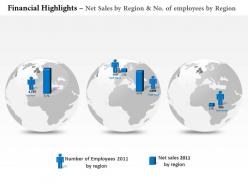
Compatibility across various software versions available online and offline. Professionally equipped and articulated set of visuals and information. Wide screen projection does not affect the output adversely. Easy to edit and customize PPT graphics. Precise and easy to comprehend information on PPT sample. Increase the level of personalization with your company logo and name. Compatible with all software and can be saved in any format i.e. jpeg or pdf.
-
 31493395 style concepts 1 growth 4 piece powerpoint presentation diagram infographic slide
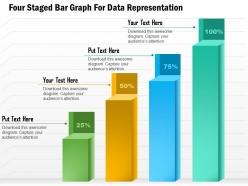
We are proud to present our 1114 four staged bar graph for data representation presentation template. Four staged bar graph has been used to craft this power point template. This Power Point template has been designed to show the concept of data representation. Use this PPT for your business and finance related presentations.
-
 5048350 style essentials 2 financials 5 piece powerpoint presentation diagram infographic slide
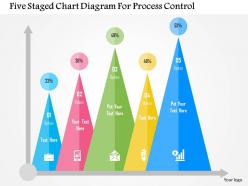
We are proud to present our five staged chart diagram for process control flat powerpoint design. Five staged chart has been used to craft this power point template diagram. This PPT diagram contains the concept of process control. Use this diagram PPT for business and finance related presentations.
-
 59625339 style essentials 1 agenda 1 piece powerpoint presentation diagram template slide
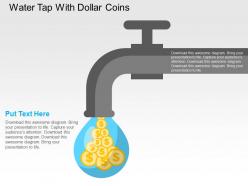
We are proud to present our water tap with dollar coins flat powerpoint design. Graphic of water tap and dollar coins has been used to craft this power point template diagram. This PPT diagram contains the concept of money flow for financial planning. Use this PPT diagram for business and finance related presentations.
-
 61245866 style essentials 2 financials 1 piece powerpoint presentation diagram infographic slide
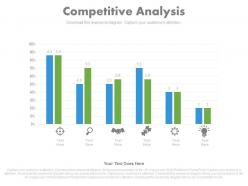
Presenting view competitive data analysis to identify opportunities and threats powerpoint slides. This Power Point template slide has been crafted with graphic of data bar graph and pie charts icons. This PPT slide contains the concept of competitive data analysis and identity opportunities representation. Use this PPT slide for business and marketing related presentations.
-
 68775635 style concepts 1 growth 5 piece powerpoint presentation diagram infographic slide
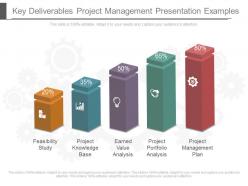
Presenting key deliverables project management presentation examples. This is a key deliverables project management presentation examples. This is a five stage process. The stages in this process are feasibility study, project knowledge base, earned value analysis, project portfolio analysis, project management plan.
-
 40095180 style division pie 3 piece powerpoint presentation diagram infographic slide
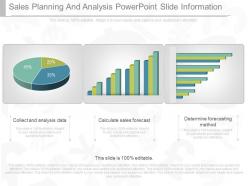
Presenting custom sales planning and analysis powerpoint slide information. This is a sales planning and analysis powerpoint slide information. This is a three stage process. The stages in this process are collect and analysis data, calculate sales forecast, determine forecasting method.
-
 70398468 style essentials 2 financials 6 piece powerpoint presentation diagram infographic slide
Presenting this set of slides with name - Procurement Suppliers Defect Rate And Type Dashboard. This is a six stage process. The stages in this process are Purchase, Procurement, Buy.
-
 57270516 style essentials 2 financials 5 piece powerpoint presentation diagram infographic slide
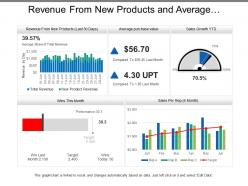
Presenting this set of slides with name - Revenue From New Products And Average Purchase Value Sales Dashboards. This is a five stage process. The stages in this process are Sales Dashboard, Sales Kpis, Sales Performance.
-
 68785051 style essentials 2 financials 6 piece powerpoint presentation diagram infographic slide
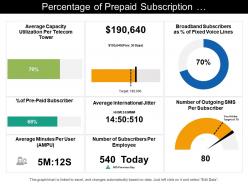
Presenting this set of slides with name - Percentage Of Prepaid Subscription Telecommunications Dashboard. High resolution presentation slide as pixels never break. Wide screen projection does not affect the output adversely. Easy to edit and customize colorful PPT design. Easy share information with this PowerPoint template. Increase the level of personalization with your company logo and name. Compatible with all software and can be saved in any format JPG and PDF. Presentation diagram can be downloaded within few seconds and can be saved easily.
-
 75805140 style essentials 2 financials 5 piece powerpoint presentation diagram infographic slide
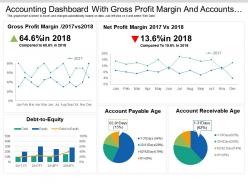
Offering accounting dashboard with gross profit margin and account payable PPT slideshow. Makes the information clear in the mind of the audience. Editable visuals, colors and charts. Easy to edit and customize as per your needs. Beneficial for industry professionals, technologists, managers, executives, researchers, sales people, etc. Flexible presentation designs can be presented in standard and widescreen view. Has a futuristic and realistic approach. Easy to download and save. Highly beneficial PowerPoint Slide for highlighting financial data.
-
 29780124 style essentials 2 financials 4 piece powerpoint presentation diagram infographic slide
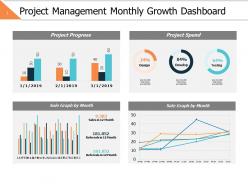
Presenting this set of slides with name - Project Management Monthly Growth Dashboard Slide2 Ppt Powerpoint Presentation File Outfit. This is a four stage process. The stages in this process are Business, Management, Strategy, Analysis, Finance.
-
 62835532 style essentials 2 financials 3 piece powerpoint presentation diagram infographic slide
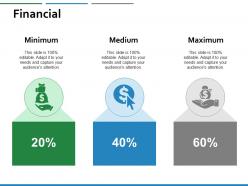
Presenting this set of slides with name - Financial Management Ppt Powerpoint Presentation Inspiration Outline. This is a three stages process. The stages in this process are Financial, Minimum, Maximum, Marketing, Strategy.
-
 Cost Of Business Digital Transformation Icon
Presenting our set of slides with Cost Of Business Digital Transformation Icon. This exhibits information on three stages of the process. This is an easy to edit and innovatively designed PowerPoint template. So download immediately and highlight information on Cost Of Business, Digital Transformation.
-
 Financial Project Actual Cost Vs Budget Icon
Presenting our set of slides with name Financial Project Actual Cost Vs Budget Icon. This exhibits information on three stages of the process. This is an easy to edit and innovatively designed PowerPoint template. So download immediately and highlight information on Financial Project, Actual Cost Vs Budget Icon.
-
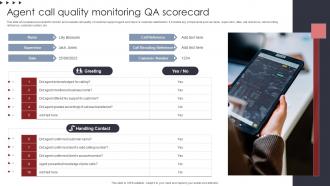 Agent Call Quality Monitoring QA Scorecard Ppt File Professional
This slide showcases a scorecard to monitor and evaluate call quality of customer support agent and improve customer satisfaction. It includes key components such as name, supervisor, date, call reference, call recording reference, customer number, etc. Introducing Agent Call Quality Monitoring QA Scorecard Ppt File Professional. to increase your presentation threshold. Encompassed withone stages, this template is a great option to educate and entice your audience. Dispence information on Greeting, Handling Contact, Call Recoding Reference, using this template. Grab it now to reap its full benefits.
-
 Tips To Gain High Returns From Yield Farming Understanding Role Of Decentralized BCT SS
This slide covers best practices for users to increase returns from yield farming. It includes tips covering researching the platform and liquidity pools, starting with a small investment to minimize losses, diversifying yield farming portfolio, considering vulnerabilities, keeping track of gas fees, understanding rewards yield farming, etc. Increase audience engagement and knowledge by dispensing information using Tips To Gain High Returns From Yield Farming Understanding Role Of Decentralized BCT SS This template helps you present information on six stages. You can also present information on Potential Losses, Regulatory Risks, Potentially Increase using this PPT design. This layout is completely editable so personaize it now to meet your audiences expectations.
-
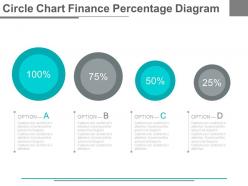 45505562 style essentials 2 financials 4 piece powerpoint presentation diagram infographic slide
Presentation slide representing circle charts with finance percentages. Useful combination of charts and percentages. Compatible with number of software options. Colors, text and fonts can be easily changed as the PPT slide is completely editable. Personalize the presentation with individual company name and logo. Available in both Standard and Widescreen slide size. Easy and quick downloading process. Flexible option for conversion in PDF or JPG formats. Can use with Google slides.
-
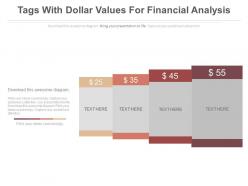 44470604 style essentials 2 financials 4 piece powerpoint presentation diagram infographic slide
Presenting four tags with dollar values for financial analysis powerpoint slides. This is a four tags with dollar values for financial analysis powerpoint slides. This is a four stage process. The stages in this process are financials.
-
 14028626 style essentials 2 financials 3 piece powerpoint presentation diagram infographic slide
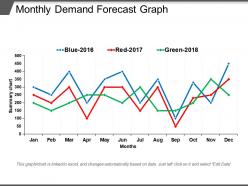
Presenting Monthly Demand Forecast Graph PPT Slides. Make changes in this slide as per your needs. You are free to modify the colors, font type, font style, and background of the slide. Convert and save it in JPG, PNG, JPEG, and PDF file formats. It is made up of high-resolution graphics that do not infer the quality when viewed on widescreen. It can also be presented on a standard screen. It is compatible with Google Slides and the major Microsoft versions.
-
 7278302 style essentials 2 financials 2 piece powerpoint presentation diagram infographic slide
Presenting this set of slides with name - Business Highlights With Magnifying Glass. This is a two stage process. The stages in this process are Highlights, High Point, High Spot.
-
 3744669 style division donut 4 piece powerpoint presentation diagram infographic slide
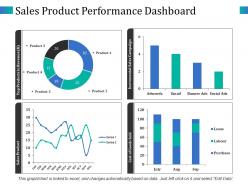
Highlighting sales product performance dashboard top products in revenue PowerPoint slide. Easy and convenient downloading by following simple steps. No concession with the quality, once opened on wide screen. Modify and personalize the presentation by including the company name and logo. Guidance for executing the changes has been provided for assistance. Useful for sales leaders, marketers, business professionals, analysts, strategists, students, teachers, etc. Compatible with Microsoft office software and the Google Slides. Available to be saved in jpg or pdf format.
-
 37536882 style essentials 2 financials 3 piece powerpoint presentation diagram infographic slide
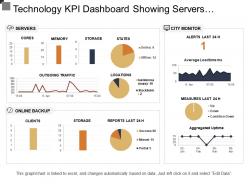
Sharing technology KPI dashboard server’s online backup presentation template.PPT design is adjustable with Google slides. Quick to download and can be shared into JPG and PDF format. Fully amendable as color, text and font as elements can be modified. Sharing can be possible on both standard and widescreen. Matching designs are available with different nodes and stages. Ready to use PowerPoint slide are compatible with Google slides and can be merged easily.
-
 96015738 style essentials 2 financials 3 piece powerpoint presentation diagram infographic slide
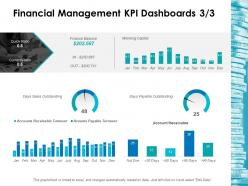
Presenting this set of slides with name - Financial Management Kpi Dashboards 3 3 Ppt Layouts Background Images. This is a three stage process. The stages in this process are Business, Management, Strategy, Analysis, Marketing.
-
 Time value of money icon with dollar
Presenting this set of slides with name Time Value Of Money Icon With Dollar. This is a three stage process. The stages in this process are Time Value Of Money Icon With Dollar. This is a completely editable PowerPoint presentation and is available for immediate download. Download now and impress your audience.
-
 Solutions Network Load Balancers Provide Ppt Infographics Guide
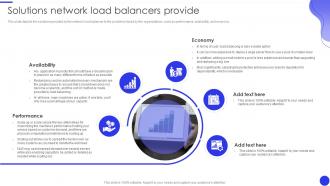
This slide depicts the solutions provided by the network load balancer to the problems faced by the organizations, such as performance, availability, and economy. Increase audience engagement and knowledge by dispensing information using Solutions Network Load Balancers Provide Ppt Infographics Guide. This template helps you present information on five stages. You can also present information on Economy, Availability, Performance using this PPT design. This layout is completely editable so personaize it now to meet your audiences expectations.
-
 Financial Alibaba Investor Funding Elevator Pitch Deck
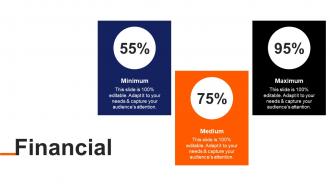
Introducing Financial Alibaba Investor Funding Elevator Pitch Deck to increase your presentation threshold. Encompassed with three stages, this template is a great option to educate and entice your audience. Dispence information on Minimum, Medium, Maximum, using this template. Grab it now to reap its full benefits.
-
 51502578 style essentials 2 financials 5 piece powerpoint presentation diagram infographic slide
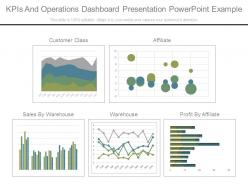
Presenting kpi tracking ppt diagram powerpoint graphics. This is a kpi tracking ppt diagram powerpoint graphics. This is a five stage process. The stages in this process are customer class, affiliate, sales by warehouse, warehouse, profit by affiliate.
-
 69118767 style essentials 2 financials 5 piece powerpoint presentation diagram infographic slide
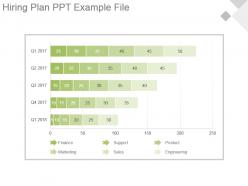
Presenting hiring plan ppt example file. Presenting hiring plan ppt example file. Presenting hiring plan ppt example file. This is a hiring plan ppt example file. This is five stage process. The stages in this process are finance, support, product, marketing, sales, engineering.
-
 53096845 style essentials 2 financials 9 piece powerpoint presentation diagram infographic slide
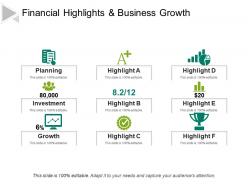
We present to you our PowerPoint template on financial highlights and business growth. Our presentation has high resolution graphics and you can edit these to precisely match your style. All the images are 100 % editable in PowerPoint. The colors can also be customized according to the presenter. This template can be saved in either PDF or JPG format. So, hurry and download our presentation and grow your business.
-
 19569109 style essentials 2 financials 3 piece powerpoint presentation diagram infographic slide
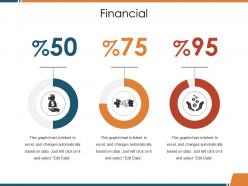
Presenting this set of slides with name - Financial Ppt Graphics. This is a three stage process. The stages in this process are Financial, Percentage, Business, Marketing, Strategy.
-
 86274960 style essentials 2 financials 3 piece powerpoint presentation diagram infographic slide
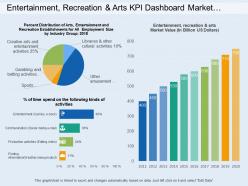
Presenting this set of slides with name - Entertainment Recreation And Arts Kpi Dashboard Market Value And Percentage Of Time Spend. This is a three stage process. The stages in this process are Entertainment, Recreation And Arts, Attractions, Culture, Entertainment.
-
 80294501 style essentials 2 financials 4 piece powerpoint presentation diagram infographic slide
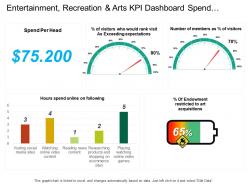
Presenting this set of slides with name - Entertainment Recreation And Arts Kpi Dashboard Spend Per Head And Hour Spend Online On Social Media. This is a four stage process. The stages in this process are Entertainment, Recreation And Arts, Attractions, Culture, Entertainment.
-
 64728756 style essentials 2 financials 6 piece powerpoint presentation diagram infographic slide
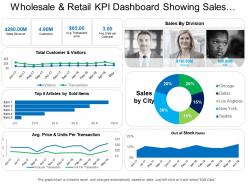
Presenting the KPI dashboard presentation template. This PPT template is 100% customizable in MS PowerPoint and is designed under the strict supervision of professionals. The user can edit the objects in the slide like font size and font color without any hassle. This presentation template is 100% compatible with Google Slide and can be saved in JPG or PDF file format easily. Click on the download tab to download this presentation template.
-
 34180412 style essentials 2 financials 6 piece powerpoint presentation diagram infographic slide
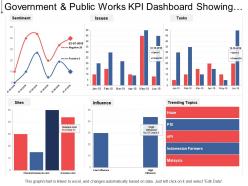
Presenting this set of slides with name - Government And Public Works Kpi Dashboard Showing Sentiment Trending Topics And Issues. This is a six stage process. The stages in this process are Government And Public Works, Government And Public Tasks.
-
 45456313 style essentials 2 financials 3 piece powerpoint presentation diagram infographic slide
This is a three stage process. The stage in this process are Business, Management, Strategy, Marketing, Finance.
-
 Audit report summary with key findings and recommendations
Presenting this set of slides with name Audit Report Summary With Key Findings And Recommendations. This is a three stage process. The stages in this process are Audit Report Summary With Key Findings And Recommendations. This is a completely editable PowerPoint presentation and is available for immediate download. Download now and impress your audience.
-
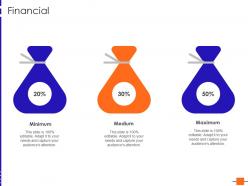 Financial ai platform
Increase audience engagement and knowledge by dispensing information using Financial AI Platform. This template helps you present information on three stages. You can also present information on Minimum, Medium, Maximum using this PPT design. This layout is completely editable so personaize it now to meet your audiences expectations.


