Financial Reviews and Accounting PPT Slides
-
 31800942 style essentials 2 financials 2 piece powerpoint presentation diagram infographic slide
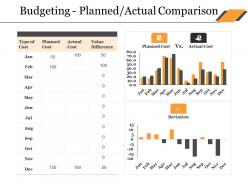
Presenting this set of slides with name - Budgeting Planned Actual Comparison Ppt Deck. This is a two stage process. The stages in this process are Bar Chart, Finance, Marketing, Analysis, Comparison.
-
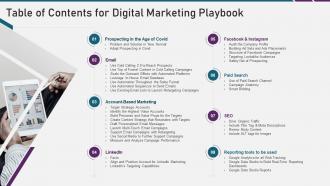 Table of contents for digital marketing playbook
Introducing Table Of Contents For Digital Marketing Playbook to increase your presentation threshold. Encompassed with eight stages, this template is a great option to educate and entice your audience. Dispence information on Prospecting Age Covid, Account-Based Marketing, SEO, Paid Search, Facebook And Instagram, using this template. Grab it now to reap its full benefits.
-
 Developing Utility Billing Steps To Determine Billing Software Design
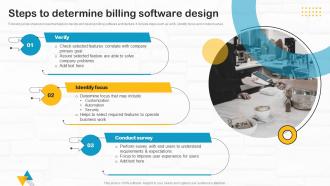
Following slide shows process that helps to decide and develop billing software architecture. It include steps such as verify, identify focus and conduct survey. Introducing Developing Utility Billing Steps To Determine Billing Software Design to increase your presentation threshold. Encompassed with three stages, this template is a great option to educate and entice your audience. Dispence information on Customization, Automation, Security, Requirements And Expectations, using this template. Grab it now to reap its full benefits.
-
 80177971 style essentials 2 compare 2 piece powerpoint presentation diagram infographic slide
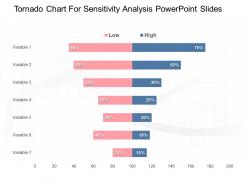
Presenting tornado chart for sensitivity analysis PowerPoint slides PPT slide. This plethora of professionally crafted slides is thoroughly editable. You may modify the content at your personal comfort and need. Personalize it with your company name and logo. You may download and save the presentation in the desired format. PPT is compatible with a wide variety of online and offline software options.
-
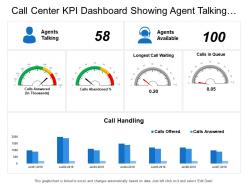 45331306 style essentials 2 financials 5 piece powerpoint presentation diagram infographic slide
Presenting this set of slides with name - Call Center Kpi Dashboard Showing Agent Talking Longest Call Waiting Call Handling. This is a five stage process. The stages in this process are Call Center Agent, Customer Care, Client Support.
-
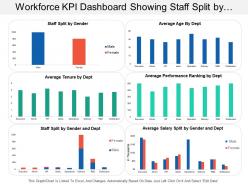 61566952 style essentials 2 financials 6 piece powerpoint presentation diagram infographic slide
Presenting this set of slides with name - Workforce Kpi Dashboard Showing Staff Split By Gender And Average Tenure By Department. This is a six stage process. The stages in this process are Staff, Personnel, Workforce.
-
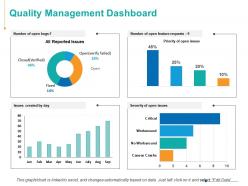 89610198 style essentials 2 financials 4 piece powerpoint presentation diagram infographic slide
Presenting this set of slides with name - Quality Management Dashboard Marketing Ppt Powerpoint Presentation Infographics Skills. This is a four stage process. The stages in this process are Finance, Analysis, Business, Investment, Marketing.
-
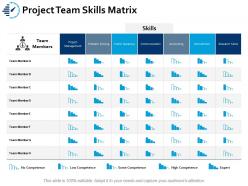 61862592 style essentials 2 financials 7 piece powerpoint presentation diagram infographic slide
Presenting this set of slides with name - Project Team Skills Matrix Ppt Portfolio Gridlines. This is a seven stage process. The stages in this process are Business, Management, Strategy, Sales, Marketing.
-
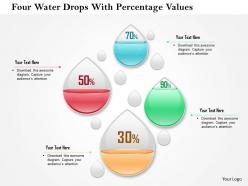 87705880 style layered vertical 4 piece powerpoint presentation diagram infographic slide
Fabulous introduction of plans and hues. Fantastic quality pictures which don't pixelate when anticipated on wide screen. Similarity with different organization alternatives like JPEG and JPG. Agreeable with various on the web and disconnected programming choices. Fully editable slide graphics. Compatible with various programming design like JPEG, JPG and PDF. Directive slides are given to help you in modifying the layout look and feel.
-
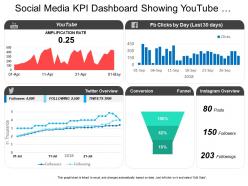 99246640 style essentials 2 financials 4 piece powerpoint presentation diagram infographic slide
We introduces to you its new Social media KPI dashboard showing YouTube amplification rate conversion PowerPoint template. You can download the business template, edit the data in the excel sheet and the graph changes dynamically. You can add backgrounds to all of the slides. This presentation is available for free download in JPG and PDF format. All the slides in this presentation are fully compatible with Google slides. You can view this document in widescreen size and standard screen size.
-
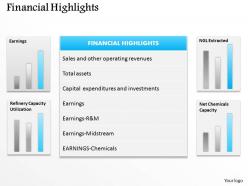 46947286 style essentials 2 financials 1 piece powerpoint presentation diagram infographic slide
Adjustable presentation background as convertible into JPG and PDF. Perfect quality of pictures and images used in the designing. Swift download and easy to share with large set of viewers. Handiness to transform the content according to the industry requirement. Margin to add business details such as icon, image or insignia. Slide downloadable in standard and widescreen display view. PowerPoint theme accessible with different nodes and stages. Benefitted for corporate finance management experts, business data professionals, accounts data representation etc.
-
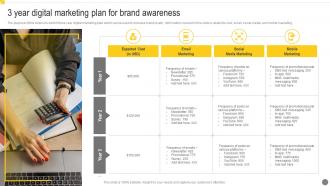 3 Year Digital Marketing Plan For Brand Awareness
The purpose of this slide is to exhibit three year digital marketing plan which can be used to increase brand loyalty. Information covered in this slide is related to cost, email, social media, and mobile marketing. Presenting our set of slides with 3 Year Digital Marketing Plan For Brand Awareness. This exhibits information on four stages of the process. This is an easy to edit and innovatively designed PowerPoint template. So download immediately and highlight information on Email Marketing, Social Media Marketing, Mobile Marketing.
-
 Marketing Management Planning For Financial Services Icon
Introducing our premium set of slides with Marketing Management Planning For Financial Services Icon. Ellicudate the three stages and present information using this PPT slide. This is a completely adaptable PowerPoint template design that can be used to interpret topics like Marketing Management Planning, Financial Services Icon.So download instantly and tailor it with your information.
-
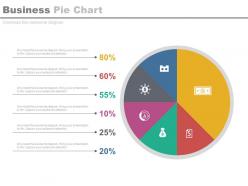 3896664 style essentials 2 financials 6 piece powerpoint presentation diagram infographic slide
Presenting business pie chart with percentage analysis powerpoint slides. This Power Point template diagram has been crafted with graphic of business pie chart and percentage diagram. This PPT diagram contains the concept of business and finance result analysis. Use this PPT diagram for business and finance related presentations.
-
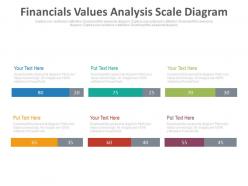 89732102 style essentials 2 financials 6 piece powerpoint presentation diagram infographic slide
Presenting financial values analysis scale diagram powerpoint slides. This is a financial values analysis scale diagram powerpoint slides. This is a six stage process. The stages in this process are financials.
-
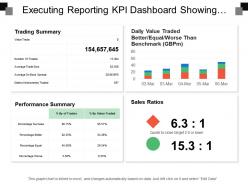 21668811 style essentials 2 financials 4 piece powerpoint presentation diagram infographic slide
Presenting this set of slides with name - Executing Reporting Kpi Dashboard Showing Trading Summary Performance Summary And Sales Ratio. This is a four stage process. The stages in this process are Executive Reporting, Executive Analysis, Executive Performance.
-
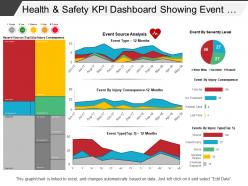 25077998 style essentials 2 financials 4 piece powerpoint presentation diagram infographic slide
Presenting the colorful dashboard presentation layout. This modern dashboard design is fully editable and is created under the strict supervision of professionals. You can bring changes to the objects in the slide like font size and font color hassle-free. This presentation slide is fully compatible with Google Slide and can be saved in JPG or PDF file format without any hassle. Fast download this at the click of the button.
-
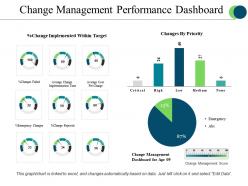 17683719 style division pie 3 piece powerpoint presentation diagram infographic slide
Presenting change management performance dashboard powerpoint slide designs. This is a change management performance dashboard powerpoint slide designs. This is a three stage process. The stages in this process are critical, high, low, medium, none.
-
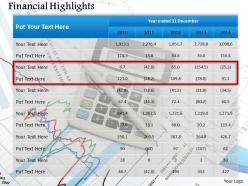 7789224 style essentials 2 financials 1 piece powerpoint presentation diagram infographic slide
Valuable for the business presenters, management and the entrepreneurs. Compatible with Google slides as well. Replace the watermark with your company’s name or logo. Convertible into numerous format options like JPEG or PDF. Fully editable PPT slide for financial analysis. User friendly structure of the slides. Access to edit the content, style, size and orientation of the PPT slides. Use of high resolution images and the graphics.
-
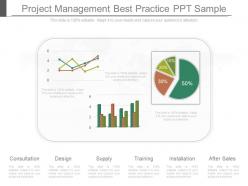 88408503 style division pie 3 piece powerpoint presentation diagram infographic slide
Presenting present project management best practice ppt sample. This is a project management best practice ppt sample. This is a three stage process. The stages in this process are consultation, design, supply, training, installation, after sales.
-
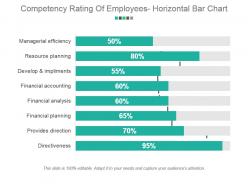 91551800 style essentials 2 financials 8 piece powerpoint presentation diagram infographic slide
Presenting competency rating of employees horizontal bar chart sample ppt presentation. This is a competency rating of employees horizontal bar chart sample ppt presentation. This is a eight stage process. The stages in this process are managerial efficiency, resource planning, develop and implements, financial accounting, financial analysis, financial planning, provides direction, directiveness.
-
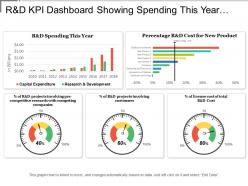 17848153 style concepts 1 growth 5 piece powerpoint presentation diagram infographic slide
Presenting this set of slides with name - R And D Kpi Dashboard Showing Spending This Year And Cost For New Product. This is a five stage process. The stages in this process are R And D, Research And Development, Research And Technological Development.
-
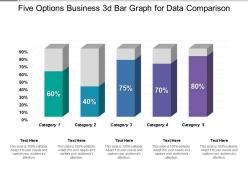 3732719 style essentials 2 financials 5 piece powerpoint presentation diagram infographic slide
Presenting this set of slides with name - Five Options Business 3d Bar Graph For Data Comparison. This is a five stage process. The stages in this process are Paint Brush, Art, Coloring.
-
 Financial percentage ppt powerpoint presentation show files
Presenting this set of slides with name Financial Percentage Ppt Powerpoint Presentation Show Files. This is a four stage process. The stages in this process are Finance, Analysis, Business, Investment, Marketing. This is a completely editable PowerPoint presentation and is available for immediate download. Download now and impress your audience.
-
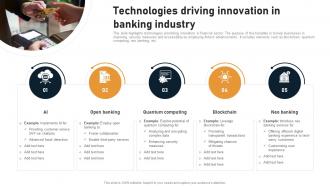 Technologies Driving Innovation In Banking Industry
This slide highlights technologies promoting innovation in financial sector. The purpose of this template is to help businesses in improving security measures and accessibility by employing fintech advancements. It includes elements such as blockchain, quantum computing, neo banking, etc. Presenting our set of slides with Technologies Driving Innovation In Banking Industry This exhibits information on five stages of the process. This is an easy to edit and innovatively designed PowerPoint template. So download immediately and highlight information on Open Banking, Quantum Computing, Blockchain, Neo Banking
-
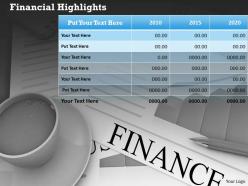 79758837 style essentials 2 financials 1 piece powerpoint presentation diagram infographic slide
Pixel-rich quality of the images and the graphics in the slides. Allow instant downloading and saving of the slide design. Visually appealing content and the slide graphics. Compatible with the Google Slides and other offline software’s. Easy to insert the company’s logo or brand name in the background while replacing the traditional watermark. Useful for the marketing individuals and accountants.
-
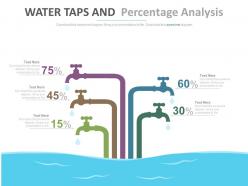 94757693 style essentials 2 financials 5 piece powerpoint presentation diagram infographic slide
Presenting five staged water taps and percentage analysis powerpoint slides. This Power Point template diagram has been crafted with graphic of five staged water taps and percentage diagram. This PPT diagram contains the concept of business data analysis. Use this PPT diagram for business and finance related presentations.
-
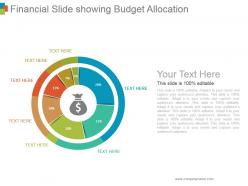 60453361 style division donut 7 piece powerpoint presentation diagram infographic slide
Presenting financial slide showing budget allocation ppt background. This is a financial slide showing budget allocation ppt background. This is a seven stage process. The stages in this process are circular, process, percentage, financial, budget.
-
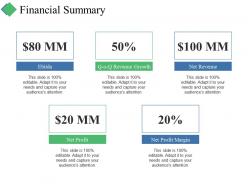 45276543 style essentials 2 financials 5 piece powerpoint presentation diagram infographic slide
Presenting this set of slides with name - Financial Summary Ppt Summary File Formats. This is a five stage process. The stages in this process are Finance, Marketing, Business, Planning, Strategy.
-
 51768887 style essentials 2 financials 4 piece powerpoint presentation diagram infographic slide
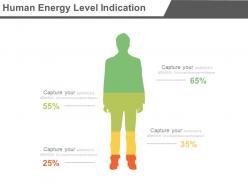
Completely editable smartphone with online banking solutions and wifi PPT Slides including fonts, visuals, text, colors, etc. Compatible with number of software options. Excellence in picture quality. Beneficial for investors, shareholders, financiers, professors, students, marketers, sales people, etc. Presentation design can be displayed in standard and widescreen view. Personalize the presentation with individual company name and logo. PPT template is fully editable to allow customization. Simple to download and convert into PDF format.
-
 75674013 style essentials 2 financials 5 piece powerpoint presentation diagram infographic slide
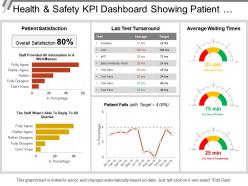
Presenting this set of slides with name - Health And Safety Kpi Dashboard Showing Patient Satisfaction And Lab Test Turnaround. This is a five stage process. The stages in this process are Health And Safety, Health And Security, Health And Protection.
-
 24276098 style essentials 2 financials 6 piece powerpoint presentation diagram infographic slide
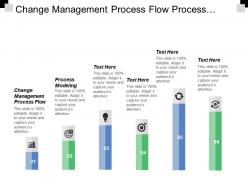
Presenting this set of slides with name - Change Management Process Flow Process Modeling Audit Process Cpb. This is an editable six stages graphic that deals with topics like Change Management Risks, Increasing Operational Efficiency, Expatriate Employee to help convey your message better graphically. This product is a premium product available for immediate download, and is 100 percent editable in Powerpoint. Download this now and use it in your presentations to impress your audience.
-
 30606853 style essentials 2 financials 4 piece powerpoint presentation diagram template slide
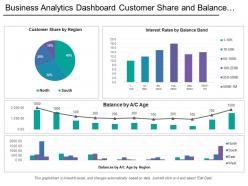
This is a four stage process. The stages in this process are Business Analytics, BA, Organizations Data.
-
 73176488 style essentials 2 financials 3 piece powerpoint presentation diagram infographic slide
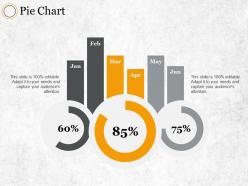
Presenting this set of slides with name - Pie Chart Ppt Professional Graphics Download. This is a three stage process. The stages in this process are Product, Percentage, Business, Marketing, Management.
-
 95095097 style essentials 2 financials 4 piece powerpoint presentation diagram infographic slide
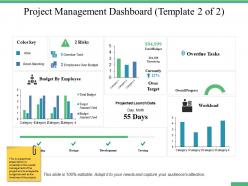
Presenting this set of slides with name - Project Management Dashboard Snapshot Ppt Professional Graphic Images. This is a four stage process. The stages in this process are Percentage, Product, Management, Marketing, Business.
-
 34095747 style division pie 4 piece powerpoint presentation diagram infographic slide
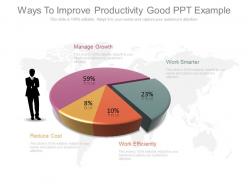
Can be viewed in 4: 3 standard screen size or 16:9 wide screen size. PPT design has many supporting actions like write, erase, correct, clean and select. Internet based click facilities like online image search and others can be added with ease which. Enables to give a professional look to the PPT slide. Enables real time edition or collaboration with auto saving options.The stages in this process are manage growth, work smarter, reduce cost, work smarter.
-
 83150457 style essentials 2 financials 3 piece powerpoint presentation diagram infographic slide
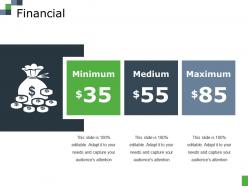
Presenting this set of slides with name - Financial Ppt File Infographics. This is a three stage process. The stages in this process are Minimum, Medium, Maximum, Dollar, Symbol.
-
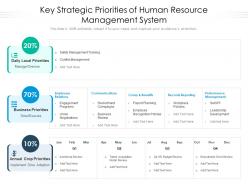 Key strategic priorities of human resource management system
Presenting our set of slides with Key Strategic Priorities Of Human Resource Management System. This exhibits information on three stages of the process. This is an easy-to-edit and innovatively designed PowerPoint template. So download immediately and highlight information on Daily Local Priorities, Business Priorities, Annual Crop Priorities.
-
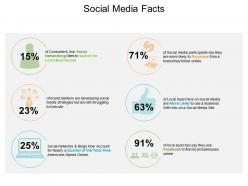 88912586 style layered vertical 6 piece powerpoint presentation diagram infographic slide
Presenting social media facts PowerPoint slide deck PPT template. You can download this template and save into another format such as JPG and PDF and can also display in standard and widescreen view. You can alter the slide such as color, text, font type, font size and aspect ratio. This template gets synced with Google Slides and editable in PowerPoint. You may share this slide with large segment because it has great pixel quality. You can insert the relevant content in text placeholder of this template.
-
 Lending money in loan icon
Presenting this set of slides with name Lending Money In Loan Icon. This is a three stage process. The stages in this process are Lending Money In Loan Icon. This is a completely editable PowerPoint presentation and is available for immediate download. Download now and impress your audience.
-
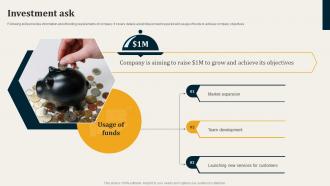 Investment Ask Catering Services Startup Fund Elevator Presentation
Following slide provides information about funding requirements of company. It covers details about total amount required and usage of funds to achieve company objectives.Increase audience engagement and knowledge by dispensing information using Investment Ask Catering Services Startup Fund Elevator Presentation This template helps you present information on three stages. You can also present information on Market Expansion, Team Development, Launching New Services using this PPT design. This layout is completely editable so personaize it now to meet your audiences expectations.
-
 24213662 style concepts 1 growth 4 piece powerpoint presentation diagram template slide
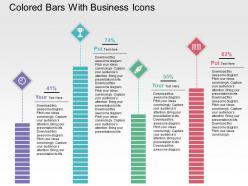
High resolution of the images and the business icons. Add or remove the image and the graphics. Insert your brand name or logo while removing the trademark from the slides. 100% accessibility to edit and make the desired changes. Fit well with the Google slides or Microsoft office. Quality maintained even when used on a wide display. Advantageous for the global marketers, entrepreneurs and the marketing individuals.
-
 57299955 style essentials 2 financials 2 piece powerpoint presentation diagram infographic slide
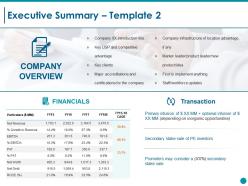
Presenting this set of slides with name - Executive Summary Ppt Styles Example Topics. This is a two stage process. The stages in this process are Business, Marketing, Strategy, Net Revenue, Net Worth.
-
 4862684 style essentials 2 financials 4 piece powerpoint presentation diagram infographic slide
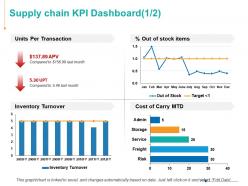
Presenting this set of slides with name - Supply Chain KPI Dashboard Ppt Powerpoint Presentation Infographics Grid. This is a four stage process. The stages in this process are Inventory Turnover, Service, Marketing, Analysis, Investment.
-
 97757242 style essentials 2 financials 4 piece powerpoint presentation diagram infographic slide
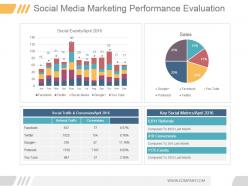
Presenting social media marketing performance evaluation ppt diagrams. This is a social media marketing performance evaluation ppt diagrams. This is a four stage process. The stages in this process are social event april, facebook, twitter, social media, google, you tube, jan, feb, mar, apr, may, jun, jul, aug, sep, oct, nov, dec, social traffic and conversion april 2016, referral traffic, conversions, pinterest, sales, key social metrics april 2016, referral traffic, conversions, pinterest, sales, key social metrics april, referrals, compared to 4655 last month, conversions, compared to 354 last month, events, compared to 1052 last month.
-
 78269850 style essentials 2 financials 4 piece powerpoint presentation diagram infographic slide
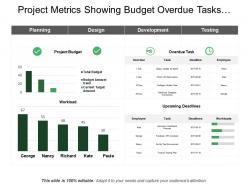
Presenting this set of slides with name - Project Metrics Showing Budget Overdue Tasks Workload. This is a four stage process. The stages in this process are Project Kpis, Project Dashboard, Project Metrics.
-
 48227464 style essentials 2 financials 2 piece powerpoint presentation diagram infographic slide
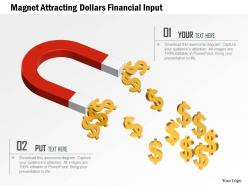
We are proud to present our magnet attracting dollars financial input powerpoint template. Concept of financial inventory update has been displayed in this PPT diagram. This PPT diagram contains graphic of magnet and dollars. Use this PPT diagram for finance and management related presentations.
-
 37738630 style essentials 2 dashboard 4 piece powerpoint presentation diagram infographic slide
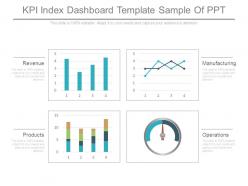
Presenting kpi index dashboard template sample of ppt. This is a kpi index dashboard template sample of ppt. This is a four stage process. The stages in this process are revenue, manufacturing, products, operations.
-
 65922669 style essentials 2 financials 1 piece powerpoint presentation diagram infographic slide
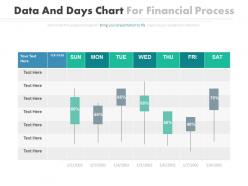
Presenting date and days chart for financial process powerpoint slides. This Power Point template slide has been crafted with graphic of date and days chart. This PPT slide contains the concept of financial process flow representation. Use this PPT slide for business and finance related presentations.
-
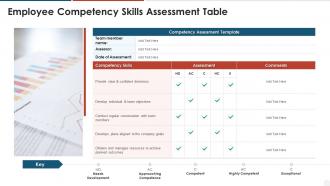 Employee competency skills assessment table
Presenting our set of slides with Employee Competency Skills Assessment Table. This exhibits information on one stages of the process. This is an easy to edit and innovatively designed PowerPoint template. So download immediately and highlight information on Resources, Needs Development, Develops Plans.
-
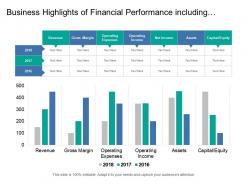 86793716 style essentials 2 financials 6 piece powerpoint presentation diagram infographic slide
Presenting this set of slides with name - Business Highlights Of Financial Performance Including Revenue Gross Margin Operating Income. This is a six stage process. The stages in this process are Business Highlights, Company Highlights, Business Key Points.
-
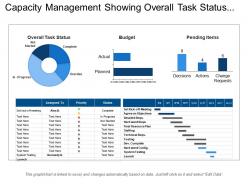 55817681 style essentials 2 financials 5 piece powerpoint presentation diagram infographic slide
Presenting this set of slides with name - Capacity Management Showing Overall Task Status Budget Pending Items. This is a five stage process. The stages in this process are Problem Statement And Solution, Challenges And Solutions, Issues And Solutions.
-
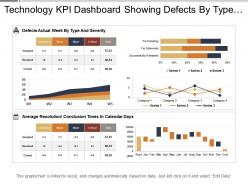 2871348 style essentials 2 financials 6 piece powerpoint presentation diagram infographic slide
Presenting this set of slides with name - Technology Kpi Dashboard Showing Defects By Type And Severity. This is a six stage process. The stages in this process are Technology, IT, IOT.
-
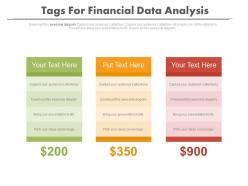 16044059 style essentials 2 financials 3 piece powerpoint presentation diagram infographic slide
Presenting three tags for financial data analysis powerpoint slides. This Power Point template diagram with graphic of three staged tags diagram. This PPT diagram contains the concept of financial data analysis. Use this PPT diagram for business and finance related presentations.
-
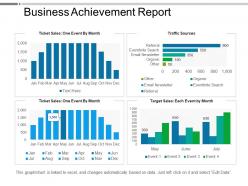 22010307 style essentials 2 financials 4 piece powerpoint presentation diagram infographic slide
Presenting business achievement report PowerPoint templates slideshow which is 100% editable. This PPT template is crafted with attractive display and unique components. This PPT slide is excel linked i.e. data driven and easy to customize and enables you to personalize it as per your own criteria. The presentation slide is fully compatible with Google slides, multiple format and software options. In case of any assistance, kindly take instructions from our presentation design services and it is easy to download in a very short span of time. The images, layouts, designs are of high quality and ensures quality in widescreen.
-
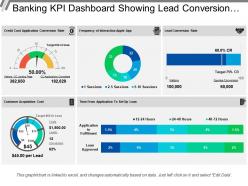 77576042 style essentials 2 financials 5 piece powerpoint presentation diagram infographic slide
Presenting this set of slides with name - Banking Kpi Dashboard Showing Lead Conversion And Acquisition Cost. This is a five stage process. The stages in this process are Banking, Finance, Money.
-
 Effective Marketing Guide To Attract Investors
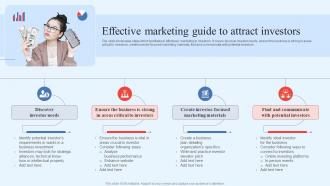
The slide showcases steps which facilitates in effectively marketing to investors. It covers discover investor needs, ensure the business is strong in areas critical to investors, create investor focused marketing materials, find and communicate with potential investors. Presenting our set of slides with Effective Marketing Guide To Attract Investors This exhibits information on Fourstages of the process. This is an easy to edit and innovatively designed PowerPoint template. So download immediately and highlight information on Discover Investor Needs, Marketing Materials, Potential Investors.
-
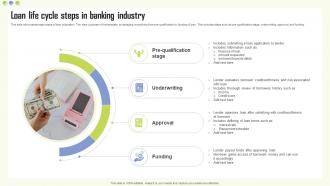 Loan Life Cycle Steps In Banking Industry
This slide showcases major steps of loan origination. The main purpose of this template is managing everything from pre qualification to funding of loan. This includes steps such as pre qualification stage, underwriting, approval, and funding.Introducing our premium set of slides with Loan Life Cycle Steps In Banking Industry. Ellicudate the four stages and present information using this PPT slide. This is a completely adaptable PowerPoint template design that can be used to interpret topics like Evaluates Borrower, Creditworthiness Risk Associated, Includes Thorough. So download instantly and tailor it with your information.
-
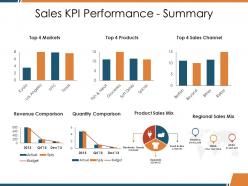 38017825 style essentials 2 financials 6 piece powerpoint presentation diagram infographic slide
Presenting this set of slides with name - Sales Kpi Performance Summary Ppt Template. This is a six stage process. The stages in this process are Revenue Comparison, Quantity Comparison, Product Sales Mix, Regional Sales Mix, Sales Channel.
-
 73579233 style essentials 2 financials 6 piece powerpoint presentation diagram infographic slide
This storage KPI dashboard PPT design is completely editable; you can modify and personalize the design as per your business needs; include business logo and trademark to look PPT more authentic, put your business warehousing figures in excel and linked charts in design will get updated automatically. You can download the design into JPEG or PDF formats; easy and swift downloading available. Design is compatible with Google Slides and MS PowerPoint software.


