Financial Reviews and Accounting PPT Slides
-
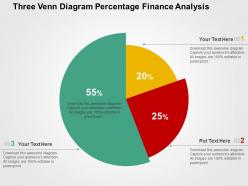 23462071 style division pie 3 piece powerpoint presentation diagram template slide
Presentation slide graphic of for financial analysis. Can be used by marketers, students, professors, sales people, business analysts, etc. Compatible with number of software options. Colors and text can be easily changed as the PPT slide is completely editable. Personalize the presentation with individual company name and logo. Available in both Standard and Widescreen slide size. Easy and quick downloading process.
-
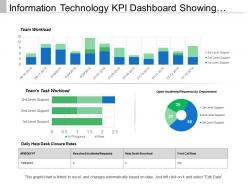 90643141 style essentials 2 financials 3 piece powerpoint presentation diagram infographic slide
Presenting this set of slides with name - Information Technology Kpi Dashboard Showing Team Task Workload. This is a three stage process. The stages in this process are Information Technology, It, Iot.
-
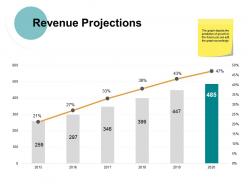 80531286 style essentials 2 financials 2 piece powerpoint presentation diagram infographic slide
Presenting this set of slides with name - Revenue Projections Ppt Powerpoint Presentation File Designs Download. This is a two stage process. The stages in this process are Finance, Management, Strategy, Business, Marketing.
-
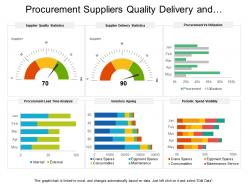 79423808 style essentials 2 financials 6 piece powerpoint presentation diagram infographic slide
Presenting this set of slides with name - Procurement Suppliers Quality Delivery And Utilization Dashboard. This is a six stage process. The stages in this process are Purchase, Procurement, Buy.
-
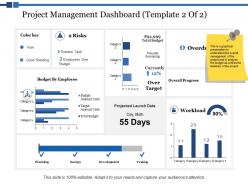 95857217 style essentials 2 financials 3 piece powerpoint presentation diagram infographic slide
This is a threee stages process. The stages in this process are Finance, Marketing, Management, Investment, Analysis.
-
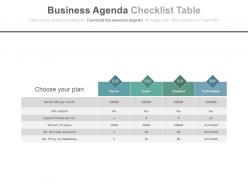 57360572 style essentials 2 financials 1 piece powerpoint presentation diagram infographic slide
This PPT Template can be used by any organization’s executives for representing business agenda related presentations. All these images are 100% edited in terms of color, size, and orientation of the elements mentioned in the slides. These PPT slides are compatible with Google slides and can be edited in any PowerPoint software.
-
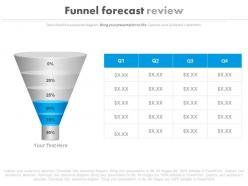 47077749 style essentials 2 financials 1 piece powerpoint presentation diagram infographic slide
Presenting ppt funnel forecast review table powerpoint slides. This Power Point template slide has been crafted with graphic of funnel and bar graph charts. This PPT slide contains the concept of business forecast and review. Use this PPT slide for business and marketing related presentations.
-
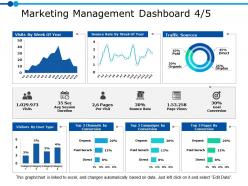 53868423 style essentials 2 financials 3 piece powerpoint presentation diagram infographic slide
Presenting this set of slides with name - Marketing Management Dashboard 4 5 Ppt Powerpoint Presentation Gallery Example. This is a three stage process. The stages in this process are Business, Management, Strategy, Analysis, Marketing.
-
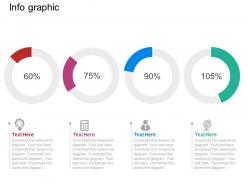 15472056 style essentials 2 financials 4 piece powerpoint presentation diagram infographic slide
Modifiable PPT Slide with pie charts with percentage and icons. Compatible with numerous format options like JPEG, JPG or PDF. Provides a professional outlook to your PowerPoint presentation. Icons are also be added. Customization of each PowerPoint graphic and text according to your desire and want. Available in Widescreen slide size also. Freedom to customize it with company name and logo. Beneficial for business professionals, students, teachers, business analysts and strategists. Compatible with Google slides as well.
-
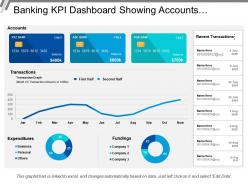 89540797 style essentials 2 financials 3 piece powerpoint presentation diagram infographic slide
Presenting this set of slides with name - Banking Kpi Dashboard Showing Accounts Expenditures Fundings. This is a three stage process. The stages in this process are Banking, Finance, Money.
-
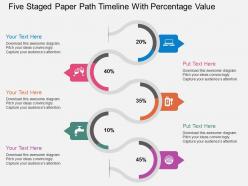 99482529 style circular zig-zag 5 piece powerpoint presentation diagram infographic slide
PowerPoint diagrams have been made by professional experts. All the PPT slides are fully accustomed to Google slides. Can be used by marketing and business professionals. Presented in form of a road map. Use of percentages. Facility of editing the text and color made it viable for the users. Can be used to define strategy implications. Attractive and colorful icons have been used.
-
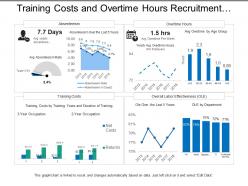 90454204 style essentials 2 financials 4 piece powerpoint presentation diagram infographic slide
Presenting this set of slides with name - Training Costs And Overtime Hours Recruitment Dashboard. This is a four stage process. The stages in this process are Staffing Plan, Recruitment, Staff Management.
-
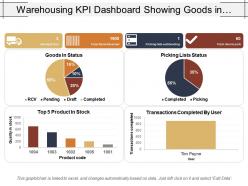 81722085 style essentials 2 financials 4 piece powerpoint presentation diagram infographic slide
The presentation design is easy to edit by anyone even having without any specific knowledge. Design elements are editable including font, type, color, size, style, shape, background, images etc. Slides are completely compatible with Google Slides and MS PowerPoint software. Both standard and full screen view available; no change on design quality will happen when opened on full screen view.
-
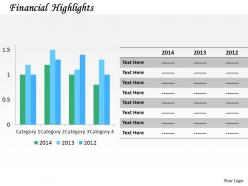 94847653 style essentials 2 financials 1 piece powerpoint presentation diagram infographic slide
Deploy slides in all compatible software evenly. Hassle-free download and usage of slide. Company logo, trademark or name can be inserted for extra customization. PowerPoint graphics do not pixelate upon projection on widescreen. All slides compatible with google slides for more online reach. Highly customized layout including font, text, color and design. Include titles and sub titles with zero space constraints.
-
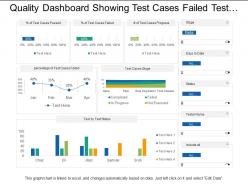 9481681 style essentials 2 financials 3 piece powerpoint presentation diagram infographic slide
SlideTeam feels immense pleasure in presenting to you its quality dashboard showing test cases failed test status and in progress. Following simple instructions given in the sample template you can easily alter the given set of predesigned slides. You can view the PPT template in standard size display ratio of 4:3 or widescreen display ratio of 16:9. The business slides are very easy to use and operate as they are compatible with Google Slides and can be similarly saved in format of PDF or JPG.
-
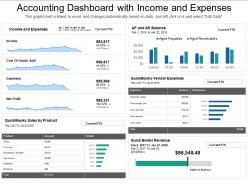 55369360 style essentials 2 financials 5 piece powerpoint presentation diagram infographic slide
Presenting accounting dashboard with income and expenses PPT slideshow. Loaded with incomparable benefits. Readymade PPT graphic helps in saving time and effort. Can be personalized by adding company trademark, logo, brand and symbols. Can be utilized for displaying both simple and complex information. Include or exclude slide content as per your individual need. Colors and text can be easily changed as the PPT slide is completely editable. Useful for every business leader and professional, project management team, business analysts, etc.
-
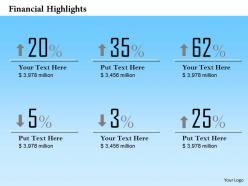 82990464 style essentials 2 financials 1 piece powerpoint presentation diagram infographic slide
High resolution visuals. Splendid picture quality. No fear of image pixilation when projected on wide screen. Compatible with multiple number of software options like JPEG, JPG and PDF. Compatible with numerous software options available both online and offline. Ease of download. Ease of customization. Thoroughly editable slide design background. Freedom to personalize the slide content with company specific name, logo and trademark.
-
 Marketing Management Planning For Financial Services Icon
Introducing our premium set of slides with Marketing Management Planning For Financial Services Icon. Ellicudate the three stages and present information using this PPT slide. This is a completely adaptable PowerPoint template design that can be used to interpret topics like Marketing Management Planning, Financial Services Icon.So download instantly and tailor it with your information.
-
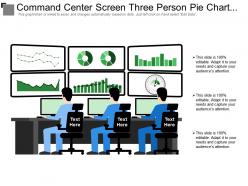 45123815 style variety 1 silhouettes 3 piece powerpoint presentation diagram infographic slide
Presenting this set of slides with name - Command Center Screen Three Person Pie Chart Mobile. This is a three stage process. The stages in this process are Command Room, Control Centre, Control Room.
-
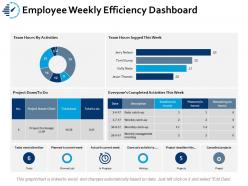 3616780 style essentials 2 financials 2 piece powerpoint presentation diagram infographic slide
Presenting this set of slides with name - Employee Weekly Efficiency Dashboard Snapshot Ppt Portfolio Brochure. This is a two stage process. The stages in this process are Business, Management, Strategy, Sales, Marketing.
-
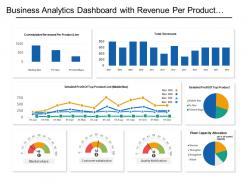 91806731 style essentials 2 financials 8 piece powerpoint presentation diagram infographic slide
This is a eight stage process. The stages in this process are Business Analytics, BA, Organizations Data.
-
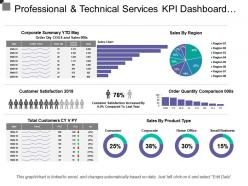 71135471 style essentials 2 financials 3 piece powerpoint presentation diagram infographic slide
Presenting this set of slides with name - Professional And Technical Services Kpi Dashboard Showing Sales By Region. This is a three stage process. The stages in this process are Professional And Technical Services, Services Management, Technical Management.
-
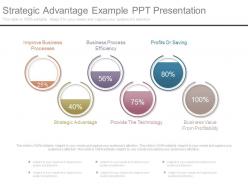 33208426 style essentials 2 financials 6 piece powerpoint presentation diagram infographic slide
Fast and simple to download without any hassles. Absolutely editable text boxes as per your need. Fully modifiable PPT images- alter the color scheme and contrast to your liking. Change the orientation and size of PPT icons as per requirement. No change in original resolution of PPT infographics after editing any number of times.The stages in this process are improve business processes, business process efficiency, profits or saving, strategic advantage, provide the technology, business value from profitability.
-
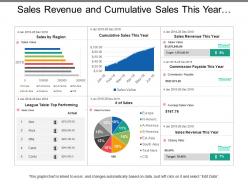 46575029 style essentials 2 financials 5 piece powerpoint presentation diagram infographic slide
Presenting this set of slides with name - Sales Revenue And Cumulative Sales This Year Dashboards. Completely amendable presentation design as some elements are editable. Ease to personalize the slide with your company name, logo and even tag line. PowerPoint slide can be downloaded easily and transform into JPG and PDF format. More designs can be accessed with different nodes and stages. PPT diagram can be projected in standard and widescreen view. Great use of colors and innovatively designed. PPT template is compatible with Google slides.
-
 57251757 style essentials 2 financials 3 piece powerpoint presentation diagram infographic slide
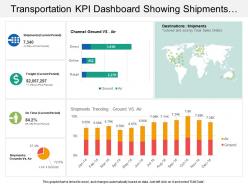
Presenting our transportation KPI dashboard snapshot showing shipments ground vs. air channel PPT slide. This layout is compatible with Google slides and data can be updated with excel linked file. This template is Excel linked just right click to input your information. Images do no blur out even when they are projected on large screen.PPT template can be utilized by sales and marketing teams and business managers. Instantly downloadable slide and supports formats like JPEG and PDF.
-
 17980133 style division pie 6 piece powerpoint presentation diagram infographic slide
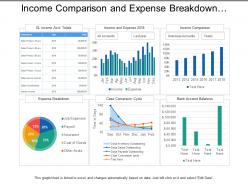
Presenting this set of slides with name - Income Comparison And Expense Breakdown Utilities Dashboard. This is a six stage process. The stages in this process are Utilities, Use, Advantage.
-
 77086015 style essentials 2 financials 4 piece powerpoint presentation diagram infographic slide
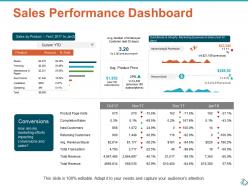
Presenting this set of slides with name - Sales Performance Dashboard Ppt Show Infographic Template. This is a four stage process. The stages in this process are Business, Planning, Strategy, Marketing, Management.
-
 50 percent task complete icon with percentage
Presenting our set of slides with 50 Percent Task Complete Icon With Percentage. This exhibits information on three stages of the process. This is an easy to edit and innovatively designed PowerPoint template. So download immediately and highlight information on 50 Percent Task Complete Icon With Percentage.
-
 75151883 style essentials 2 financials 4 piece powerpoint presentation diagram infographic slide
Brimming with aesthetic appeal and professional parameters. Uncluttered and intense projection of relevant visuals. Harmonious use of PPT icons, colors, fonts and designs with respect to the subject. Freedom to execute changes in slide background as per individual’s preference. Flexibility to customize it with company specific elements like name, logo and trademark. Compatibility with multiple software and format options. High resolution and stupendous quality visuals. Used by several business strategists, stakeholders, managers, students, financiers, sales professionals and entrepreneurs.
-
 9642478 style division pie 3 piece powerpoint presentation diagram infographic slide
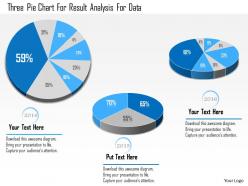
We are proud to present our 1114 three pie chart for result analysis for data powerpoint template. Display the concept of result analysis with this Power Point template slide. This PPT slide contains the graphic of three pie chart . This PPt slide can be used for business and sales data related analysis.
-
 51828701 style essentials 2 financials 5 piece powerpoint presentation diagram infographic slide
Introducing Quarterly Performance Financial Summary PowerPoint design. Completely directed PowerPoint layout very sensible for the administration experts and business masters. Broad extension for restoring the spurious information. Also allows to include the organization logo, trademark, and so on. Reconvert able PPT image, topic, structures, setting and so on as per need. Versant with all Google Slides and other system applications. Can be effectively anticipated over wide screen without compromising over its quality.
-
 35189787 style essentials 2 dashboard 3 piece powerpoint presentation diagram infographic slide
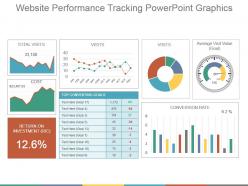
Presenting website performance tracking powerpoint graphics. This is a website performance tracking powerpoint graphics. This is a three stage process. The stages in this process are total visits, conversion rate, return on investment, average visit value.
-
 20077957 style essentials 2 financials 3 piece powerpoint presentation diagram infographic slide
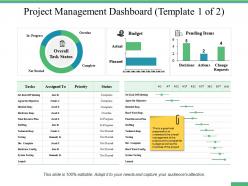
Presenting this set of slides with name - Project Management Dashboard Snapshot Ppt Professional Example Introduction. This is a three stage process. The stages in this process are Percentage, Product, Management, Marketing, Business.
-
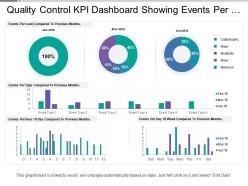 82071137 style essentials 2 financials 4 piece powerpoint presentation diagram infographic slide
Presenting this set of slides with name - Quality Control Kpi Dashboard Showing Events Per Hour And Day. This is a four stage process. The stages in this process are Quality Management, Quality Control, Quality Assurance.
-
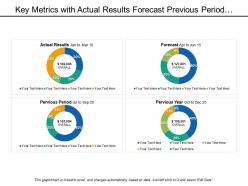 78346647 style division donut 4 piece powerpoint presentation diagram infographic slide
Presenting this set of slides with name - Key Metrics With Actual Results Forecast Previous Period And Year. This is a four stage process. The stages in this process are Key Metrics, Key Performance Indicator, Kpi.
-
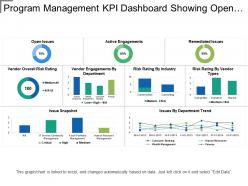 59274613 style essentials 2 financials 3 piece powerpoint presentation diagram infographic slide
Presenting this set of slides with name - Program Management Kpi Dashboard Showing Open Issues And Risk Rating. This is a three stage process. The stages in this process are Program Development, Human Resource Management, Program Management.
-
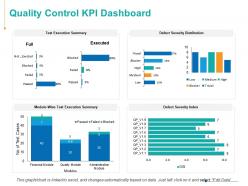 22008895 style essentials 2 financials 6 piece powerpoint presentation diagram infographic slide
Presenting this set of slides with name - Quality Control KPI Dashboard Ppt Powerpoint Presentation Inspiration Example. This is a six stage process. The stages in this process are Finance, Analysis, Business, Investment, Marketing.
-
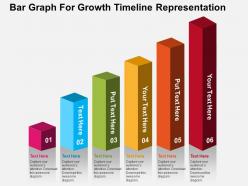 90530505 style concepts 1 growth 6 piece powerpoint presentation diagram infographic slide
Proofing and editing can be done with ease in PPT design. Presentation slide is of utmost use to management professionals, big or small organizations and business startups. Smooth functioning is ensured by the presentation slide show on all software’s. When projected on the wide screen the PPT layout does not sacrifice on pixels or color resolution. Can be used by the teachers, businessmen, managers and other professionals to have a setup to highlight different characteristics. Supports good compatibly with the Google slides.
-
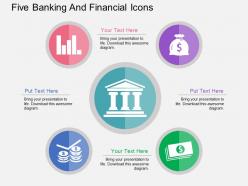 80311763 style cluster mixed 5 piece powerpoint presentation diagram infographic slide
Presenting kk five banking and financial icons flat powerpoint design. This Power Point template diagram has been crafted with graphic of five banking and finance icons. This PPT diagram contains the concept of banking solutions and financial process flow indication .Use this PPT diagram for business and finance related presentations.
-
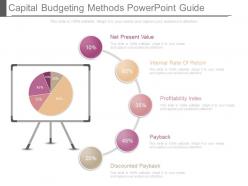 98411976 style essentials 2 financials 5 piece powerpoint presentation diagram infographic slide
High resolution PPT diagrams. 100 percent editable format. Easy inclusion and exclusion of information as per individual choice. Adaptable and convertible into various formats. Simple to download. For more of personalization one may easily add the company name, logo or trademark. Productive set of PowerPoint icon images for entrepreneurs, investors, internal and external stakeholders, researchers, business analysts and education professionals. The stages in this process are net present value, internal rate of return, profitability index, payback, discounted payback.
-
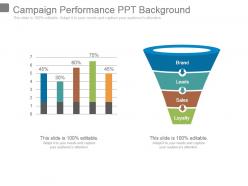 99428982 style layered funnel 2 piece powerpoint presentation diagram infographic slide
Presenting campaign performance ppt background. This is a campaign performance ppt background. This is a two stage process. The stages in this process are brand, leads, sales, loyalty.
-
 61222110 style essentials 2 financials 4 piece powerpoint presentation diagram template slide
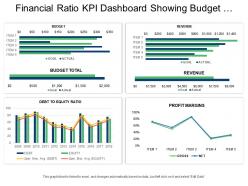
Presenting this set of slides with name - Financial Ratio Kpi Dashboard Snapshot Showing Budget Revenue And Profit Margins. This is a four stage process. The stages in this process are Accounting Ratio, Financial Statement, Financial Ratio.
-
 51767502 style essentials 2 financials 3 piece powerpoint presentation diagram infographic slide
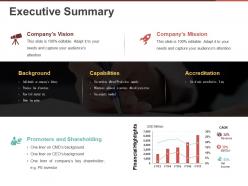
Presenting this set of slides with name - Executive Summary Powerpoint Themes. This is a three stage process. The stages in this process are Bar Chart, Finance, Marketing, Analysis, Strategy, Business.
-
 25915484 style essentials 2 financials 6 piece powerpoint presentation diagram infographic slide
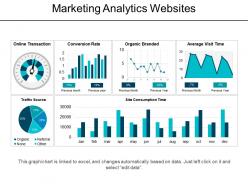
Presenting marketing analytics websites powerpoint topics. This is a marketing analytics websites powerpoint topics. This is a six stage process. The stages in this process are market analysis, marketing analytics, web analytics, marketing optimization.
-
 33223190 style essentials 2 financials 4 piece powerpoint presentation diagram infographic slide
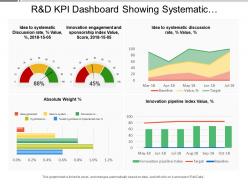
Presenting this set of slides with name - R And D Kpi Dashboard Showing Systematic Discussion Rate Innovation Engagement And Sponsorship Index. This is a four stage process. The stages in this process are R And D, Research And Development, Research And Technological Development.
-
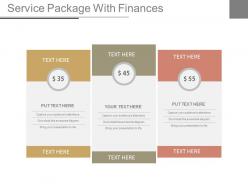 84606740 style essentials 2 financials 3 piece powerpoint presentation diagram infographic slide
Aesthetically designed and professionally equipped slides. High resolution. Modify the contents at your ease. 100 percent editable slide design. Execute the changes with the provided on slide assistance. Personalize the contents with your company name and logo. Used by managers, marketers, MBA students and other professionals. Impressive picture quality which do not pixelate when projected on wide screen. Compatible with multiple set of software available both online and offline. Compatible with team of format like JPEG, JPG and PDF. The stages in this process are finance, marketing, strategy, symbol, business.
-
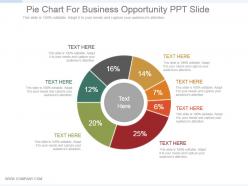 56692215 style essentials 2 financials 7 piece powerpoint presentation diagram infographic slide
Presenting pie chart for business opportunity ppt slide. This is a pie chart for business opportunity ppt slide. This is a seven stage process. The stages in this process are pie, chart, percentage, financials, process.
-
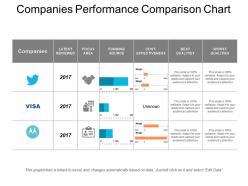 56486281 style essentials 2 financials 5 piece powerpoint presentation diagram infographic slide
Presenting Companies Performance Comparison Chart Powerpoint Template. The slide is totally compatible with Google Slides. It can be customised as per your requirement. Also, related content can be added in the text holders provided. The size, style and color of the font can be changed according to your requirement. The slide is available in two sizes - standard screen size and wide screen size. It has a high resolution which ensures that the image does not blur upon enlarging. It can be downloaded easily.
-
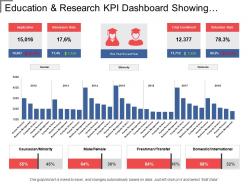 65293724 style essentials 2 financials 4 piece powerpoint presentation diagram infographic slide
Presenting education and research KPI dashboard showing retention rate and admissions PPT slide. The KPI for school teachers PPT slide designed by professional team of SlideTeam. The education presentation slide is customizable in PowerPoint. The education KPI dashboard PowerPoint template is also compatible with Google Slide so a user can share this template with others via the internet. A user can make changes in the font size, font type, color as well as dimensions of the key performance indicators for schools & education management PPT slide as per the requirement. You may edit the value in the KPI dashboard higher education template as the template get linked with Excel sheet.
-
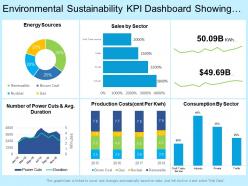 44987331 style essentials 2 financials 6 piece powerpoint presentation diagram infographic slide
Presenting this set of slides with name - Environmental Sustainability Kpi Dashboard Showing Total Consumption Sales Energy Sources. This is a six stage process. The stages in this process are Environment Sustainability, Environment Continual, Environment Feasibility.
-
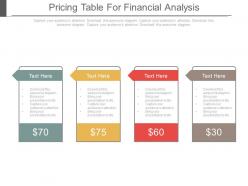 87759359 style essentials 2 financials 4 piece powerpoint presentation diagram infographic slide
Presenting four staged pricing table for financial analysis powerpoint slides. This Power Point template slide has been crafted with graphic of four staged pricing table. This PPT slide contains the concept of financial data analysis. Use this PPT slide for business and finance related presentations.
-
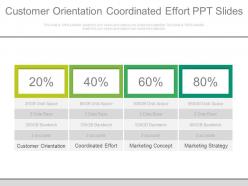 12690214 style essentials 2 financials 4 piece powerpoint presentation diagram infographic slide
High quality images and visuals used in the PPT design. Fully modifiable Presentation slide as editing is possible. Access to alter the design into JPEG and PDF document. Download is quick and can be easily shared. PowerPoint slides well-suited with Google slides. Template designs available with different nodes and stages. Valuable for corporate executives and sales associates.The stages in this process are customer orientation, coordinated effort, marketing concept, marketing strategy.
-
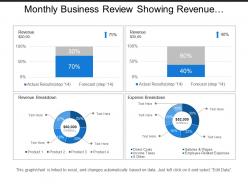 99284902 style essentials 2 financials 4 piece powerpoint presentation diagram infographic slide
Presenting this set of slides with name - Monthly Business Review Showing Revenue And Expense Breakdown. This is a four stage process. The stages in this process are Monthly Business Review, Monthly Business Report, Monthly Company Review.
-
 63584971 style layered vertical 4 piece powerpoint presentation diagram infographic slide
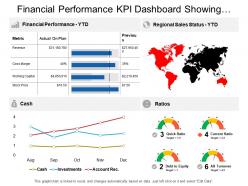
Presenting this set of slides with name - Financial Performance Kpi Dashboard Showing Regional Sales Status Cash And Ratios. This is a four stage process. The stages in this process are Financial Performance, Financial Report, Financial Review.
-
 21329409 style essentials 2 financials 4 piece powerpoint presentation diagram infographic slide
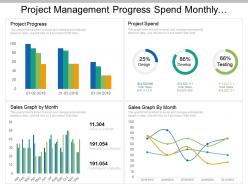
Presentation design is easy download and can be changed into other software programs such as JPEG and PDF. Personalize the PowerPoint template with brand name, logo and image. Presentation slide is available with choice to download with different nodes and stages. Completely editable PPT slide can be edited as colors, icons, and text. Easy to present amongst large set of audience as accessible in widescreen view option. PowerPoint graphic can be merged with Google slides as fully compatible with them.
-
 82472216 style essentials 2 financials 2 piece powerpoint presentation diagram infographic slide
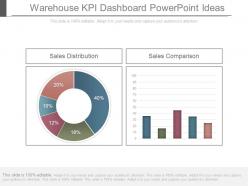
Presenting warehouse kpi dashboard powerpoint ideas. This is a warehouse kpi dashboard powerpoint ideas. This is a two stage process. The stages in this process are sales distribution, sales comparison.
-
 2871838 style essentials 2 financials 3 piece powerpoint presentation diagram infographic slide
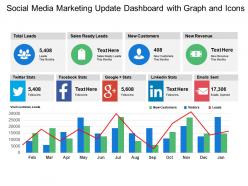
Presenting this set of slides with name - Social Media Marketing Update Dashboard With Graph And Icons. This is a three stage process. The stages in this process are Marketing Update, Marketing Strategy, Marketing Report.
-
 91578434 style essentials 2 financials 4 piece powerpoint presentation diagram infographic slide
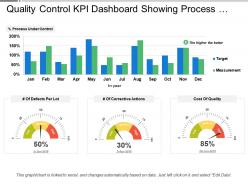
Presenting this set of slides with name - Quality Control Kpi Dashboard Showing Process Under Control And Cost Of Quality. This is a four stage process. The stages in this process are Quality Management, Quality Control, Quality Assurance.
-
 83214242 style essentials 2 financials 4 piece powerpoint presentation diagram infographic slide
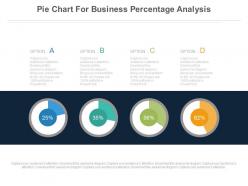
Presenting four pie charts for business percentage analysis powerpoint slides. This Power Point template slide has been crafted with graphic of four pie charts. This PPT slide contains the concept of business revenue and data analysis. Use this PPT slide for business and finance related presentations.
-
 38982853 style essentials 2 financials 5 piece powerpoint presentation diagram template slide
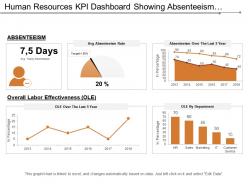
Presenting this set of slides with name - Human Resources Kpi Dashboard Showing Absenteeism Overall Labor Effectiveness. This is a five stage process. The stages in this process are Human Resource, Hrm, Human Capital.


