Financial Reviews and Accounting PPT Slides
-
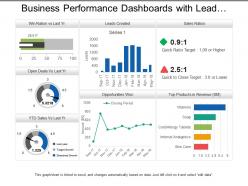 10067338 style essentials 2 dashboard 3 piece powerpoint presentation diagram infographic slide
Presenting, business performance dashboards with lead creation and sales ratios for cost efficiency and performance indication PPT presentation. Bright and informative PowerPoint presentation slides. Gives regulations to achieve business success and targets. Produces error-free execution. Acts as a model for planning future assignments for marketing capabilities. Fully editable by any user at any point in time. Performs a clarity of marketing and presentation objectives without creating any confusions and misconceptions. Simple to be projected to widescreen without degradation in quality.
-
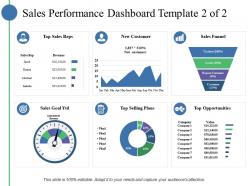 48126678 style essentials 2 financials 6 piece powerpoint presentation diagram infographic slide
Introducing sales performance dashboard top sales reps new customer PowerPoint template. Presentation slides are crafted with high quality resolution designs. PPT templates comes in standard and widescreen view. Instant download and can be converted into other formats i.e. JPEG and PDF. Perfect for business management experts and research development team. Replace the watermark with your company’s logo. Possess time saving qualities. Presentation slides are well-matched with Google slides. Fast download and effortlessly inclusion in your presentation.
-
 Various Types Of Blockchain Virtual Assets Security Tokens Managing Digital Wealth BCT SS
The following slide depicts details about security tokens to offer benefits to investors. It includes elements such as stocks, bonds, real world assets, improved liquidity, foster innovation, transparency, automated payments, etc. Increase audience engagement and knowledge by dispensing information using Various Types Of Blockchain Virtual Assets Security Tokens Managing Digital Wealth BCT SS This template helps you present information on Four stages. You can also present information on Improved Liquidity, Foster Innovation, Offers Transparency using this PPT design. This layout is completely editable so personaize it now to meet your audiences expectations.
-
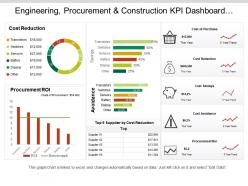 19159398 style essentials 2 financials 5 piece powerpoint presentation diagram template slide
You can use this PPT slideshow very easily as it is fully customizable. You can effortlessly insert or remove any diagrammatic representation from the given template. The font size, font color and font style can be easily edited. This graph PPT is linked to excel and changes automatically based on the data you enter. You can save the deck in either PDF or JPG format. To make any changes in the PPT slideshow, simply follow the instructions given in the sample slides. The size, color and orientation of all shapes are 100% customizable, so don’t waste any further time and download this presentation.
-
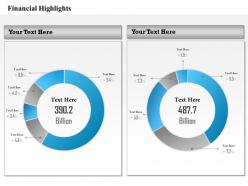 54172170 style essentials 2 financials 1 piece powerpoint presentation diagram infographic slide
Presentation design can be downloaded and saved into JPEG and PDF. Choice of insertion of logo and icons as per the business need. Adaptable to wide screen view without the problem of pixilation. Easy to comprehend info graphic format. Completely editable images, colors and text. Accessible with different nodes and stages as required. PPT slides are fully compatible with Google slides.
-
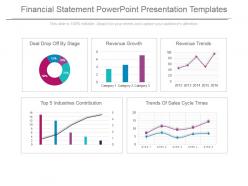 98827662 style essentials 2 financials 5 piece powerpoint presentation diagram infographic slide
Stunning financial statement PowerPoint design. Fit to be used with Google slides. Replace the images, text and the content in the slide design. Change the size, style and orientation of the slides. Use your company’s name or brand name to make it your own presentation template. Beneficial for managers, professors, marketers, etc. Possess great quality for better understanding and error-free performance. Flexible option for conversion in PDF or JPG formats. Available in Widescreen format also. Useful for making business plan and strategies.
-
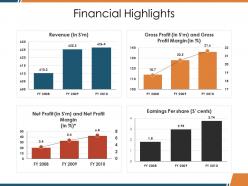 60786145 style essentials 2 financials 4 piece powerpoint presentation diagram infographic slide
Presenting this set of slides with name - Financial Highlights. This is a four stage process. The stages in this process are Earnings Per Share, Net Profit, Revenue, Gross Profit, Business.
-
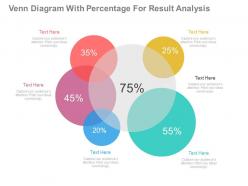 25786925 style cluster venn 6 piece powerpoint presentation diagram infographic slide
Completely editable content including fonts, text, colors. Compatible with number of software options. Modify the PPT design with company image and logo. Excellence in picture quality even on wide screen output. Compatible with Google slides. Adaptable PPT designs as can be converted into JPG and PDF. Suitable for business, sales, marketing, finance, IT, accounts sectors.
-
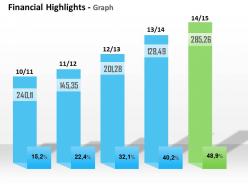 59275642 style essentials 2 financials 1 piece powerpoint presentation diagram infographic slide
100% customizable Presentation designs, text, font, colors and layout, shading etc. Unaffected High resolution PPT slides , Compatible with the graphic software’s and Google slides, Convertible into various file formats like JPG or PDF, Easy to replace dummy PPT images data and can insert company name or logo also, smooth downloading process, Extensive approach of inscribing the significant topic which is quite beneficial for financial analysts, finance professionals from different sectors.
-
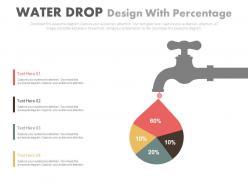 64226671 style essentials 2 financials 4 piece powerpoint presentation diagram infographic slide
The PowerPoint presentation ensures proofing and editing with ease. Presentation slide is of utmost use to management professionals, big or small organizations and business startups. Text and graphic can be put on show in the same PPT slide. PPT diagram supports recasting the color, size and orientation according to the requirement. High resolution in color and art shape is offered by PPT slide.
-
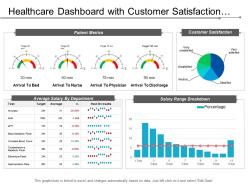 71364285 style essentials 2 financials 4 piece powerpoint presentation diagram infographic slide
Presenting this set of slides with name - Healthcare Dashboard With Customer Satisfaction And Patient Metrics. This is a four stage process. The stages in this process are Healthcare, Health Improvement, Medical Care.
-
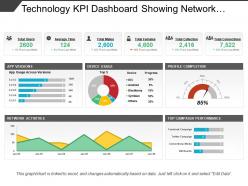 35806715 style essentials 2 financials 5 piece powerpoint presentation diagram infographic slide
Introducing Technology KPI dashboard showing network activities PPT design. Quick download and simple to convert into JPEG and PDF document. High quality presentation slide comes with editing options as color, text and font can be edited at any stage. Preference to display PowerPoint template in standard and widescreen display view. Presentation graphic is accessible with different nodes and stages. Easy to present with large audience. Amend the design with corporate name and icon.
-
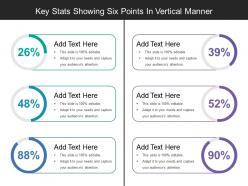 46755309 style layered vertical 6 piece powerpoint presentation diagram infographic slide
Presenting this set of slides with name - Key Stats Showing Six Points In Vertical Manner. This is a six stage process. The stages in this process are Stats, Statistics, Data.
-
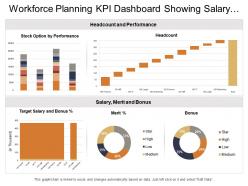 16374708 style essentials 2 financials 5 piece powerpoint presentation diagram infographic slide
Presenting this set of slides with name - Workforce Planning Kpi Dashboard Showing Salary Merit Bonus Headcount And Performance. This is a five stage process. The stages in this process are Staff, Personnel, Workforce.
-
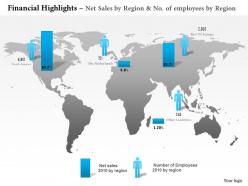 35117122 style essentials 2 financials 1 piece powerpoint presentation diagram infographic slide
Transform the presentation with business information i.e. sign and design. Pre-designed PPT slide assist you in saving both your time and effort. Choice to add or remove content in the design. Text and font can be easily altered as the PowerPoint template is absolutely editable. Presentation layout exhibit in both standard and widescreen slide. Adaptable as can be adapted in JPEG or PDF documents. Perfect for finance analyst, global financial planning experts, accounts management team etc.
-
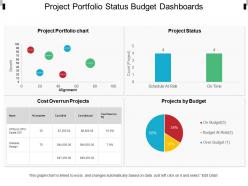 34895846 style essentials 2 financials 4 piece powerpoint presentation diagram infographic slide
Presenting, project portfolio status budget dashboards. This PPT slide believes in delivering a pleasant and great experience to the customers and can be picked by professionals for a great experience. The color of the pie chart sections and text areas can easily be edited according to your need. This PPT slide is also agreeable with google slides and accessible in Fullscreen version. Offhand conversion into PDF/ JPG format. Simple insertion of company trade name/logo.
-
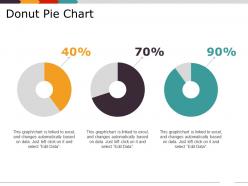 8043592 style division donut 3 piece powerpoint presentation diagram infographic slide
Presenting Donut Pie Chart Presentation Design PowerPoint slide. Easy to download PPT layout and can be saved in different formats like JPG, PDF and PNG. This PowerPoint slide is completely editable so you can modify, font type, font color, shape and image according to your requirements. This Google Slides compatible PPT is available in 4:3 and 16:9 aspect ratios.
-
 98287998 style essentials 2 financials 6 piece powerpoint presentation diagram infographic slide
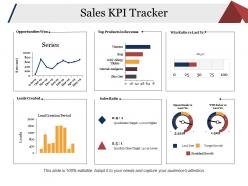
Presenting this set of slides with name - Sales Kpi Tracker Presentation Examples. This is a six stage process. The stages in this process are Opportunities Won, Top Products In Revenue, Win Ratio Vs Last, Leads Created, Sales Ratio.
-
 19785014 style essentials 2 financials 4 piece powerpoint presentation diagram infographic slide
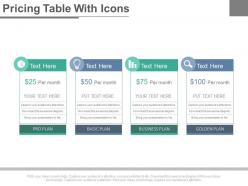
The visuals bear a high-class image display with no error of pixilation. The option of unlimited customization stays with you to experiment with the colour scheme, orientation features, and size adjustment. Save the said template in various file formats with an easy download option. The templates are fully congruent to Google slides. Explore the feasible options to recast the slides with a complete guide that follows the Ppt.
-
 Financial management kpi metrics dollars ppt powerpoint presentation styles
Presenting this set of slides with name Financial Management KPI Metrics Dollars Ppt Powerpoint Presentation Styles. This is a three stage process. The stages in this process are Financial Management, Gross Profit, Operating Profit, Net Profit, Donut. This is a completely editable PowerPoint presentation and is available for immediate download. Download now and impress your audience.
-
 75072055 style essentials 2 financials 3 piece powerpoint presentation diagram infographic slide
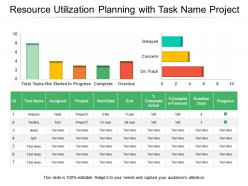
Presenting this set of slides with name - Resource Utilization Planning With Task Name Project. This is a three stage process. The stages in this process are Resource Management, Resource Utilization, Resource Allocation.
-
 91540265 style essentials 2 financials 6 piece powerpoint presentation diagram infographic slide
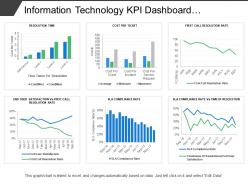
Presenting this set of slides with name - Information Technology Kpi Dashboard Showing Cost Per Ticket Sla Compliance Rate. This is a six stage process. The stages in this process are Information Technology, It, Iot.
-
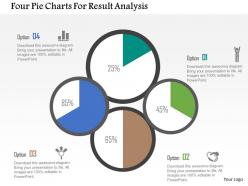 62390824 style division pie 4 piece powerpoint presentation diagram infographic slide
High quality visuals with splendid resolution. 100 percent editable PPT slide templates. Aesthetically designed and professionally proficient. Include or exclude the slide content at your ease and requirement. Compatible with several software options. Harmonious with numerous format options life JPEG, JPG or PDF. Ease of personalization with your company specific name, logo and or trademark.
-
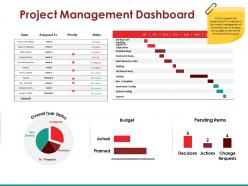 82123075 style essentials 2 financials 4 piece powerpoint presentation diagram infographic slide
Presenting this set of slides with name - Project Management Dashboard Powerpoint Slide Ideas. This is a four stage process. The stages in this process are Overall Task Status, Budget, Pending Items, Decisions.
-
 3807339 style essentials 2 financials 4 piece powerpoint presentation diagram infographic slide
Presenting this set of slides with name - Progress Report Pie Chart Graph. This is a four stage process. The stages in this process are Progress Report, Growth Report, Improvement Report.
-
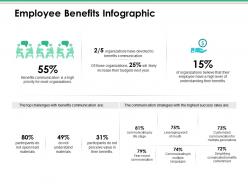 53545004 style essentials 2 financials 2 piece powerpoint presentation diagram infographic slide
Presenting this set of slides with name - Employee Benefits Infographic Ppt Infographic Template Professional. This is a two stage process. The stages in this process are Business, Management, Strategy, Analysis, Communication.
-
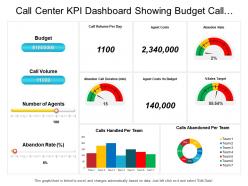 54443813 style essentials 2 financials 4 piece powerpoint presentation diagram infographic slide
Presenting this set of slides with name - Call Center Kpi Dashboard Showing Budget Call Volume Agent Costs Percentage Sales Target. This is a four stage process. The stages in this process are Call Center Agent, Customer Care, Client Support.
-
 26516622 style essentials 2 financials 2 piece powerpoint presentation diagram infographic slide
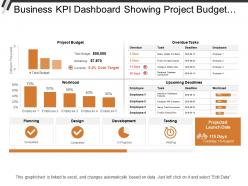
Presenting this set of slides with name - Business Kpi Dashboard Showing Project Budget Overdue Tasks And Workload. This is a two stage process. The stages in this process are Business Dashboard, Business Kpi, Business Performance.
-
 60182454 style essentials 2 financials 4 piece powerpoint presentation diagram template slide
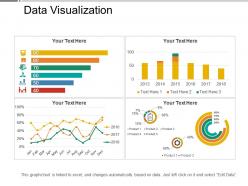
Presenting this Data Visualization PowerPoint slide. This PPT presentation is Google Slides compatible hence it is easily accessible. You can download and save this PowerPoint layout in different formats like PDF, PNG, and JPG. This PPT theme is available in both 4:3 and 16:9 aspect ratios. As this PowerPoint template is 100% editable, you can modify color, font size, font type, and shapes as per your requirements.
-
 10606351 style essentials 2 financials 4 piece powerpoint presentation diagram infographic slide
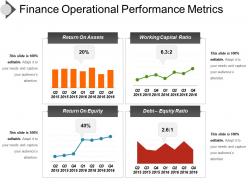
Introducing finance operational performance metrics PPT diagram. Exquisitely coordinated PPT design template beneficial for various business professionals. Easily resizable shapes, patterns, and matters etc. Genuine and admissible PPT Image with pliant data options. Adequately compatible with all operating softwares and all Google Slides. Easily convertible to other file formats such as PDF or JPG. Adequate space available to add headings and subheadings. Unaffected high resolution PPT graphic when projected on huge screen.
-
 75180264 style essentials 2 financials 8 piece powerpoint presentation diagram infographic slide
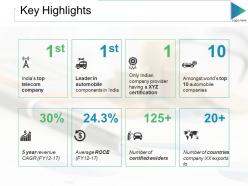
Presenting this set of slides with name - Key Highlights Ppt Slides Microsoft. This is a eight stage process. The stages in this process are Leader In Automobile, Business, Marketing, Finance.
-
 Pmo governance including promote leadership
Presenting this set of slides with name PMO Governance Including Promote Leadership. This is a six stage process. The stages in this process are Change Management, PMO Governance Structure, Project Governance. This is a completely editable PowerPoint presentation and is available for immediate download. Download now and impress your audience.
-
 36196032 style essentials 2 financials 3 piece powerpoint presentation diagram infographic slide
Miraculous presented PowerPoint graphics which are very useful for the business analysts , business students and professionals etc., Easily access able into divergent file compositions like PDF or JPG , Insert able trade name or mark or company logo or emblem, Wholly customize able matters, PowerPoint image, structure, intensity etc., Adaptable with all the operating software’s and Google drives.
-
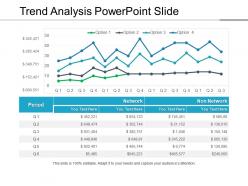 82729957 style essentials 2 financials 4 piece powerpoint presentation diagram infographic slide
Presenting trend analysis PowerPoint template. Access to edit the content, style, size and orientation of the PPT slides. Extremely spacious to cover all the aspects of the company profile. High resolution images do not pixelate when projected on wide screen. Personalize the PPT with your company name and logo. Modify the presentation elements as per the need of an hour. Compatible with numerous software and format options. Used by entrepreneurs, marketers, managerial department, stakeholders and students. Self-explanatory and intellectual slide charts.
-
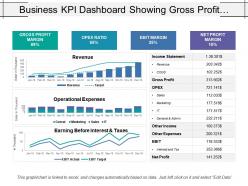 6687541 style essentials 2 financials 3 piece powerpoint presentation diagram infographic slide
Presenting this set of slides with name - Business Kpi Dashboard Showing Gross Profit Margin Opex Ratio And Ebit Margin. This is a three stage process. The stages in this process are Business Dashboard, Business Kpi, Business Performance.
-
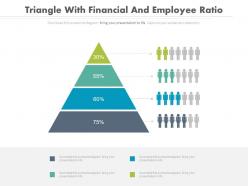 73113414 style essentials 2 financials 4 piece powerpoint presentation diagram infographic slide
Presenting triangle with financial and employee ratio analysis powerpoint slides. This Power Point template diagram with graphic of triangle and finance icons diagram. This PPT diagram contains the concept of employee ratio analysis. Use this PPT diagram for business and finance related presentations.
-
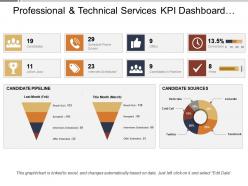 65650500 style essentials 2 financials 4 piece powerpoint presentation diagram infographic slide
Presenting this set of slides with name - Professional And Technical Services Kpi Dashboard Showing Recruitment And Hiring. This is a four stage process. The stages in this process are Professional And Technical Services, Services Management, Technical Management.
-
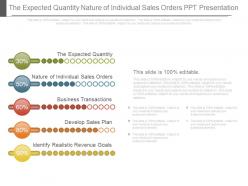 52250883 style essentials 2 financials 5 piece powerpoint presentation diagram infographic slide
Simple and swift to download without unnecessary steps. Fully modifiable color and contrasts of presentation graphics. Change orientation, size and outlines of PPT images to your liking. Undiminished high resolution graphics post editing. Insert company name, logo, brand name, tagline etc. to personalize. Incorporate this slide anywhere in your own presentation.The stages in this process are finance, business, management.
-
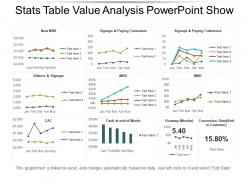 45829420 style essentials 2 financials 9 piece powerpoint presentation diagram infographic slide
Presenting stats table value analysis PowerPoint show. This layout offers you plenty of space to put in titles and sub titles. High resolution-based layout, does not change the image even after resizing. This presentation icon is fully compatible with Google slides. Quick downloading speed and simple editing options in color text and fonts.PPT icons can easily be changed into JPEG and PDF applications. This diagram has been designed for entrepreneurs, corporate and business managers. Easy to use, edit and you can design attractive slides within few minutes.
-
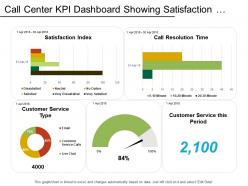 55701807 style essentials 2 financials 5 piece powerpoint presentation diagram infographic slide
Presenting this set of slides with name - Call Center Kpi Dashboard Showing Satisfaction Index Customer Retention. This is a five stage process. The stages in this process are Call Center Agent, Customer Care, Client Support.
-
 Digital Currency Exchange Icon Business
Presenting our set of slides with name Digital Currency Exchange Icon Business. This exhibits information on three stages of the process. This is an easy to edit and innovatively designed PowerPoint template. So download immediately and highlight information on Digital Currency, Exchange Icon Business.
-
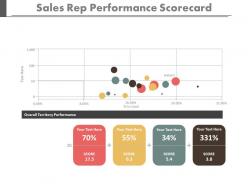 48684357 style essentials 2 financials 4 piece powerpoint presentation diagram infographic slide
Simple, hassle free and swift to download. Absolutely editable PPT infographics – alter the color scheme and contrast. No change in high resolution of PPT images after editing. Add text to supplement the graphics to suit the context of your presentation. Modify the size and orientation of presentation icons to your liking. Insert your company logo, brand name, trademark etc.
-
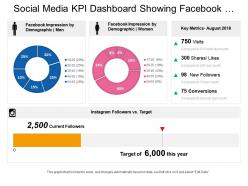 33914793 style essentials 2 financials 4 piece powerpoint presentation diagram infographic slide
Presenting this set of slides with name - Social Media Kpi Dashboard Showing Facebook Impression By Demographic Instagram Key Metrics. This is a four stage process. The stages in this process are Social Media, Digital Marketing, Social Marketing.
-
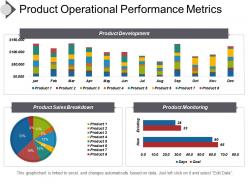 85594847 style essentials 2 financials 3 piece powerpoint presentation diagram infographic slide
Easily editable as color, text and layout are editable as required. Presentation template is accessible in similar designs with different nodes and stages. PowerPoint slide is attainable in standard and widescreen view. Precise download and can be easily integrate in the presentation. PPT design is downloadable with different nodes and stages. Presentation graphic is designed with high quality resolution design. Presentation diagram is well familiar with Google slides and can be merged with them.
-
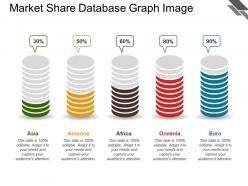 52724883 style concepts 1 growth 5 piece powerpoint presentation diagram infographic slide
Presenting market share database graph image. This is a market share database graph image. This is a five stage process. The stages in this process are market share, usage share, market structure.
-
 56399320 style essentials 2 financials 3 piece powerpoint presentation diagram infographic slide
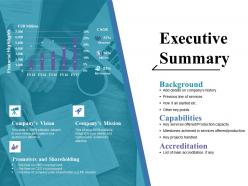
Presenting this set of slides with name - Executive Summary Ppt Pictures. This is a three stage process. The stages in this process are Background, Capabilities, Accreditation, Promoters And Shareholding, Business.
-
 19714613 style essentials 2 financials 6 piece powerpoint presentation diagram infographic slide
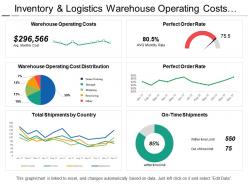
Presenting inventory and logistics warehouse operating costs dashboard PPT slideshow. Editable charts, visuals, colors and text. Presentable and easy to comprehend info graphic format. The presentation template can be downloaded and saved in any desired format. Privilege of insertion of logo and trademarks for more personalization. Adaptable to wide screen view without the problem of pixilation. Can be used with Google slides. Easy to edit and customize as per your needs. Beneficial for industry professionals, managers, executives, researchers, sales people, etc.
-
 18275156 style essentials 2 financials 6 piece powerpoint presentation diagram infographic slide
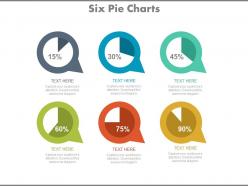
Six pie charts for financial percentage analysis PowerPoint Slide. Editable shapes, colors and text. Presentable and easy to comprehend info graphic format. Presentation designs accessible in standard and widescreen view. The presentation template can be downloaded and saved in any desired format. Privilege of insertion of logo and trademarks for more personalization. Fully adaptable PPT slides with Google slides. Easy to edit and customize as per your needs.
-
 26915225 style essentials 2 financials 2 piece powerpoint presentation diagram infographic slide
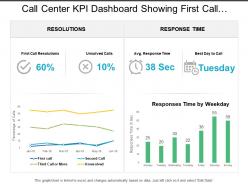
Presenting call center KPI dashboard showing first call resolution response time. This deck offers you plenty of space to put in titles and sub titles. This template is Excel linked just right click to input your information. High resolution-based layout, does not change the image even after resizing. This presentation icon is fully compatible with Google slides. Quick downloading speed and simple editing options in color text and fonts.PPT icons can easily be changed into JPEG and PDF applications.
-
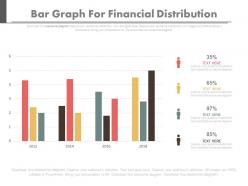 71097059 style essentials 2 financials 4 piece powerpoint presentation diagram infographic slide
Amendable PowerPoint presentation backgrounds. Technology and action oriented diagrams. Clearly describes the business and finance related information without creating any doubts. Performs remarkably and wraps up the entire presentation on time. Enhances the image of the organisation with their impressive layout. Offers orientation and ungrouping the objects. Can be conveniently modified without any specific training.
-
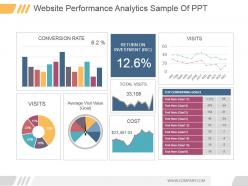 97152031 style essentials 2 financials 3 piece powerpoint presentation diagram infographic slide
Presenting website performance analytics sample of ppt. This is a website performance analytics sample of ppt. This is a three stage process. The stages in this process are conversion rate, visits, average visit value goal, return on investment ric, total visits, cost, visits, top converting goals, jan, feb, mar, apr, may, jun, jul, aug, sep, oct, nov, dec, goal.
-
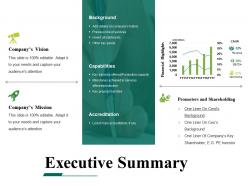 46927926 style division non-circular 5 piece powerpoint presentation diagram infographic slide
Presenting executive summary powerpoint templates microsoft. This is a executive summary powerpoint templates microsoft. This is a four stage process. The stages in this process are accreditation, capabilities, background, promoters and shareholding.
-
 27459295 style essentials 2 financials 4 piece powerpoint presentation diagram infographic slide
Introducing information technology KPI dashboard showing overdue tasks deadlines PowerPoint template. PPT slides offer a thorough editable customization of font, color, and orientation of high powered info-graphics. Quick and easy downloading process. Suitable for business managers and professionals. Sufficient space is available for the easy placement of desired content. Templates are compatible with wide range of software such as pdf/jpeg/Jpg. PPT design can be access in standard and widescreen view. Editing instructions are explained step by step.
-
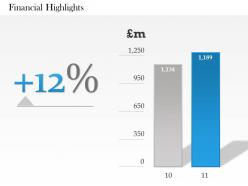 43874460 style essentials 2 financials 1 piece powerpoint presentation diagram infographic slide
We are proud to present our 0414 profit and financial analysis diagram. Our profit and fianacial analysis diagram Powerpoint Templates provide the skeleton of your presentation. Flesh them out with your weighty ideas. Our profit and fianacial analysis diagram Powerpoint Templates are the sinews of your lecture. Give them the muscle of your vibrant thoughts.
-
 32808306 style essentials 2 financials 8 piece powerpoint presentation diagram infographic slide
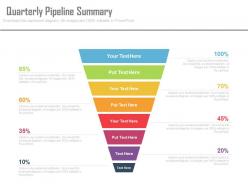
New quarterly pipeline summary PPT Slide. Proper balance of colors, shapes and stages in relation to presentation topic. High resolution and fine quality PowerPoint slides. Easy and quick downloading. Compatible with multiple software options available both online and offline. Widely used by business owners, strategists, marketers, investors, financial executives, professors and students. Guidance for executing the changes has been provided for assistance. Modify and personalize the presentation by including the company name and logo.
-
 34140691 style essentials 2 financials 4 piece powerpoint presentation diagram infographic slide
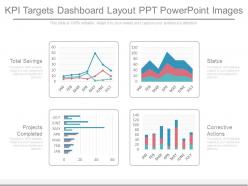
Presenting kpi targets dashboard layout ppt powerpoint images. This is a kpi targets dashboard layout ppt powerpoint images. This is a four stage process. The stages in this process are total savings, projects completed, status, corrective actions.
-
 64816763 style essentials 2 financials 2 piece powerpoint presentation diagram infographic slide
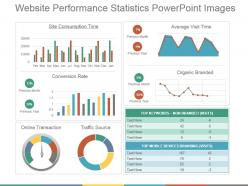
We present to you our website performance statistics PowerPoint images. You can change the placement, the size or the color of the graphical images used in the template. You can make numerous changes by following the instructions given in sample slides, as this PPT is fully editable. This template can be saved in either PDF or JPG format. You can view the presentation in widescreen display ratio of 16:9 or standard size display ratio of 4:3. So download, edit and present it.
-
 23707509 style division pie 5 piece powerpoint presentation diagram infographic slide
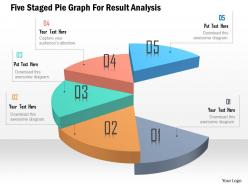
We are proud to present our five staged pie graph for resul analysis powerpoint template. Five staged pie graph has been used to craft this power point template diagram. This PPT diagram contains the concept of result analysis. Use this PPT diagram for business and marketing related presentations.
-
 6510982 style essentials 2 financials 3 piece powerpoint presentation diagram infographic slide
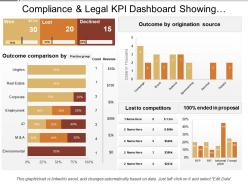
Presenting this set of slides with name - Compliance And Legal Kpi Dashboard Showing Outcome Comparison. This is a three stage process. The stages in this process are Compliance And Legal, Legal Governance, Risk Management.
-
 60356460 style essentials 2 financials 6 piece powerpoint presentation diagram infographic slide
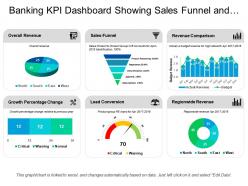
Presenting this set of slides with name - Banking Kpi Dashboard Showing Sales Funnel And Overall Revenue. This is a six stage process. The stages in this process are Banking, Finance, Money.


