Financial Reviews and Accounting PPT Slides
-
 75323356 style essentials 2 financials 1 piece powerpoint presentation diagram infographic slide
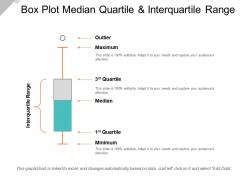
Presenting Box Plot Median Quartile And Interquartile Range template. This slide supports both the widescreen (16:9) and the standard screen aspect ratios(4:3). Add appealing content like charts and graphs to the presentation. The slide is also compatible with Google Slides. This PPT can be converted into common image formats like JPEG, PNG or document formats such as PDF. High-quality graphics will prevent the deterioration of slide components.
-
 22199668 style essentials 2 financials 2 piece powerpoint presentation diagram infographic slide
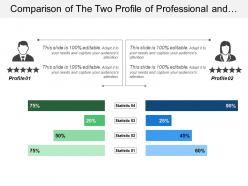
Presenting this set of slides with name - Comparison Of The Two Profile Of Professional And Four Statistics. This is a two stage process. The stages in this process are Comparison Of Two, Compare, comeptitive analysis.
-
 21046986 style essentials 2 financials 3 piece powerpoint presentation diagram infographic slide
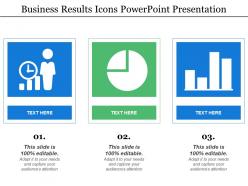
Presenting this set of slides with name - Business Results Icons Powerpoint Presentation. This is a three stage process. The stages in this process are Business Results, Business Outcomes, Business Output.
-
 10148451 style essentials 2 financials 4 piece powerpoint presentation diagram infographic slide
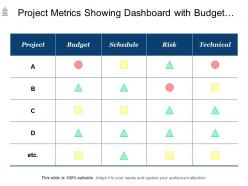
Presenting this set of slides with name - Project Metrics Showing Dashboard With Budget Schedule Risk. This is a four stage process. The stages in this process are Project Kpis, Project Dashboard, Project Metrics.
-
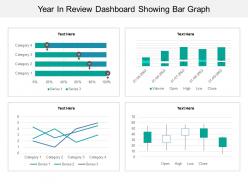 72499330 style essentials 2 financials 4 piece powerpoint presentation diagram infographic slide
Presenting this set of slides with name - Year In Review Dashboard Showing Bar Graph. This is a four stage process. The stages in this process are Year In Review, Yearly Highlights, Countdowns.
-
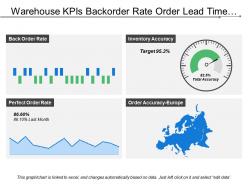 26030290 style essentials 2 financials 4 piece powerpoint presentation diagram infographic slide
Presenting this set of slides with name - Warehouse Kpis Backorder Rate Order Lead Time Inventory Accuracy. This is a four stage process. The stages in this process are Warehouse Kpi, Warehouse Dashboard, Warehouse Metrics.
-
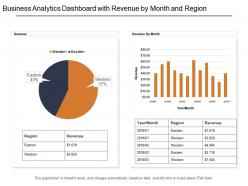 29450888 style essentials 2 financials 2 piece powerpoint presentation diagram infographic slide
This is a two stage process. The stages in this process are Business Analytics, BA, Organizations Data.
-
 Cost reduction budget strategy icon
Presenting our set of slides with Cost Reduction Budget Strategy Icon. This exhibits information on three stages of the process. This is an easy to edit and innovatively designed PowerPoint template. So download immediately and highlight information on Cost Reduction Budget Strategy Icon.
-
 Receiving Salary In Envelope After Increment Icon
Presenting our set of slides with Receiving Salary In Envelope After Increment Icon. This exhibits information on three stages of the process. This is an easy to edit and innovatively designed PowerPoint template. So download immediately and highlight information on Receiving Salary In Envelope After Increment Icon.
-
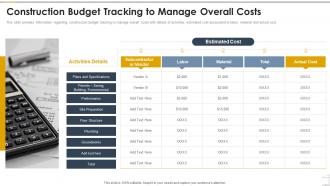 Construction Budget Tracking To Manage Overall Costs Construction Playbook
This slide provides information regarding construction budget tracking to manage overall costs with details of activities, estimated cost associated to labor, material and actual cost. Increase audience engagement and knowledge by dispensing information using Construction Budget Tracking To Manage Overall Costs Construction Playbook. This template helps you present information on one stages. You can also present information on Plans and Specifications, Site Preparation, Groundworks, Floor Structure using this PPT design. This layout is completely editable so personaize it now to meet your audiences expectations.
-
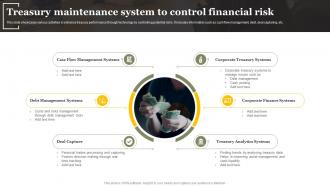 Treasury Maintenance System To Control Financial Risk
This slide showcases various activities to enhance treasury performance through technology by controlling potential risks. It includes information such as cash flow management, debt, deal capturing, etc. Introducing our premium set of slides with Treasury Maintenance System To Control Financial Risk. Ellicudate the six stages and present information using this PPT slide. This is a completely adaptable PowerPoint template design that can be used to interpret topics like Debt Management Systems, Deal Capture, Treasury Analytics Systems. So download instantly and tailor it with your information.
-
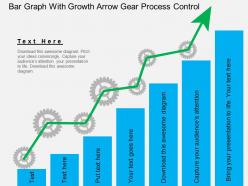 89876605 style concepts 1 growth 7 piece powerpoint presentation diagram template slide
Presenting ga bar graph with growth arrow gear process control flat powerpoint design. This Power Point template diagram has been crafted with graphic of bar graph and growth arrow. This PPT diagram contains the concept of process control and growth indication. Use this PPT diagram and build a quality presentation.
-
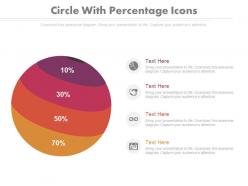 4870697 style essentials 2 financials 4 piece powerpoint presentation diagram infographic slide
Presenting four staged circle with percentage icons powerpoint slides. This Power Point template diagram slide has been crafted with graphic of four staged circle and percentage icons. This PPT diagram slide contains the concept of financial analysis representation. Use this PPT slide for finance and business related presentations.
-
 1813288 style essentials 2 financials 4 piece powerpoint presentation diagram infographic slide
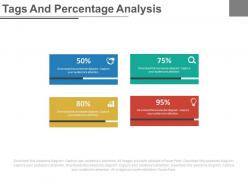
Presenting four colored tags and percentage analysis powerpoint slides. This Power Point template slide has been crafted with graphic of four colored tags and percentage icons. This PPT slide contains the concept of financial data analysis representation. Use this PPT slide for business and finance related presentations.
-
 44846921 style essentials 2 financials 7 piece powerpoint presentation diagram infographic slide
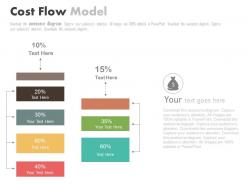
Presenting seven staged cost flow model powerpoint slides. This Power Point template slide has been crafted with graphic of seven staged cost flow model. This PPT slide contains the concept of financial analysis. Use this PPT slide for business and finance related presentations.
-
 34577047 style essentials 2 financials 5 piece powerpoint presentation diagram infographic slide
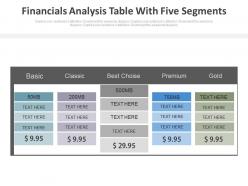
Presenting financial analysis table with five segments powerpoint slides. This Power Point template diagram with graphic of finance table with five segments. This PPT diagram contains the concept of financial analysis. Use this PPT diagram for business and finance related presentations.
-
 58955075 style essentials 2 financials 3 piece powerpoint presentation diagram infographic slide
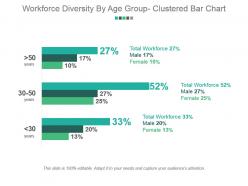
Presenting workforce diversity by age group clustered bar chart powerpoint slide deck template. This is a workforce diversity by age group clustered bar chart powerpoint slide deck template. This is a three stage process. The stages in this process are total workforce, male, female.
-
 12565584 style essentials 2 financials 4 piece powerpoint presentation diagram infographic slide
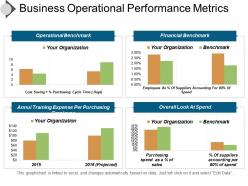
Presenting business operational performance metrics PPT slide. PPT can be easily updated by anyone. Our professional PPT experts are available to support you in updating the design. Modify and personalize as per your business preferences. PPT is compatible with Google Slides and Microsoft PowerPoint. Instant and quick downloading is available. Download and convert the design into JPEG and PDF formats.
-
 55959736 style essentials 2 financials 4 piece powerpoint presentation diagram infographic slide
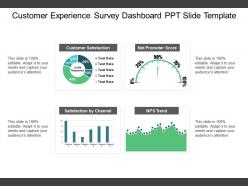
Presenting customer experience survey dashboard ppt slide template. This is a customer experience survey dashboard ppt slide template. This is a four stage process. The stages in this process are survey, forecasting, statistics.
-
 37654973 style essentials 2 financials 5 piece powerpoint presentation diagram infographic slide
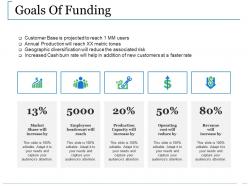
Presenting this set of slides with name - Goals Of Funding Ppt Styles. This is a five stage process. The stages in this process are Market Share Will Increase By, Employees Headcount Will Reach, Production Capacity Will Increase By, Operating Cost Will Reduce By, Revenue Will Increase By.
-
 62882518 style essentials 2 financials 3 piece powerpoint presentation diagram infographic slide
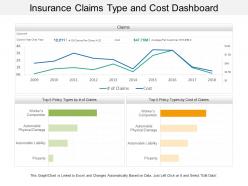
• Stunning match of topic and visuals. • Professional proficiency and brilliant craftsmanship. • Ease of personalization. • Ease of customization with desired contents. • Special assistance to execute the changes has been provided. • Compatibility with multiple numbers of formats. • Compatibility with numerous software options available both online and offline. • High resolution • Used by marketing and business professionals, students and teachers.
-
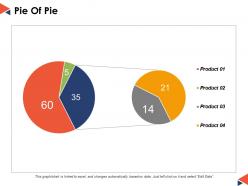 93728003 style essentials 2 financials 4 piece powerpoint presentation diagram infographic slide
This is a four stages process. The stages in this process are Pie Chart, Percentage, Marketing, Business, Analysis.
-
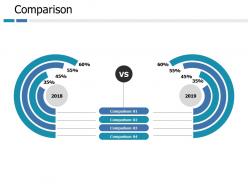 71317855 style essentials 2 compare 2 piece powerpoint presentation diagram infographic slide
Presenting this set of slides with name - Comparison Business Ppt Portfolio Slide Portrait. This is a two stage process. The stages in this process are Comparison, Planning, Marketing, Finance, Strategy.
-
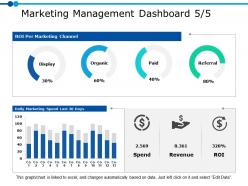 38417550 style essentials 2 financials 3 piece powerpoint presentation diagram infographic slide
Presenting this set of slides with name - Marketing Management Dashboard 5 5 Ppt Powerpoint Presentation Gallery Graphics. This is a three stage process. The stages in this process are Business, Management, Strategy, Analysis, Marketing.
-
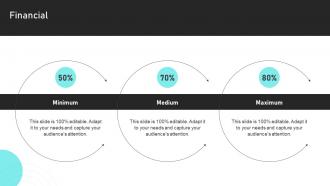 Financial Sales Risk Analysis To Improve Revenues And Team Performance
Introducing Financial Sales Risk Analysis To Improve Revenues And Team Performance to increase your presentation threshold. Encompassed with three stages, this template is a great option to educate and entice your audience. Dispence information on Financial, using this template. Grab it now to reap its full benefits.
-
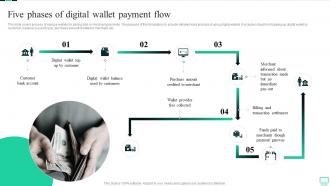 Five Phases Of Digital Wallet Payment Flow Omnichannel Banking Services
This slide covers process of using e wallets for paying bills or merchant payments. The purpose of this template is to provide detailed wise process of using digital wallets. It includes steps from topping up digital wallet by customer, balance is used to pay, purchase amount credited to merchant, etc. Increase audience engagement and knowledge by dispensing information using Five Phases Of Digital Wallet Payment Flow Omnichannel Banking Services. This template helps you present information on five stages. You can also present information on Transaction Settlement, Payment Gateway, Payment Flow using this PPT design. This layout is completely editable so personaize it now to meet your audiences expectations.
-
 Icon For Cost Comparison Of In House Employee And Freelancer
Presenting our set of slides with Icon For Cost Comparison Of In House Employee And Freelancer. This exhibits information on three stages of the process. This is an easy to edit and innovatively designed PowerPoint template. So download immediately and highlight information on Icon For Cost Comparison, House Employee And Freelancer.
-
 83621921 style concepts 1 opportunity 2 piece powerpoint presentation diagram infographic slide
We are proud to present our two hands for money exchange idea flat powerpoint design. This power point template diagram contains the graphic two hands. This PPT diagram contains the concept of money and idea exchange .Use this PPT diagram for business and finance related presentations.
-
 15995718 style essentials 2 financials 9 piece powerpoint presentation diagram infographic slide
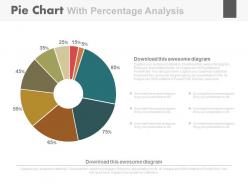
Presenting pie chart with percentage analysis and icons powerpoint slides. This Power Point template diagram has been crafted with graphic of pie chart and percentage diagram. This PPT diagram contains the concept of percentage analysis representation. Use this PPT diagram for business and finance related presentations.
-
 84797897 style essentials 2 financials 1 piece powerpoint presentation diagram infographic slide
Presenting blackboard with text boxes for financial analysis powerpoint slides. This Power Point template diagram slide has been crafted with graphic of black board and text boxes. This PPT diagram contains the concept of financial analysis. Use this PPT diagram for business and finance related presentations.
-
 35693496 style essentials 2 financials 2 piece powerpoint presentation diagram infographic slide
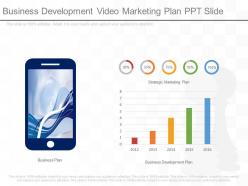
PPT slide supports resize, recolor and reverse the images. Good quality images can be used to compliment and reinforce message. Works well in Windows 7, 8, 10, XP, Vista and Citrix. Editing in presentation slide show can be done from anywhere by any device. Elegant and beautiful presentation which can be oriented and customized according to requirement.The stages in this process are marketing, communication, technology, finance, internet.
-
 96430418 style division pie 5 piece powerpoint presentation diagram infographic slide
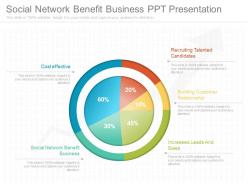
Presenting social network benefit business ppt presentation. This is a social network benefit business ppt presentation. This is a five stage process. The stages in this process are process, strategy, finance, marketing.
-
 43514932 style essentials 2 financials 3 piece powerpoint presentation diagram infographic slide
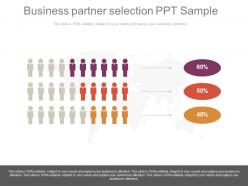
Presenting business partner selection ppt sample. This is a business partner selection ppt sample. This is a three stage process. The stages in this process are business, finance, teamwork, management, success.
-
 7558864 style essentials 2 financials 5 piece powerpoint presentation diagram infographic slide
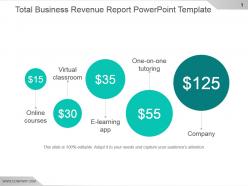
Presenting total business revenue report powerpoint template. This is a total business revenue report powerpoint template. This is a five stage process. The stages in this process are virtual classroom, online courses, e learning app, one on one tutoring, company.
-
 89946269 style essentials 2 financials 5 piece powerpoint presentation diagram infographic slide
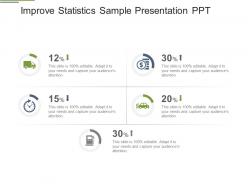
Introducing statistics PPT diagram. Cogently abstracted Presentation graphic makes it easy to interpret the related notion. Refine able PowerPoint diagram, matrix charts, designs, styles, patterns, and PowerPoint image. An exclusive tool perfect for business managers and management students. PowerPoint slide can be easily exportable to various formats like PDF or JPG. Well, versant with Google Slides and other operating systems.
-
 31520075 style essentials 2 financials 4 piece powerpoint presentation diagram infographic slide
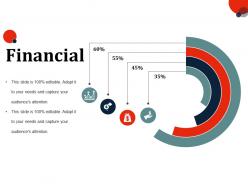
Presenting this set of slides with name - Financial Ppt Slides Example Introduction. This is a four stage process. The stages in this process are Finance, Business, Marketing, Percentage, Icons.
-
 6060612 style essentials 2 financials 2 piece powerpoint presentation diagram infographic slide
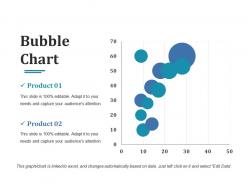
Presenting this set of slides with name - Bubble Chart Ppt Designs. This is a two stage process. The stages in this process are Bubble Chart, Finance, Business, Marketing, Analysis.
-
 39700101 style essentials 2 financials 5 piece powerpoint presentation diagram infographic slide
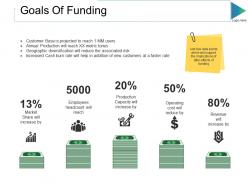
Presenting this set of slides with name - Goals Of Funding Ppt Slides Show. This is a five stage process. The stages in this process are Market Share Will Increase By, Employees Headcount Will Reach, Production Capacity Will Increase By, Operating Cost Will Reduce By, Revenue Will Increase By.
-
 46254657 style essentials 2 financials 4 piece powerpoint presentation diagram infographic slide
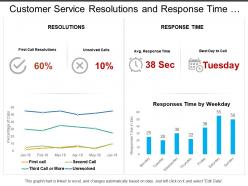
Presenting customer service resolutions and response time dashboard PPT template slide. This template slide is fully adjustable with Google Slide. You can edit the color, text style, font size of the template content as per need. The template is easy to download and can be saved in PDF, and JPEG formats. For guidance, additional instructional slides are available. Superior quality graphics are used. The quality of the slide image does not blur when viewed on a large screen. Dummy content can be replaced with other valuable information. You can personalize the template by adding your company name, and signature.
-
 57903478 style essentials 2 financials 6 piece powerpoint presentation diagram infographic slide
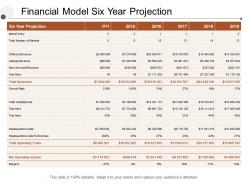
Presenting this set of slides with name - Financial Model Six Year Projection. This is a six stage process. The stages in this process are Financial Analysis, Income Statement, Balance Sheet.
-
 44729881 style essentials 2 financials 3 piece powerpoint presentation diagram infographic slide
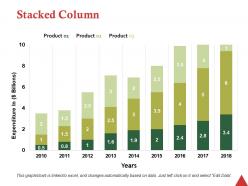
Presenting this set of slides with name - Stacked Column Ppt Professional Rules. This is a three stage process. The stages in this process are Business, Management, Strategy, Analysis, Marketing.
-
 76710034 style essentials 2 financials 4 piece powerpoint presentation diagram infographic slide
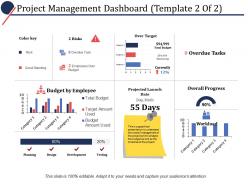
Presenting this set of slides with name - Project Management Dashboard Ppt Powerpoint Presentation File Graphic Images. This is a four stage process. The stages in this process are Business, Management, Marketing, Percentage, Product.
-
 68394288 style essentials 2 financials 3 piece powerpoint presentation diagram infographic slide
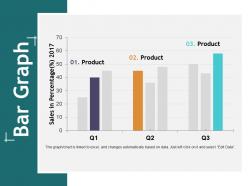
Presenting this set of slides with name - Bar Graph Ppt Show Graphic Images. This is a three stage process. The stages in this process are Business, Management, Strategy, Analysis, Marketing.
-
 Hand holding percentage rebate icon
Presenting this set of slides with name Hand Holding Percentage Rebate Icon. This is a three stage process. The stages in this process are Hand Holding Percentage Rebate Icon. This is a completely editable PowerPoint presentation and is available for immediate download. Download now and impress your audience.
-
 Bank value chain icon
Presenting this set of slides with name Bank Value Chain Icon. This is a two stage process. The stages in this process are Bank, Value Chain, Icon. This is a completely editable PowerPoint presentation and is available for immediate download. Download now and impress your audience.
-
 Deposit icon with dollar coin and arrow
Presenting this set of slides with name Deposit Icon With Dollar Coin And Arrow. This is a three stage process. The stages in this process are Deposit Icon With Dollar Coin And Arrow. This is a completely editable PowerPoint presentation and is available for immediate download. Download now and impress your audience.
-
 Case study xyz bank ppt powerpoint presentationmodel brochure
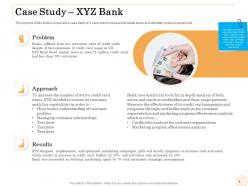
The purpose of this slide is to present a case study of a bank which increased its wallet share and ultimately reduced overall cost. Presenting this set of slides with name Case Study XYZ Bank Ppt Powerpoint Presentationmodel Brochure. This is a one stage process. The stages in this process are Problem, Approach, Results. This is a completely editable PowerPoint presentation and is available for immediate download. Download now and impress your audience.
-
 Three Components Of Technological Business Environment
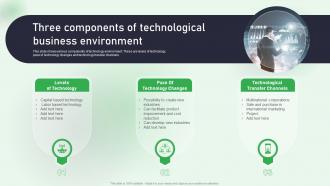
This slide shows various components of technology environment. These are levels of technology, pace of technology changes and technology transfer channels. Presenting our set of slides with Three Components Of Technological Business Environment. This exhibits information on three stages of the process. This is an easy to edit and innovatively designed PowerPoint template. So download immediately and highlight information on Levels Of Technology, Pace Technology Changes, Technological Transfer Channels.
-
 Strategies To Achieve Financial Stability In Small Business
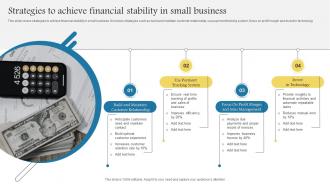
This slide covers strategies to achieve financial stability in small business. It involves strategies such as build and maintain customer relationship, use payment tracking system, focus on profit margin and invest in technology. Introducing our premium set of slides with name Strategies To Achieve Financial Stability In Small Business. Ellicudate the four stages and present information using this PPT slide. This is a completely adaptable PowerPoint template design that can be used to interpret topics like Customer Relationship, Sales Management, Profit Margin. So download instantly and tailor it with your information.
-
 61953732 style concepts 1 growth 1 piece powerpoint presentation diagram infographic slide
We are proud to present our 0714 business consulting business progress report design powerpoint slide template. Come forth with the plans you have so carefully laid out. Use this business consulting diagram to inject values into your group and see them bond to achieve success. Excite your audience with the brilliance of your thoughts
-
 1757425 style essentials 2 financials 4 piece powerpoint presentation diagram infographic slide
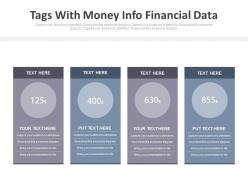
Presenting four tags with money info financial data powerpoint slides. This is a four tags with money info financial data powerpoint slides. This is a four stage process. The stages in this process are financials.
-
 32148489 style essentials 2 financials 3 piece powerpoint presentation diagram infographic slide
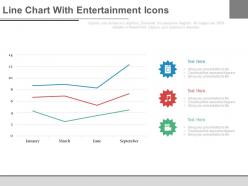
Presenting line chart with entertainment icons month based analysis powerpoint slides. This is a line chart with entertainment icons month based analysis powerpoint slides. This is a three stage process. The stages in this process are financials.
-
 57407272 style essentials 2 financials 4 piece powerpoint presentation diagram infographic slide
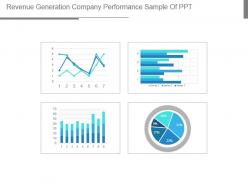
Presenting revenue generation company performance sample of ppt. This is a revenue generation company performance sample of ppt. This is a four stage process. The stages in this process are business, marketing, graph, percentage, success.
-
 29323397 style essentials 1 location 2 piece powerpoint presentation diagram infographic slide
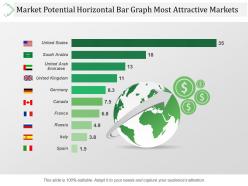
Presenting market potential horizontal bar graph most attractive markets ppt images. This is a market potential horizontal bar graph most attractive markets ppt images. This is a two stage process. The stages in this process are business, marketing, strategy, finance, investment, success, location, geography.
-
 44914108 style essentials 2 financials 2 piece powerpoint presentation diagram infographic slide
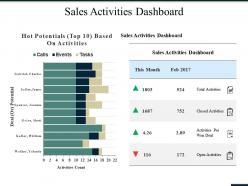
Presenting this set of slides with name - Sales Activities Dashboard Ppt Summary Maker. This is a two stage process. The stages in this process are Sales Activities Dashboard, This Month, Deal, Activities Count, Business.
-
 61038869 style essentials 2 financials 4 piece powerpoint presentation diagram infographic slide
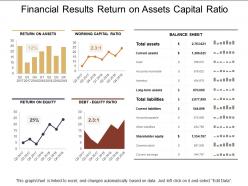
Sharing financial results return on assets capital ratio presentation slide. PowerPoint design can be downloaded and save into JPG and PDF format. PPT template can be downloaded in standard and widescreen view. Fully compliant slide design with Google slides. Easy to edit as color, text and font can be amended. Perfect to share business communication as pixels don’t break even when shared on large screen. Presentation graphic can be accessed with different nodes and stages.
-
 50478802 style essentials 2 financials 5 piece powerpoint presentation diagram infographic slide
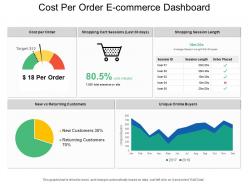
Presenting this set of slides with name - Cost Per Order E Commerce Dashboard. This is a five stage process. The stages in this process are Mercantilism, Commercialism, Ecommerce.
-
 73349590 style essentials 2 financials 5 piece powerpoint presentation diagram infographic slide
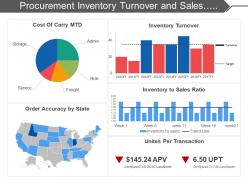
Presenting this set of slides with name - Procurement Inventory Turnover And Sales Ratio Dashboard. This is a five stage process. The stages in this process are Purchase, Procurement, Buy.
-
 93434594 style essentials 2 financials 6 piece powerpoint presentation diagram infographic slide
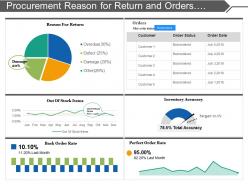
Presenting this set of slides with name - Procurement Reason For Return And Orders Detail Dashboard. This is a six stage process. The stages in this process are Purchase, Procurement, Buy.
-
 61457376 style essentials 2 financials 5 piece powerpoint presentation diagram infographic slide
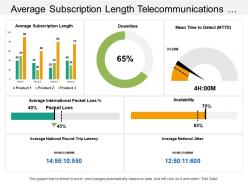
Presenting this set of slides with name - Average Subscription Length Telecommunications Dashboard. Pre-designed presentation slide can be shared easily as comes in both standard and widescreen view. Fully amendable PowerPoint design can be modified as per your preference. Picture quality is perfect as pixels remain same even when you share with large number of audiences. PPT template can be downloaded with different nodes and stages and well accustomed with all the software’s options such as JPG and PDF and even with Google slides.


