50142248 style essentials 2 financials 4 piece powerpoint presentation diagram infographic slide
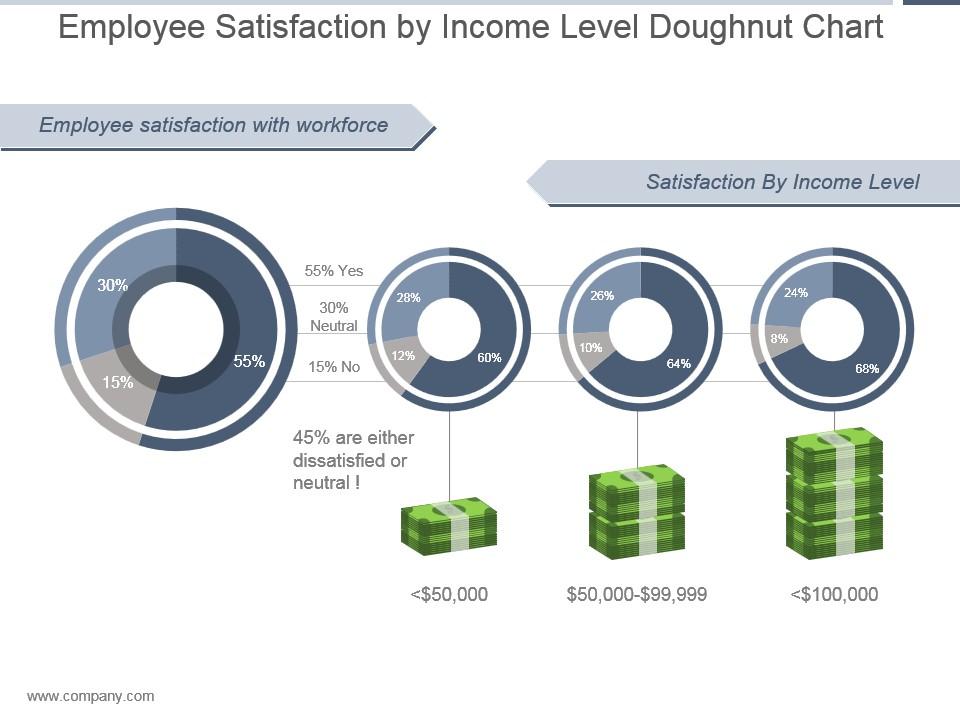
Give a glowing account with our Employee Satisfaction By Income Level Doughnut Chart Ppt Slide. Your thoughts will acquire a lot of gloss.
You must be logged in to download this presentation.
 Impress your
 audience
Editable
of Time
PowerPoint presentation slides
Presenting employee satisfaction by income level doughnut chart ppt slide. This is a employee satisfaction by income level doughnut chart ppt slide. This is a four stage process. The stages in this process are employee satisfaction with workforce, satisfaction by income level, 55 percent yes, neutral, 15 percent no, 45 percent are either dissatisfied or neutral.
50142248 style essentials 2 financials 4 piece powerpoint presentation diagram infographic slide with all 5 slides:
Pamper your urges with our Employee Satisfaction By Income Level Doughnut Chart Ppt Slide. Let your creative juices start to flow.
-
The content is very helpful from business point of view.
-
Easily Editable.


