-
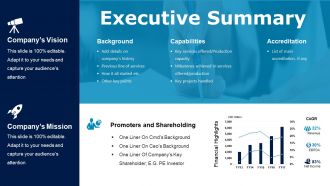 Executive summary powerpoint slide deck
Presenting executive summary powerpoint slide deck. Presenting executive summary powerpoint slide deck. Presenting executive summary powerpoint slide deck. This is a executive summary powerpoint slide deck. This is a two stage process. The stages in this process are background, capabilities, accreditation, promoters and shareholding.
-
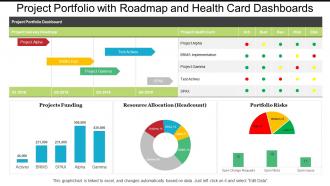 Project portfolio with roadmap and health card dashboards
Presenting, project portfolio with roadmap and health card dashboards. This Design possesses a construction that not only has a high market need but also displays clear judgment about the details and concept of the organization. It is obvious that there are various risks involved in a new business process so selecting an active medium to propose the message and other learning is very vital. These PPT designs have an addition to the advantage that these are pre-designed which makes it even more convenient for the new business.
-
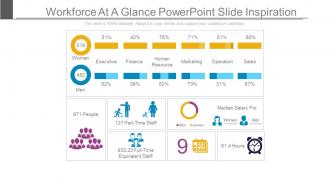 Workforce at a glance powerpoint slide inspiration
Presenting workforce at a glance powerpoint slide inspiration. This is a workforce at a glance powerpoint slide inspiration. This is a two stage process. The stages in this process are women, executive, finance, human resource, marketing, operation, sales, median salary for,part time staff,full time equivalent staff.
-
 Project name cost baseline portfolio dashboards
Presenting project name cost baseline portfolio dashboards PPT template. Download is quick and can be easily shared. Conveys a sense of change over time. Suitable for corporate leaders and business associates. Flexible PPT slide as can be used whenever required. PowerPoint design can be shared in Standard and Widescreen view. High quality graphics and visuals used in the PPT. Option to include business content i.e. name, logo and text. Effortless conversion into PDF/ JPG format. Can be easily merged with your ongoing presentation slides.
-
 403 B Savings Plan For Retirement Strategic Retirement Planning To Build Secure Future Fin SS
This slide shows information which can be used by individuals to get basic understanding about 403 b retirement savings plan. It includes elements such as types, contributions and contributions limit. Introducing 403 B Savings Plan For Retirement Strategic Retirement Planning To Build Secure Future Fin SS to increase your presentation threshold. Encompassed with two stages, this template is a great option to educate and entice your audience. Dispence information on Traditional, Contributions, Contributions Limit, using this template. Grab it now to reap its full benefits.
-
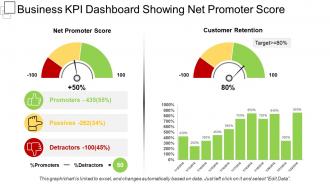 Business kpi dashboard snapshot showing net promoter score
Presenting this set of slides with name - Business Kpi Dashboard Snapshot Showing Net Promoter Score. This is a two stage process. The stages in this process are Business Dashboard, Business Kpi, Business Performance.
-
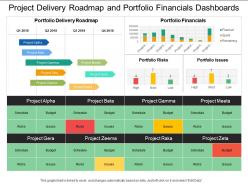 Project delivery roadmap and portfolio financials dashboards
Highlighting project delivery roadmap and portfolio financials dashboards PowerPoint presentation. Offer 100% access to change the size and style of the slides once downloaded and saved in the desired format. Beneficial for the business managers, marketing professionals and the strategy designers. Access to convert the presentation design into JPG and PDF. High quality images and visuals used in the designing process. Choice to get presentation slide in standard or in widescreen view. Easy to convert in JPEG and PDF document.
-
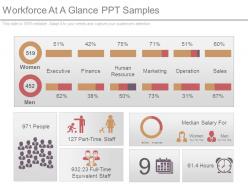 Workforce at a glance ppt samples
Presenting workforce at a glance ppt samples. This is a workforce at a glance ppt samples. This is a two stage process. The stages in this process are women, men, executive, finance, human resource, marketing, operation, sales.
-
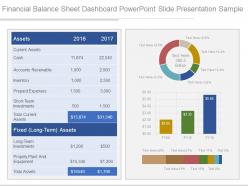 Financial balance sheet dashboard powerpoint slide presentation sample
Presenting financial balance sheet dashboard powerpoint slide presentation sample. This is a financial balance sheet dashboard powerpoint slide presentation sample. This is a two stage process. The stages in this process are assets, current assets, cash, accounts receivable, inventory, prepaid expenses, total current assets.
-
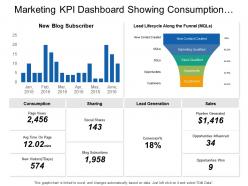 Marketing kpi dashboard showing consumption sharing sales lead generation
As this slideshow is 100% customizable you can easily add or remove anything from the pre-designed slides. You can change the font size, font color and the font style of the text used following instructions given in the sample templates. The orientation, size and the color of various graphical illustrations used in the PPT template are also adjustable. If you download this PPT slideshow you can view it in either standard size screen ratio of 4:3 or wide screen display ratio of 16:9. The PowerPoint presentation can be saved in PDF or JPG format. The slides are fully compatible with Google slides.
-
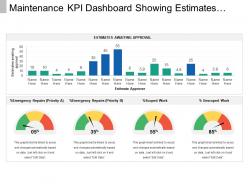 Maintenance kpi dashboard snapshot showing estimates awaiting approval
Presenting maintenance KPI dashboard snapshot showing estimates awaiting approval PPT slide. This layout is fully compatible with Google slides and data driven. User can edit the data in linked excel sheet and the design will change accordingly. Easy to put in company logo, trademark or name; accommodate words to support the key points. Images do no distort out even when they are projected on large screen. Adjust colors, text and fonts as per your business requirements.
-
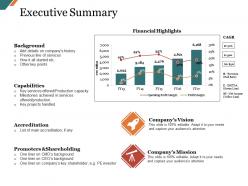 Executive summary ppt slide
Presenting this set of slides with name - Executive Summary Ppt Slide. This is a two stage process. The stages in this process are Background, Capabilities, Accreditation, Promoters And Shareholding, Company Vision.
-
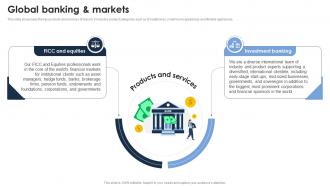 Global Banking And Markets Goldman Sach Company Profile CP SS
This slide showcases the key products and services of Xiaomi. It includes product categories such as Smartphones, smart home appliances and lifestyle appliances. Increase audience engagement and knowledge by dispensing information using Global Banking And Markets Goldman Sach Company Profile CP SS This template helps you present information on two stages. You can also present information on Investment Banking, FICC And Equities using this PPT design. This layout is completely editable so personaize it now to meet your audiences expectations.
-
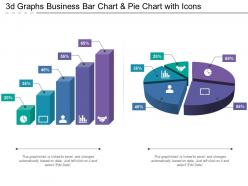 3d graphs business bar chart and pie chart with icons
Presenting this set of slides with name - 3d Graphs Business Bar Chart And Pie Chart With Icons. This is a two stage process. The stages in this process are Paint Brush, Art, Coloring.
-
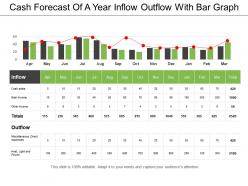 Cash forecast of a year inflow outflow with bar graph
Presenting cash forecast of a year inflow outflow with bar graph. This is a cash forecast of a year inflow outflow with bar graph. This is a two stage process. The stages in this process are cash forecast, cash flow, money forecast, fund forecast.
-
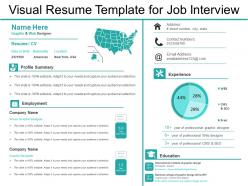 Visual resume template for job interview
Presenting Visual Resume Template For Job Interview. You can make changes to the slideshow according to the needs. Add appealing data visualization tools including charts, graphs, tables, etc. to the slide. The template is also compatible with Google Slides. It is further editable in MS PowerPoint and similar software. Save it into common images or document formats such as JPEG, PNG or PDF. High-quality graphics will prevent distortion at any cost.
-
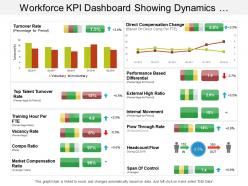 Workforce kpi dashboard showing dynamics structure and span of control
Presenting this set of slides with name - Workforce Kpi Dashboard Showing Dynamics Structure And Span Of Control. This is a two stage process. The stages in this process are Staff, Personnel, Workforce.
-
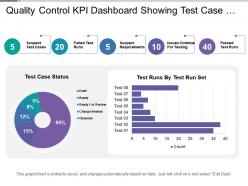 Quality control kpi dashboard showing test case status
Presenting this set of slides with name - Quality Control Kpi Dashboard Showing Test Case Status. This is a two stage process. The stages in this process are Quality Management, Quality Control, Quality Assurance.
-
 Comparison ppt file themes
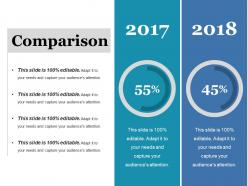
Presenting this set of slides with name - Comparison Ppt File Themes. This is a two stage process. The stages in this process are Finance, Business, Year, Comparison, Donut.
-
 Data comparison chart powerpoint slide
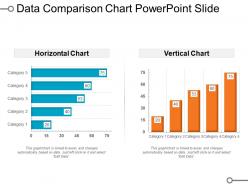
Presenting data comparison chart PowerPoint slide presentation template. You can download this slide and then save into another format such as JPG and PDF and can also display in standard and widescreen view. A user can alter this slide such as color, text, font type, font size and aspect ratio. This slide gets synced with Google Slides, Excel sheet and edit in PowerPoint. You may share this template with large segment because it has great pixel quality. You can insert the relevant content in text placeholder of this slide.
-
 Survey response metrics dashboard snapshot ppt image
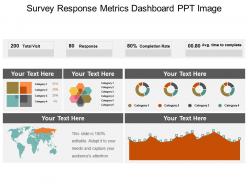
Presenting survey response metrics dashboard snapshot PPT image PPT presentation which is 100% editable. This PPT template is crafted with attractive display and unique components. This PPT slide is easy to customize and enables you to personalize it as per your own criteria. The presentation slide is fully compatible with Google slides, multiple format and software options. In case of any assistance, kindly take instructions from our presentation design services and it is easy to download in a very short span of time. The images, layouts, designs are of high quality and ensures quality in widescreen.
-
 Executive summary ppt styles graphics pictures
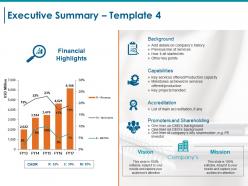
Presenting this set of slides with name - Executive Summary Ppt Styles Graphics Pictures. This is a two stage process. The stages in this process are Background, Capabilities, Accreditation, Promoters And Shareholding, Cagr.
-
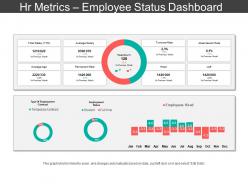 Hr metrics employee status dashboard snapshot ppt slide templates
Presenting HR Metrics Employee Status Dashboard Snapshot PPT Slide Templates which is designed professionally for your convenience. Change the color, font, font size, and font type of the slides as per your requirements. The template is compatible with Google Slides which makes it easily accessible at once. Open and save your presentation in various formats like PDF, JPG, and PNG. Freely access your template in both 4:3 and 16:9 aspect ratio.
-
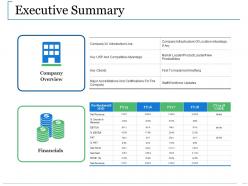 Executive summary ppt visuals
Presenting this set of slides with name - Executive Summary Ppt Visuals. This is a two stage process. The stages in this process are Company, Overview, Financials, Business, Marketing, Planning.
-
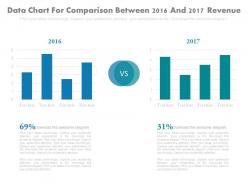 Data chart for comparison between 2016 and 2017 revenue powerpoint slides
PPT slides are simple to download. Highly compatible with Google slides and PowerPoint versions. High quality PowerPoint template illustrations. Customizable layout content, pictures, textual style shading and font. Convertible into PDF or JPG groups. Highly impactful PowerPoint template. Simply include organization logo, trademark or name in any PowerPoint slide. Perfect for business, innovation, ventures, experts, IT organizations, advertisers and so forth. The stages in this process are financials.
-
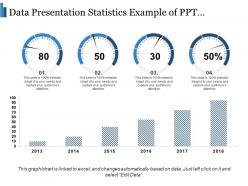 Data presentation statistics example of ppt presentation
Presenting this set of slides with name - Data Presentation Statistics Example Of Ppt Presentation. This is a two stage process. The stages in this process are Data Presentation, Content Presentation, Information Presentation.
-
 Executive summary powerpoint slides design
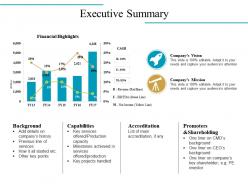
Presenting this set of slides with name - Executive Summary Powerpoint Slides Design. This is a two stage process. The stages in this process are Background, Capabilities, Accreditation, Promoters And Shareholding, Financial Highlights.
-
 Data bar graph for business application powerpoint template slide
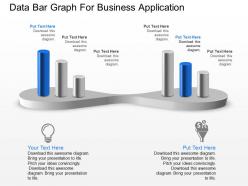
Presenting, data bar graph for business application PowerPoint template slide. Modifiable PPT Slide, edit the bar colors shown and personalize the text with your data. Convertible into various format options like JPEG, JPG or PDF. Display option available such as standard and widescreen view, available in 4:3 standard and full screen version 16:9. Liberty to customize it with company name and logo. Helpful for business professionals, students, teachers, business analysts and strategists. Compatible with google slides as well.
-
 Employee operational performance metrics ppt image
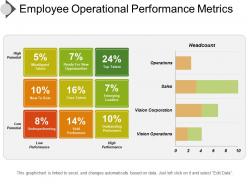
Presenting employee operational performance metrics PPT image. PPT is perfect for employee performance assessment and management. Downloads are 100% error free. Images are compatible with Google Slides and MS PowerPoint. Presentation is useful for corporate business managers, trainers, HR professionals. The presentation can be opened with Google Slides and Microsoft PowerPoint. Download and convert the design into JPEG and PDF formats.
-
 Financial performance kpi dashboard showing asset allocation balance sheet
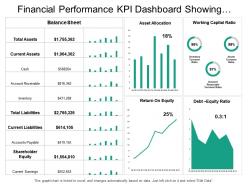
Presenting this set of slides with name - Financial Performance Kpi Dashboard Showing Asset Allocation Balance Sheet. This is a two stage process. The stages in this process are Financial Performance, Financial Report, Financial Review.
-
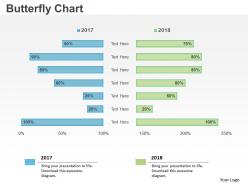 0414 business butterfly bar chart powerpoint graph
Presenting 0414 business butterfly bar chart PowerPoint graph PPT slide. High-resolution visuals. No fear of image pixelation when projected on a large screen. Thoroughly editable PowerPoint pictures. Ease of executing changes in the content of the slide. Easy to customize and personalize the PowerPoint slides with company-specific name, logo, and trademark. Ease of download and can be saved in any format of one’s choice. Compatible with numerous software options available both online and offline. Applicable by a number of marketing and nonmarketing executives, students, and teachers.
-
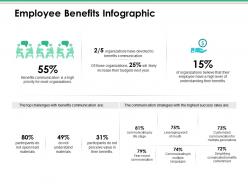 Employee benefits infographic ppt infographic template professional
Presenting this set of slides with name - Employee Benefits Infographic Ppt Infographic Template Professional. This is a two stage process. The stages in this process are Business, Management, Strategy, Analysis, Communication.
-
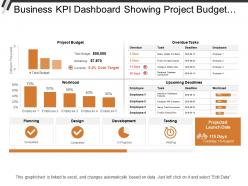 Business kpi dashboard showing project budget overdue tasks and workload
Presenting this set of slides with name - Business Kpi Dashboard Showing Project Budget Overdue Tasks And Workload. This is a two stage process. The stages in this process are Business Dashboard, Business Kpi, Business Performance.
-
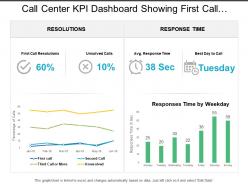 Call center kpi dashboard showing first call resolution response time
Presenting call center KPI dashboard showing first call resolution response time. This deck offers you plenty of space to put in titles and sub titles. This template is Excel linked just right click to input your information. High resolution-based layout, does not change the image even after resizing. This presentation icon is fully compatible with Google slides. Quick downloading speed and simple editing options in color text and fonts.PPT icons can easily be changed into JPEG and PDF applications.
-
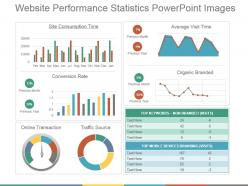 Website performance statistics powerpoint images
We present to you our website performance statistics PowerPoint images. You can change the placement, the size or the color of the graphical images used in the template. You can make numerous changes by following the instructions given in sample slides, as this PPT is fully editable. This template can be saved in either PDF or JPG format. You can view the presentation in widescreen display ratio of 16:9 or standard size display ratio of 4:3. So download, edit and present it.
-
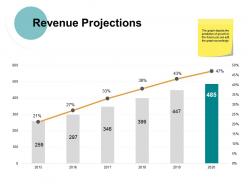 Revenue projections ppt powerpoint presentation file designs download
Presenting this set of slides with name - Revenue Projections Ppt Powerpoint Presentation File Designs Download. This is a two stage process. The stages in this process are Finance, Management, Strategy, Business, Marketing.
-
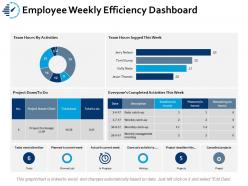 Employee weekly efficiency dashboard snapshot ppt portfolio brochure
Presenting this set of slides with name - Employee Weekly Efficiency Dashboard Snapshot Ppt Portfolio Brochure. This is a two stage process. The stages in this process are Business, Management, Strategy, Sales, Marketing.
-
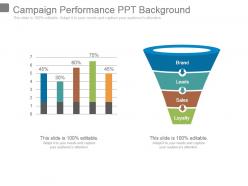 Campaign performance ppt background
Presenting campaign performance ppt background. This is a campaign performance ppt background. This is a two stage process. The stages in this process are brand, leads, sales, loyalty.
-
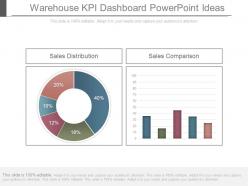 Warehouse kpi dashboard powerpoint ideas
Presenting warehouse kpi dashboard powerpoint ideas. This is a warehouse kpi dashboard powerpoint ideas. This is a two stage process. The stages in this process are sales distribution, sales comparison.
-
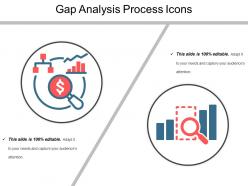 Gap analysis process icons
Presenting gap analysis process icons. This is a gap analysis process icons. This is a two stage process. The stages in this process are gap analysis process, goal gap, closing the gap.
-
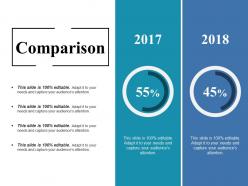 Comparison ppt good
Presenting this set of slides with name - Comparison Ppt Good. This is a two stage process. The stages in this process are Comparison, Years, Percentage, Business, Finance.
-
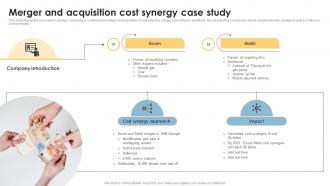 Merger And Acquisition Cost Synergy Case Study
This slide depicts the case study to analyze cost synergy creation post merger and acquisition. It evaluates the merger case of Exxon and Mobil, two oil exporting companies, whose merger led to the creation of over Doller 5 billion in cost synergies. Presenting our set of slides with Merger And Acquisition Cost Synergy Case Study This exhibits information on two stages of the process. This is an easy to edit and innovatively designed PowerPoint template. So download immediately and highlight information on Company Introduction, Cost Synergy Approach, Impact
-
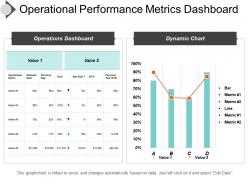 Operational performance metrics dashboard ppt summary
Presenting operational performance metrics dashboard ppt summary. This is a operational performance metrics dashboard ppt summary. This is a two stage process. The stages in this process are operational performance metrics, operational performance dashboard, operational performance kpis.
-
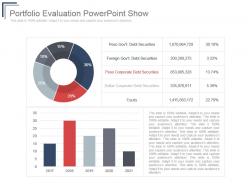 Portfolio evaluation powerpoint show
Presenting portfolio evaluation powerpoint show. This is a portfolio evaluation powerpoint show. This is a two stage process. The stages in this process are peso govt debt securities, foreign govt debt securities, peso corporate debt securities, dollar corporate debt securities, equity.
-
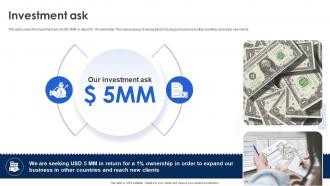 Investment Ask Philips Investor Funding Elevator Pitch Deck
This slide covers the investment ask of USD 5MM in return for 1 percent ownership. The main purpose of raising funds is to expand business in other countries and reach new clients. Introducing Investment Ask Philips Investor Funding Elevator Pitch Deck to increase your presentation threshold. Encompassed with two stages, this template is a great option to educate and entice your audience. Dispence information on Investment Ask, Reach New Clients, Ownership, using this template. Grab it now to reap its full benefits.
-
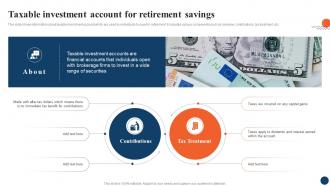 Taxable Investment Strategic Retirement Planning To Build Secure Future Fin SS
This slide shows information about taxable investment account which are used by individuals to save for retirement. It includes various components such as overview, contributions, tax treatment, etc. Introducing Taxable Investment Strategic Retirement Planning To Build Secure Future Fin SS to increase your presentation threshold. Encompassed with two stages, this template is a great option to educate and entice your audience. Dispence information on Tax Treatment, Contributions, Tax Benefit, using this template. Grab it now to reap its full benefits.
-
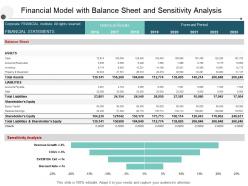 Financial model with balance sheet and sensitivity analysis
Presenting this set of slides with name - Financial Model With Balance Sheet And Sensitivity Analysis. This is a two stage process. The stages in this process are Financial Analysis, Income Statement, Balance Sheet.
-
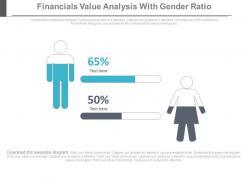 Financial value analysis with gender ratio powerpoint slides
Presenting financial value analysis with gender ratio powerpoint slides. This is a financial value analysis with gender ratio powerpoint slides. This is a two stage process. The stages in this process are financials.
-
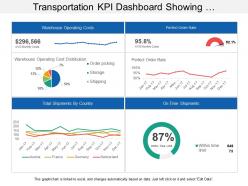 Transportation kpi dashboard showing warehouse operating costs perfect order rate
Presenting transportation KPI dashboard showing warehouse operating costs perfect order rate PPT slide. This layout is fully compatible with Google slides and data driven. User can edit the data in linked excel sheet and graphs and charts gets customized accordingly. Easy to put in company logo, trademark or name; accommodate words to support the key points. Images do no distort out even when they are projected on large screen. Adjust colors, text and fonts as per your business requirements.
-
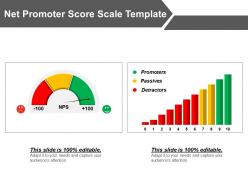 Net promoter score scale template powerpoint graphics
Presenting net promoter score scale PPT template. This Presentation graphic is eloquent and beneficial for the students, researchers, specialists from various fields. The composition features of this PowerPoint image allow you to modify the appearance and layout. This PPT design has enough scope to insert the title or subtitles respectively. The impeccable Presentation design is well acquainted with all Google Slides. They also provide an option to add your business logo too.
-
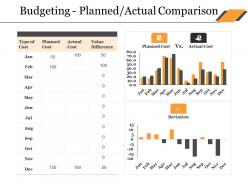 Budgeting planned actual comparison ppt deck
Presenting this set of slides with name - Budgeting Planned Actual Comparison Ppt Deck. This is a two stage process. The stages in this process are Bar Chart, Finance, Marketing, Analysis, Comparison.
-
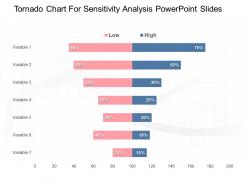 Tornado chart for sensitivity analysis powerpoint slides
Presenting tornado chart for sensitivity analysis PowerPoint slides PPT slide. This plethora of professionally crafted slides is thoroughly editable. You may modify the content at your personal comfort and need. Personalize it with your company name and logo. You may download and save the presentation in the desired format. PPT is compatible with a wide variety of online and offline software options.
-
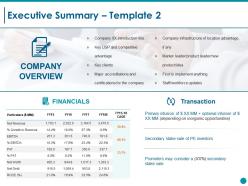 Executive summary ppt styles example topics
Presenting this set of slides with name - Executive Summary Ppt Styles Example Topics. This is a two stage process. The stages in this process are Business, Marketing, Strategy, Net Revenue, Net Worth.
-
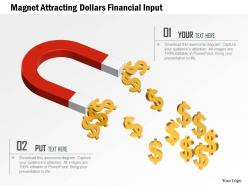 Magnet attracting dollars financial input powerpoint template
We are proud to present our magnet attracting dollars financial input powerpoint template. Concept of financial inventory update has been displayed in this PPT diagram. This PPT diagram contains graphic of magnet and dollars. Use this PPT diagram for finance and management related presentations.
-
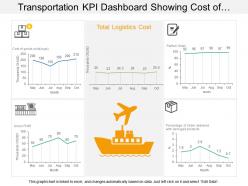 Transportation kpi dashboard showing cost of good sold logistics cost and gross profit
Presenting KPI dashboard showing cost of goods sold logistics cost and gross profit PPT slide. This layout is fully compatible with Google slides and data driven. User can edit the data in linked excel sheet and graphs and charts gets customized accordingly. Easy to put in company logo, trademark or name; accommodate words to support the key points. Images do no distort out even when they are projected on large screen. Adjust colors, text and fonts as per your business requirements
-
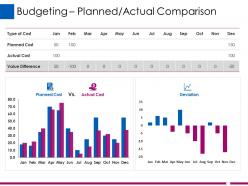 Budgeting planned actual comparison ppt layouts
Presenting this set of slides with name - Budgeting Planned Actual Comparison Ppt Layouts. This is a two stage process. The stages in this process are Finance, Business, Analysis, Marketing, Planning.
-
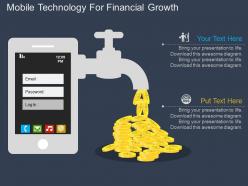 New mobile technology for financial growth flat powerpoint design
Presenting new mobile technology for financial growth flat powerpoint design. This Power Point template diagram has been crafted with graphic of mobile diagram. This PPT diagram contains the concept of financial growth and mobile technology application. Use this PPT diagram for finance and technology related presentations.
-
 Stack of coins showing dollar sign
Presenting this set of slides with name - Stack Of Coins Showing Dollar Sign. This is a two stage process. The stages in this process are Coin Icon, Penny Icon, Stack Icon.
-
 Donut pie chart ppt portfolio brochure
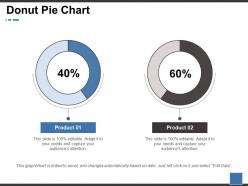
Explore the donut pie chart PowerPoint presentation slide. This presentation has been designed by professionals and is fully editable. You can reshape the font size, font type, colors, and even the background. This Template is attainable with Google Slide and can be saved in JPG or PDF format without any resistance created during the process. Fast download at the click of the button provided below.
-
 Inventory planning kpi dashboard ppt powerpoint presentation icon
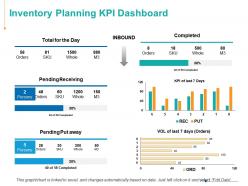
Presenting this set of slides with name - Inventory Planning KPI Dashboard Ppt Powerpoint Presentation Icon. This is a two stage process. The stages in this process are Finance, Analysis, Business, Investment, Marketing.
Toggle Nav

Skip to Content

Search
5
Notifications 5
-
 We have an entire team of experts who can work on your custom presentation. Get in touch with our design agency.
6 hours ago
-
 SlideTeam has published a new blog titled "أفضل 10 فرق تمتلك قوالب العروض التقديمية المصورة مع الأمثلة والعينات".
8 hours ago
-
 SlideTeam has published a new blog titled "As 10 principais equipes com modelos de apresentação de imagens com exemplos e amostras".
8 hours ago
-
 SlideTeam has published a new blog titled "Top 10 des équipes avec des modèles de présentation d'images avec des exemples et des échantillons".
8 hours ago
-
 SlideTeam has published a new blog titled "Top 10 des modèles de budget RH avec exemples et exemples".
8 hours ago


