-
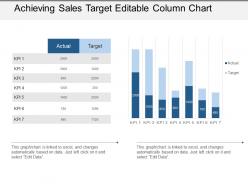 Achieving sales target editable column chart powerpoint guide
Presenting the PPT slide named Achieving sales target editable column chart PowerPoint guide. This template is professionally designed and is completely editable. The Font color, Font size, Font style, background color and color of the diagram can be altered as per your suitability. The text in the template can be rewritten and replaced with your desired content. The slide is totally compatible with Google slides and can be easily saved in JPG or PDF format. You can customize the template conveniently by changing the data in excel sheet, as this template is Excel-linked. Editable icons make the presentation more presentable. Download it now to make a hassle free presentation.
-
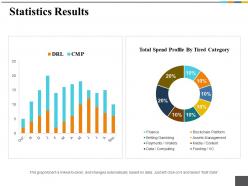 Statistics results ppt inspiration gallery
Presenting statistics results PowerPoint presentation slide. This presentation has been designed professionally and is fully editable. You can personalize font size, font type, colors, and even the background. This Template is obedient with Google Slide and can be saved in JPG or PDF format without any hassle. Fast download at the click of the button.
-
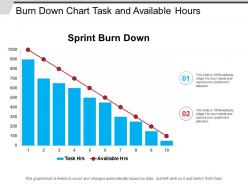 Burn down chart task and available hours
Presenting this set of slides with name - Burn Down Chart Task And Available Hours. This is a two stage process. The stages in this process are Burn Down Chart, Agile Software Development Chart, Run Chart.
-
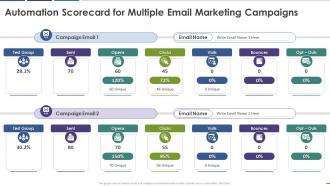 Automation scorecard for multiple email marketing campaigns
This graph or chart is linked to excel, and changes automatically based on data. Just left click on it and select Edit Data. Introducing Automation Scorecard For Multiple Email Marketing Campaigns to increase your presentation threshold. Encompassed with two stages, this template is a great option to educate and entice your audience. Dispence information on Test Group, Opens Visits, Bounces, Campaign Email, using this template. Grab it now to reap its full benefits.
-
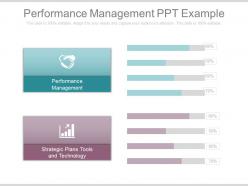 Performance management ppt example
This PowerPoint template is a modern way to represent performance management of your organization through a presentation. You can easily alter the text by editing it in PowerPoint software and include your company logo. You can change the color of the block diagram shown in the figure and choose it according to your liking. Use it in full screen mode after downloading. The stages in this process are performance management, strategic plans tools and technology.
-
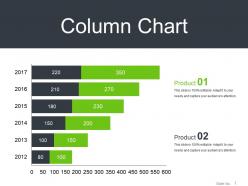 Column chart powerpoint layout
Presenting Column Chart PowerPoint Layout. This slide can be downloaded into formats like PDF, JPG, and PNG without any problem. It is adaptable with Google Slides which makes it accessible at once. You can modify the color, font, font size, and font types of the slides as per your requirement. This slide is available in both the standard and widescreen aspect ratio. High-quality graphics ensures that there is no room for deterioration.
-
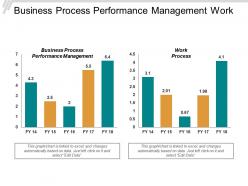 Business process performance management work process process flow charts cpb
This is an editable two stages graphic that deals with topics like Business Process Performance Management, Work Process, Process Flow Charts to help convey your message better graphically. This product is a premium product available for immediate download, and is 100 percent editable in Powerpoint. Download this now and use it in your presentations to impress your audience.
-
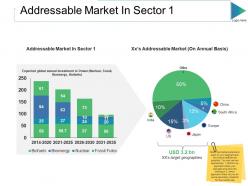 Addressable market in sector ppt slides structure
Presenting this set of slides with name - Addressable Market In Sector Ppt Slides Structure. This is a two stage process. The stages in this process are Addressable Market In Sector, Addressable Market, South Africa, Europe, Japan.
-
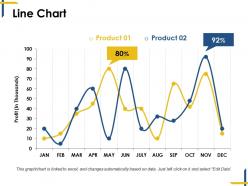 Line chart ppt diagrams
Presenting this set of slides with name - Line Chart Ppt Diagrams. This is a two stage process. The stages in this process are Growth, Finance, Analysis, Business, Marketing.
-
 Gross profit margin with financial highlights
Presenting the Gross Profit Margin With Financial Highlights PPT slideshow which is designed professionally for your convenience. Can be changed into formats like PDF, JPG, and PNG. The slide is readily available in both 4:3 and 16:9 aspect ratio. This template is compatible with Google Slides, which makes it accessible at once. You can alter the colors, fonts, font size, and font types of the template as per the requirements.
-
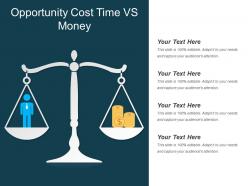 Opportunity cost time vs money
Presenting this Opportunity Cost Time Vs Money PowerPoint presentation. Add new components like charts and graphs for a better portrayal of important facts. The PPT also supports the standard(4:3) and widescreen(16:9) sizes for better comprehension. It is compatible with Google Slides. Convert this into popular images or document formats including JPEG, PNG or PDF. High-quality graphics ensure that quality does not deteriorate.
-
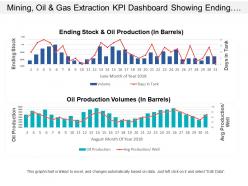 Mining oil and gas extraction kpi dashboard showing ending stock and oil production volumes
Presenting this set of slides with name - Mining Oil And Gas Extraction Kpi Dashboard Showing Ending Stock And Oil Production Volumes. This is a two stage process. The stages in this process are Mining, Oil And Gas Extraction, Refinery, Natural Gas.
-
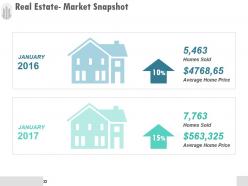 Real estate market snapshot powerpoint shapes
Presenting real estate market snapshot powerpoint shapes. This is a real estate market snapshot powerpoint shapes. This is a two stage process. The stages in this process are business, marketing, management, finance, sale.
-
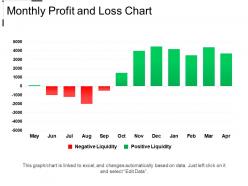 Monthly profit and loss chart example of ppt
Presenting Monthly Profit And Loss Chart Example Of PPT. Get this customizable PPT slide and make amendments in this template to match it with your presentation theme. Alter the colors, background, font size, and font type. Transform and save in various formats. Its adaptability with the Google Slides and the other major Microsoft versions makes it accessible at once. Get this high-resolution graphics template in standard screen size and widescreen size.
-
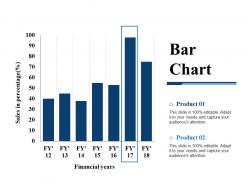 Bar chart ppt templates
Presenting this set of slides with name - Bar Chart Ppt Templates. This is a two stage process. The stages in this process are Bar Chart, Finance, Marketing, Analysis, Strategy, Investment.
-
 Cash on delivery for ecommerce shipment couriers icon
Presenting this set of slides with name Cash On Delivery For Ecommerce Shipment Couriers Icon. This is a two stage process. The stages in this process are Cash On Delivery For Ecommerce Shipment Couriers Icon. This is a completely editable PowerPoint presentation and is available for immediate download. Download now and impress your audience.
-
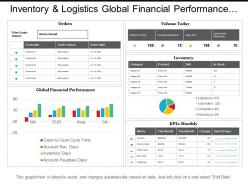 Inventory and logistics global financial performance dashboards
Presenting this set of slides with name - Inventory And Logistics Global Financial Performance Dashboards. This is a two stage process. The stages in this process are Inventory And Logistics, Inventory Management, Warehousing And Inventory Management.
-
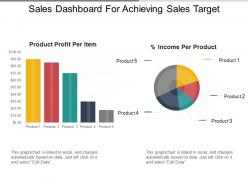 Sales dashboard for achieving sales target ppt templates
SlideTeam would like to introduce all of you with this totally alterable and user-friendly sales dashboard for achieving sales target PPT templates. This PowerPoint presentation is fully editable which allows you to make changes to its predesigned slides. It allows you to change the size, color, and orientation of various features. By simply following the instructions given in the sample slides you can make these changes. The presentation allows you to save it in the format of either JPG or PDF. You can add or delete any given information from the already prepared slides.
-
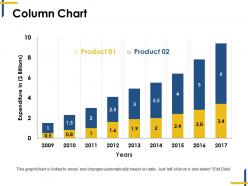 Column chart ppt examples
Presenting this set of slides with name - Column Chart Ppt Examples. This is a two stage process. The stages in this process are Column Chart, Finance, Analysis, Business, Marketing.
-
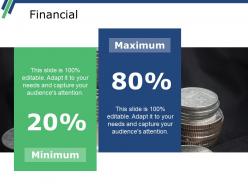 Financial ppt summary example
Presenting this set of slides with name - Financial Ppt Summary Example. This is a two stage process. The stages in this process are Financial, Minimum, Maximum, Analysis.
-
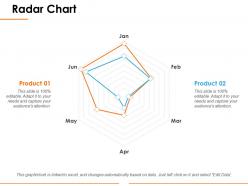 Radar chart ppt influencers
Presenting the radar chart presentation template. The spider web PPT template is designed under the supervision of professionals and is 100% customizable in PowerPoint. The business professional can bring changes to the objects like font color and font size in this slide and save it in JPG or PDF file format hassle-free. This slide is 100% compatible with Google Slide. Fast download this template at the click of the button.
-
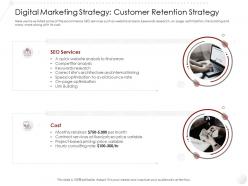 Digital marketing strategy customer retention entry strategy gym health fitness clubs industry ppt pictures
Here we have listed some of the ecommerce SEO services such as website analysis, keywords research, on page optimization, link building and many more along with its cost. Introducing Digital Marketing Strategy Customer Retention Entry Strategy Gym Health Fitness Clubs Industry Ppt Pictures. to increase your presentation threshold. Encompassed with two stages, this template is a great option to educate and entice your audience. Dispence information on link building, speed optimization to avoid bounce rate, contract services at fixed prices, using this template. Grab it now to reap its full benefits.
-
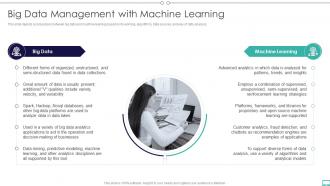 Big Data And Its Types Big Data Management With Machine Learning
This slide depicts a comparison between big data and machine learning based on its working, algorithms, data sources, and way of data analysis. Introducing Big Data And Its Types Big Data Management With Machine Learning to increase your presentation threshold. Encompassed with two stages, this template is a great option to educate and entice your audience. Dispence information on Big Data, Machine Learning, Data Collections, using this template. Grab it now to reap its full benefits.
-
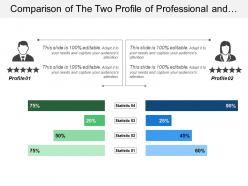 Comparison of the two profile of professional and four statistics
Presenting this set of slides with name - Comparison Of The Two Profile Of Professional And Four Statistics. This is a two stage process. The stages in this process are Comparison Of Two, Compare, comeptitive analysis.
-
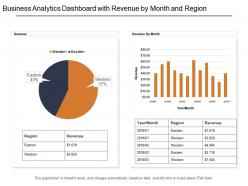 Business analytics dashboard snapshot with revenue by month and region
This is a two stage process. The stages in this process are Business Analytics, BA, Organizations Data.
-
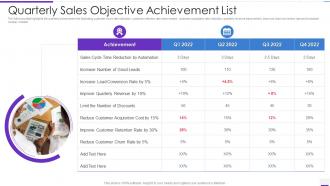 Quarterly Sales Objective Achievement List
The following slide highlights the quarterly achievement list illustrating customer churn rate reduction, customer retention rate improvement, customer acquisition rate reduction, quarterly revenue improvement, improved lead conversion rate and increased number of leads. Presenting our set of slides with Quarterly Sales Objective Achievement List. This exhibits information on two stages of the process. This is an easy to edit and innovatively designed PowerPoint template. So download immediately and highlight information on Achievement, Sales Cycle Time Reduction By Automation, Improve Quarterly Revenue, Reduce Customer Churn Rate.
-
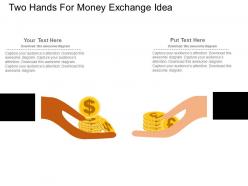 Two hands for money exchange idea flat powerpoint design
We are proud to present our two hands for money exchange idea flat powerpoint design. This power point template diagram contains the graphic two hands. This PPT diagram contains the concept of money and idea exchange .Use this PPT diagram for business and finance related presentations.
-
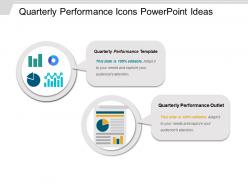 Quarterly performance icons powerpoint ideas
Presenting quarterly performance icons PowerPoint ideas. This PPT template has an ample amount of space to put in titles and subtitles. This slide offers high resolution based presentation which does not change the image even after resizing. This presentation icon is completely compatible with Google Slides. Quick downloading speed and simple editing options in color text and fonts.PPT icons can easily be changed into JPEG and PDF applications. This diagram has been designed for entrepreneurs, corporate and business managers.
-
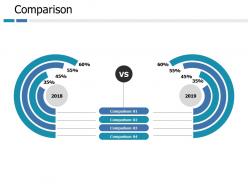 Comparison business ppt portfolio slide portrait
Presenting this set of slides with name - Comparison Business Ppt Portfolio Slide Portrait. This is a two stage process. The stages in this process are Comparison, Planning, Marketing, Finance, Strategy.
-
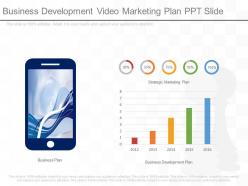 Business development video marketing plan ppt slide
PPT slide supports resize, recolor and reverse the images. Good quality images can be used to compliment and reinforce message. Works well in Windows 7, 8, 10, XP, Vista and Citrix. Editing in presentation slide show can be done from anywhere by any device. Elegant and beautiful presentation which can be oriented and customized according to requirement.The stages in this process are marketing, communication, technology, finance, internet.
-
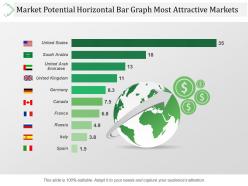 Market potential horizontal bar graph most attractive markets ppt images
Presenting market potential horizontal bar graph most attractive markets ppt images. This is a market potential horizontal bar graph most attractive markets ppt images. This is a two stage process. The stages in this process are business, marketing, strategy, finance, investment, success, location, geography.
-
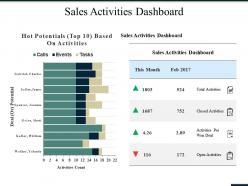 Sales activities dashboard ppt summary maker
Presenting this set of slides with name - Sales Activities Dashboard Ppt Summary Maker. This is a two stage process. The stages in this process are Sales Activities Dashboard, This Month, Deal, Activities Count, Business.
-
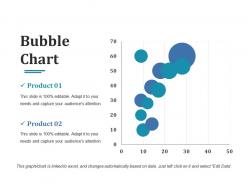 Bubble chart ppt designs
Presenting this set of slides with name - Bubble Chart Ppt Designs. This is a two stage process. The stages in this process are Bubble Chart, Finance, Business, Marketing, Analysis.
-
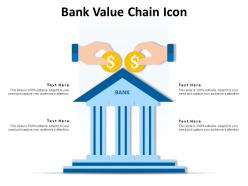 Bank value chain icon
Presenting this set of slides with name Bank Value Chain Icon. This is a two stage process. The stages in this process are Bank, Value Chain, Icon. This is a completely editable PowerPoint presentation and is available for immediate download. Download now and impress your audience.
-
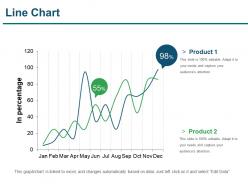 Line chart ppt infographic template
Presenting line chart ppt infographic template. This is a line chart ppt infographic template . This is a two stage process. The stages in this process are line chart, finance, marketing, analysis, business.
-
 Bar graph ppt background images
Presenting this set of slides with name - Bar Graph Ppt Background Images. This is a two stage process. The stages in this process are Business, Marketing, Sales In Percentage, Bar Graph, Finance.
-
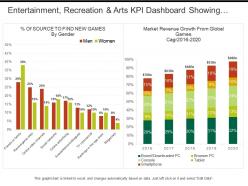 Entertainment recreation and arts kpi dashboard showing market revenue growth
Presenting this set of slides with name - Entertainment Recreation And Arts Kpi Dashboard Showing Market Revenue Growth. This is a two stage process. The stages in this process are Entertainment, Recreation And Arts, Attractions, Culture, Entertainment.
-
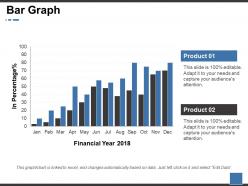 Bar graph ppt summary guidelines
Grab an opportunity to go through the bar graph PowerPoint presentation slide. This presentation has been designed under the strict supervision of professionals and is fully editable. You can remodel the font size, font type, colors, and even the background. This Template is practicable with Google Slide and can be saved in JPG or PDF format without any hurdles created during the process. Fast download at the click of the button provided below.
-
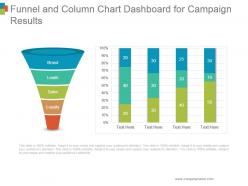 Funnel and column chart dashboard for campaign results ppt background images
Presenting funnel and column chart dashboard for campaign results ppt background images. This is a funnel and column chart dashboard for campaign results ppt background images. This is a two stage process. The stages in this process are brand, leads, sales, loyalty.
-
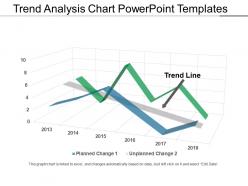 Trend analysis chart powerpoint templates
Presenting a PowerPoint slide named Trend Analysis Chart PowerPoint Templates. Create a compelling presentation with this PPT diagram, which is both professional and editable. Customize colors, choose font styles, and size. You can choose from a wide variety of icons. Resize and scale the images to fit any content. The PPT slide is compatible with Google Slides and can be fetched at once. You can save it as both PDF and JPG formats. This PPT slide is data-driven and can be linked to Excel sheet.
-
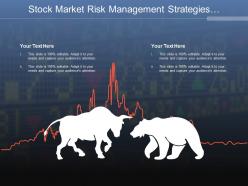 Stock market risk management strategies having two bulls
Presenting this set of slides with name - Stock Market Risk Management Strategies Having Two Bulls. This is a two stage process. The stages in this process are Bull Market, Financial Market, Stock Market.
-
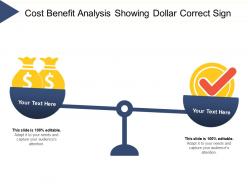 Cost benefit analysis showing dollar correct sign
Presenting this set of slides with name - Cost Benefit Analysis Showing Dollar Correct Sign. This is a two stage process. The stages in this process are Cost Benefit Analysis, Cost Benefit Investigation, Cost Benefit Examination.
-
 Re business success and idea generation concept flat powerpoint design
Presenting re business success and idea generation concept flat powerpoint design. This Power Point template diagram has been crafted with graphic of business icons. This PPT diagram contains the concept of global business success and idea generation .Use this PPT diagram for business and marketing related presentations.
-
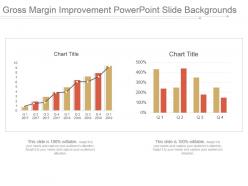 Gross margin improvement powerpoint slide backgrounds
Presenting gross margin improvement powerpoint slide backgrounds. Presenting gross margin improvement powerpoint slide backgrounds. Presenting gross margin improvement powerpoint slide backgrounds. This is a gross margin improvement powerpoint slide backgrounds. This is two stage process. The stages in this process are chart title, gross margin, improvement, business, success.
-
 Gross margin improvement ppt sample
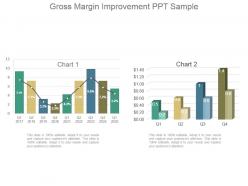
Presenting gross margin improvement ppt sample. Presenting gross margin improvement ppt sample. Presenting gross margin improvement ppt sample. This is a gross margin improvement ppt sample. This is two stage process. The stages in this process are gross margin, improvement, strategy, business, success, finance.
-
 0414 butterfly bar chart for business performance powerpoint graph
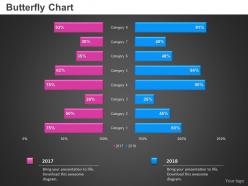
Presenting 0414 bar chart for business performance PowerPoint graph PPT slide. PPT has high-resolution visuals. Impressive picture quality which does not deter when projected on a wide screen. There is an impressive use of colors and design. PPT is compatible with a large number of formats. It is compatible with numerous online and offline software options. It is thoroughly editable slide design background. Ease of modification. Personalization of content with company-specific name, logo or trademark is extremely easy. PPT is professionally proficient and aesthetically sound. Used by marketers, brand managers, sales professionals, students, and teachers.
-
 Bar chart ppt slides summary
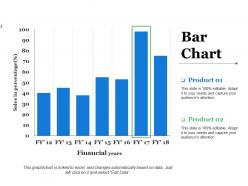
Presenting this set of slides with name - Bar Chart Ppt Slides Summary. This is a two stage process. The stages in this process are Sales In Percentage, Percentage, Business, Marketing, Financial Years.
-
 Transform business process business process management lean management process cpb
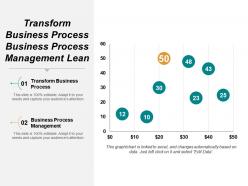
This is an editable two stages graphic that deals with topics like Transform Business Process, Business Process Management, Lean Management Process to help convey your message better graphically. This product is a premium product available for immediate download, and is 100 percent editable in Powerpoint. Download this now and use it in your presentations to impress your audience.
-
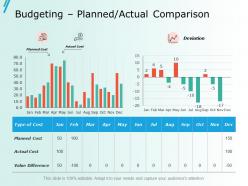 Budgeting planned actual comparison ppt slides inspiration
Presenting this set of slides with name - Budgeting Planned Actual Comparison Ppt Slides Inspiration. This is a two stage process. The stages in this process are Business, Management, Strategy, Analysis, Marketing.
-
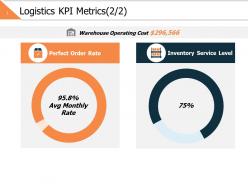 Logistics kpi metrics 2 2 ppt powerpoint presentation file format
Presenting this set of slides with name - Logistics Kpi Metrics 2 2 Ppt Powerpoint Presentation File Format. This is a two stage process. The stages in this process are Business, Management, Strategy, Analysis, Finance.
-
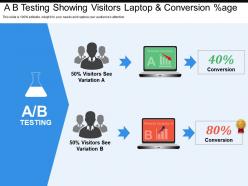 A b testing showing visitors laptop and conversion percent
Presenting this set of slides with name - A B Testing Showing Visitors Laptop And Conversion Percent. This is a two stage process. The stages in this process are A B Testing, Automation, Quality Assurance.
-
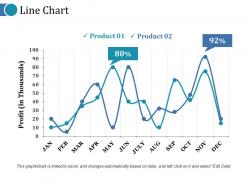 Line chart ppt microsoft
Introducing our Line Chart PPT slide. This is a completely adaptable PPT slide that allows you to add images, charts, icons, tables, and animation effects according to your requirements. Create and edit your text in this 100% customizable slide. It is also available in widescreen. You can change the orientation of any element in your presentation according to your liking. The slide is available in both 4:3 and 16:9 aspect ratio. These PPT slides are also compatible with Google slides.
-
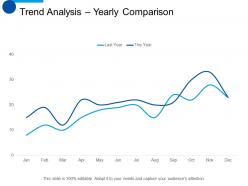 Trend analysis yearly comparison ppt professional format
Presenting this set of slides with name - Trend Analysis Yearly Comparison Ppt Professional Format. This is a two stage process. The stages in this process are Finance, Analysis, Business, Investment, Marketing.
-
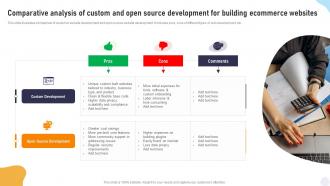 Comparative Analysis Of Custom And Open Source Development For Building Ecommerce Websites
This slide illustrates comparison of customer website development and open source website development. It includes pros, cons of different types of web development, etc. Introducing our premium set of slides with Comparative Analysis Of Custom And Open Source Development For Building Ecommerce Websites. Elucidate the two stages and present information using this PPT slide. This is a completely adaptable PowerPoint template design that can be used to interpret topics like Custom Development, Open Source Development, Pros, Cons. So download instantly and tailor it with your information.
-
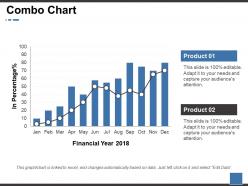 Combo chart ppt show template
Get a chance to go through the combo chart PowerPoint presentation slide. This presentation has been designed by professionals and is fully editable. You can remodel the font size, font type, colors, and even the background. This Template is practicable with Google Slide and can be saved in JPG or PDF format without any obstacle created during the process. Fast download at the click of the button provided below.
-
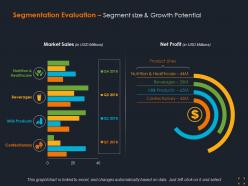 Segmentation evaluation segment size and growth potential ppt summary grid
Presenting this set of slides with name - Segmentation Evaluation Segment Size And Growth Potential Ppt Summary Grid. This is a two stage process. The stages in this process are Business, Finance, Marketing, Strategy, Analysis.
-
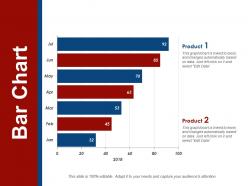 Bar chart powerpoint slides
Presenting Bar Chart PowerPoint Slides. The slide can be modified as per your wants. Make alterations in the colors, background, and font type of the layout. Increase or decrease the size of the icon and transform it into formats like JPG, JPEG, and PDF. Goes well with Google Slides. It can be projected on a full screen in front of thousands of people. Also, the template is completely compatible with the major Microsoft versions and can be presented in front of a large segment because of its high-resolution graphics.
-
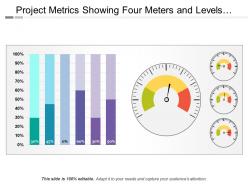 Project metrics showing four meters and levels of projects
Presenting this set of slides with name - Project Metrics Showing Four Meters And Levels Of Projects. This is a two stage process. The stages in this process are Project Kpis, Project Dashboard, Project Metrics.
-
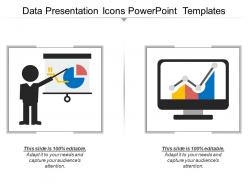 Data presentation icons powerpoint templates
Presenting this set of slides with name - Data Presentation Icons Powerpoint Templates. This is a two stage process. The stages in this process are Data Presentation, Content Presentation, Information Presentation.
-
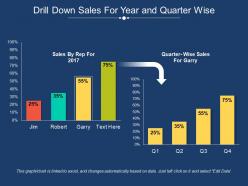 Drill down sales for year and quarter wise
Presenting this set of slides with name - Drill Down Sales For Year And Quarter Wise. This is a two stage process. The stages in this process are Drill Down, Hierarchy, Top Downwards.
Toggle Nav

Skip to Content

Search
Notifications 5
-
 SlideTeam added 1499 new products (e.g. Completely Researched Decks, Documents, Slide Bundles, etc), which included 16489 slides in total in the past 24 hours.
2 hours ago
-
 See what the world is downloading for a kickass presentation. Check out our most popular products and get inspired.
21 hours ago
-
 SlideTeam has published a new blog titled "Las 10 mejores plantillas de presentación de procesos de adquisiciones con ejemplos y muestras".
22 hours ago
-
 SlideTeam has published a new blog titled "Top 10 Software Risk Analysis Templates with Examples and Samples".
22 hours ago
-
 SlideTeam has published a new blog titled "Os 10 principais modelos de apresentação de benchmarking com exemplos e amostras".
22 hours ago


